 🏷️ Likely Rental
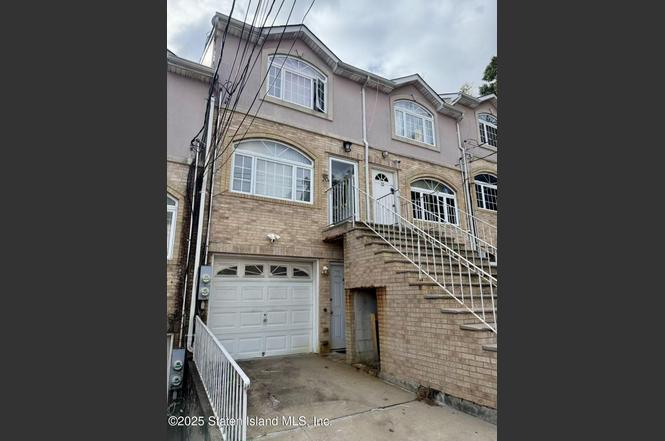
20 Tessa Ct · New York, NY
Flood risk 1/10 · Minimal
- FEMA flood zone
- X (unshaded)
- Chance of flooding over 30 yrs
- 0.0%
- Est. flood insurance / yr
- $507 – $1,088
Fire risk 1/10 · Minimal
- Est. fire insurance / yr
- $691 – $1,283
Heat risk 7/10 · Major
- Hot days now (above 98°F)
- 7 days/yr
- Hot days in 30 yrs
- 16 days/yr
Wind risk 6/10 · Moderate
- Chance of severe wind over 30 yrs
- 61.0%
Air-quality risk 4/10 · Minor
- Unhealthy air days now
- 5 days/yr
- Unhealthy air days in 30 yrs
- 7 days/yr
Risk factors via First Street. Map © Google.
Why this score? — see what drove the C+ grade
The composite is a weighted blend of 9 inputs, each scored 0–100. Each bar is that input's sub-score; the figure is the points it added to the 100-point composite (weight × sub-score).
- Cash flow +21.9/30.0
- ARV discount +15.0/15.0
- DSCR +7.0/10.0
- 1% rule +5.3/10.0
- Schools +5.0/10.0
- Livability +3.8/5.0
- Rent growth +3.0/5.0
- Condition / age +2.5/5.0
- Appreciation +0.0/10.0
$598,800
🖨 Deal sheet (PDF) 📄 Offer letter ✓ Due diligence
Multi-family units
County records classify this as Multi-Family (2-4 Unit). Listing-text estimate: 2 units. confirmed
Listing remarks
House being sold 'as is'. Current monthly rent: 3,460. Both tenants have no lease(expired). Young 2 Family townhouse. Great investment property. Main unit 4 Bedrooms. Second unit Studio apartment. Level 1: Living Room, 1/2 bath, large eat in kitchen. Sliders to yard. Level 2: Primary bedroom w/ 3/4 private bath. 2nd bedroom, 3rd bedroom. Full bath. Level 3: 4th bedroom. Basement: Above the ground studio apartment. Roof was redone last year. Very convenient area, close to Ferry and Bridge. Steady Income. House being sold 'as is'. Current monthly rent: 3,460
Key facts
- Sliders to yard
- Private bath
- Eat in kitchen
Tags
Property features AI
Finance
- Other: Property condition described as excellent
- Financial info: Multifamily with 2 total units; Unit 1 current rent listed as $2,300/month; No additional income or expense details provided
- HOA & community: Has association with $80 fee; Association covers snow removal and outside maintenance
Exterior
- Parking: Attached garage (1 space); Carport; Off-street parking
- Security: No security details provided
- Utilities: 110-volt electric service
- Home design: 3-story multifamily building; Total building area approximately 2,280; Approximate year built
- Construction: Brick, stucco, and vinyl siding exterior
- Exterior features: Lot dimensions approximately 14 x 148; Lot is approximately 0.05 acres; Zoned R-3A
Interior
- Kitchen: No kitchen appliance details provided
- Bedrooms: Unit 1: 4 bedrooms; Unit 2: (bedroom count not provided)
- Flooring: No flooring details provided
- Bathrooms: Total of 5 bathrooms (2 full, 2 three-quarter, 1 half); Unit 1: 3 baths; Unit 2: (bath count not provided)
- Heating & cooling: Natural gas heating with forced air; Has heating; Has cooling
- Interior features: Central air conditioning; Excellent condition
- Laundry & utility: No laundry details provided
Neighborhood map
What this means for you Summary
Snapshot
- This is a 2 × 2-bed/2.8-bath units multifamily listed at $599k.
Deal economics
- At list price, monthly cash flow is $939 ($11k/yr) — positive. Per door: $469/mo.
- The deal already cash-flows at list — no discount required.
- Meets the 1% rule at list price ($6k rent vs $599k).
- Recommended offer: $527k (12.0% below list) — sets the bar for market timing.
- Cap rate 8.2% vs local median 2.6% in New York — top-decile yield for the area; either an underpriced asset or a hidden risk that comps aren't pricing in. Stress-test before assuming the spread holds.
Location & tenants
- Location reads 75/100 on livability (#268 in NY, #4,188 nationally) — a middle-class / working-renter tenant base. Strengths: amenities A+, commute A+, health & safety A; Watch: crime F, cost of living F.
- Market conditions: Rents rising (+2.0%/yr); 204 active listings in the ZIP; 3 comparable units currently listed for rent nearby; rentals leasing fast (median 9d on market — plan ~1-2 weeks tenant-placement turnaround); 480 units permitted in Richmond County in 2024 (22 in 5+ unit buildings).
- At $6,161/mo this rent would consume 103% of the median local household income ($72k/yr) (locally 2401% of renters already pay >50% of income on rent) — very limited rent-growth headroom before tenants either downsize or default.
Forward outlook
- Local home prices are declining (-3.0%/yr); year-one equity from $4k of loan paydown is wiped out by about $18k of value loss. Plan a longer hold.
- Richmond County population projected to shrink 5% by 2050 — rents likely to lag national; underwrite the cash flow, not the appreciation.
Negotiation context
- It's been on market 213 days — a 12% lower offer ($527k) is reasonable based on typical stale-listing flexibility.
- 3 sale attempts since 17y ago; this cycle's ask has dropped $39k (6%) from the opening price — seller is motivated, your offer sets the floor, not the list.
- Current owner paid $500k; 20% above their basis — modest negotiation headroom, anchor on the comps not their cost.
Risks & watch-outs
- Climate carrying-cost: major wind risk, 61% chance of damaging wind over 30y; extreme-heat days projected 7→16/yr by 2055 (HVAC capex compounding) — expect insurance premiums to compound above CPI over the hold.
Questions for the listing agent
- It's been on market 213 days. Have you received any prior offers? Is the seller open to a 12% concession, seller financing, or rate buy-down credit?
- Can we see the unit-by-unit rent roll, current vacancy, and any below-market leases? What's the average tenancy length?
- What capital expenditures (roof, boiler, parking lot, exteriors) have been made in the last 5 years, and what's planned in the next 2?
- What does the HOA fee cover, when was the last increase, and are there any pending special assessments or reserve-fund shortfalls?
- Why hasn't it sold? Are there any deal-killer items the seller is aware of (foundation, flood, title, zoning, code violations)?
- Is there a deadline driving the sale (1031 exchange, divorce, estate, relocation)? That informs how much negotiation room exists.
- Schools are B-rated — typically a magnet for longer-tenancy family renters. What's the average tenant stay here, and is there a school-zone premium baked into asking?
- Crime grade is F in this area — have there been break-ins, vandalism, or insurance claims at this property in the last 3 years? What carrier currently insures it and at what premium?
- What's the average days-on-market for RENTAL listings here right now (not sales)? A rising rental-DOM trend means longer vacancies and softer asking-rent achievability than the comps imply.
- What's the recent tenant-quality profile in this submarket — average credit score on applications, eviction rate, late-payment / NSF rate, and stable-employment percentage? A property-management company in the area should have these aggregated.
- How much new apartment / multifamily construction is in the pipeline within 1–3 miles? Heavy new supply (>2% of stock underway) typically softens rents 12–24 months out; light construction supports rent growth.
Investment metrics
- 1% rule
- 1.03% ✓
- Cap rate
- 8.17%
- Cash-on-cash
- 6.72%
- DSCR
- 1.30
- GRM
- 8.1
CMA / ARV
- ARV (on-the-fly)
- $791,160
- Comps found
- 10
Show comp detail 10 sales within ~0.75 mi
| Address | Dist | Beds/Ba | Sqft | Sold | Price | $/sf | Match |
|---|---|---|---|---|---|---|---|
| 806 Van Duzer St | 0.09mi | 4/2.5 | 2,150 (-6%) | 4mo | $938,000 | $436 | 70 |
| 21 Maxie Ct | 0.06mi | 3/2.5 (-1) | 2,352 (+3%) | 12mo | $648,000 | $276 | 64 |
| 810 Van Duzer St | 0.10mi | 5/1.5 (+1) | 2,150 (-6%) | 4mo | $830,000 | $386 | 62 |
| 17 Maxie Ct | 0.06mi | 4/1.5 | 2,010 (-12%) | 5mo | $635,000 | $316 | 57 |
| 57 Broad St | 0.55mi | 4/5.0 | 2,480 (+9%) | 2mo | $430,000 | $173 | 56 |
| 58 Vanderbilt Ave | 0.63mi | 5/2.5 (+1) | 2,272 (-0%) | 10mo | $780,000 | $343 | 44 |
| 243 Tompkins Ave | 0.55mi | 3/3.5 (-1) | 2,006 (-12%) | 2mo | $660,000 | $329 | 40 |
| 241 Tompkins Ave | 0.55mi | 4/2.5 | 2,016 (-12%) | 6mo | $700,000 | $347 | 38 |
| 330 Van Duzer St | 0.73mi | 5/4.5 (+1) | 2,012 (-12%) | 1mo | $740,000 | $368 | 36 |
| 76 Highland Ave | 0.66mi | 3/1.0 (-1) | 1,976 (-13%) | 7mo | $810,000 | $410 | 21 |
Match score weights: distance 35% · size 25% · config 20% · recency 20%. Top-matched comps best support the ARV.
Projected returns pro-forma
-3.0% appreciation · 1.99% rent growth · sell at horizon
- IRR
- -7.1%
- Equity multiple
- 0.74×
- Total profit
- $-43,492
- Equity at exit
- $89,283
- IRR
- 1.2%
- Equity multiple
- 1.08×
- Total profit
- $14,027
- Equity at exit
- $51,773
Cash invested: $167,664 (down + closing). Projections, not guarantees.
Landlord ↔ Tenant lean methodology
- Overall (CITY)
- 0 Strongly Tenant-Friendly
- State New York
- 15 Strongly Tenant-Friendly · D+10
- County
- — inherits STATE
- City New York
- 0 Strongly Tenant-Friendly · D+34
ZIP-level market 10304
- Rents YoY
- 2.0%
- Active inventory
- 204
- Price-to-rent
- 16.2×
Monthly cashflow live
- Estimated rent
- $6,161 high interval (Pro) →
- Mortgage (P&I)
- −$3,140
- Tax from tax record
- −$459 /mo · $5,508/yr
- Insurance
- −$250
- HOA
- −$80
- Vacancy / Maint / Mgmt
- −$1,294
- Net cashflow
- $939
Break-even live
Sensitivity live
| Price | -10% $1,277 | -5% $1,108 | +0% $939 | +5% $769 | +10% $600 |
|---|---|---|---|---|---|
| Rent | -10% $452 | -5% $695 | +0% $939 | +5% $1,182 | +10% $1,425 |
| Rate | -1.0pp $1,240 | -0.5pp $1,091 | base $939 | +0.5pp $783 | +1.0pp $625 |
2-unit breakdown (identical units grouped — click to expand)
| Units | Beds | Baths | Est. rent |
|---|---|---|---|
| 2× units | 2 | 2.8 | $6,162 |
| #1 | 2 | 2.8 | $3,081 |
| #2 | 2 | 2.8 | $3,081 |
| Total (2 units) | $6,161 | ||
UW: 25.0% down · 7.5% · 30yr · 1.5% tax · 5.0% vac · 8.0% maint · 8.0% mgmt
Financing live
Cash to close
- Down payment
- $149,700
- Closing costs
- $17,964
- Reserves months
- —
- Total cash needed
- —
Loan-product check · same deal, 3 products live
Conventional
25% down · 7.5% · 30yr
- Down + closing
- —
- Monthly P&I
- —
- Monthly cashflow
- —
- DSCR
- —
- Eligible?
- —
Personal DTI + credit; lowest rate.
DSCR
20% down · 8.5% · 30yr
- Down + closing
- —
- Monthly P&I
- —
- Monthly cashflow
- —
- DSCR
- —
- Eligible?
- —
No personal income docs; deal must DSCR.
Hard money
10% down · 12.0% · 12mo
- Down + closing
- —
- Monthly P&I
- —
- Monthly cashflow
- —
- DSCR
- —
- Eligible?
- —
Short-term bridge; refi at stabilization.
Rent comps 3 comps
| Address | Beds | Baths | Sqft | Rent | $/sqft | DOM | Units | Dist |
|---|---|---|---|---|---|---|---|---|
| 17 Cunard Ave Staten Island, NY | 3.0 | 2.0 | 1700 | $3,650 | $2.15 | 25d | 1 | 0.47mi |
| 37 Ely St Staten Island, NY | 4.0 | 2.0 | 2600 | $3,999 | $1.54 | 7d | 1 | 1.09mi |
| 64 Claradon Ln Staten Island, NY | 3.0 | 2.5 | 1976 | $3,500 | $1.77 | 8d | 1 | 1.45mi |
HOA detail
- Monthly dues
- $80 · $960/yr
Listing history 16 events
-
2026-06-13statusdays on market $598,800 Pending 213 DOM
-
2026-06-10days on market $598,800 Active 212 DOM
-
2026-06-08days on market $598,800 Active 211 DOM
-
2026-06-04days on market $598,800 Active 207 DOM
-
2026-06-03days on market $598,800 Active 206 DOM
-
2026-06-01days on market $598,800 Active 204 DOM
-
2026-05-31days on market $598,800 Active 203 DOM
-
2026-04-15price $598,800
-
2025-12-17status Active
-
2025-12-01historical
-
2025-10-27historical Contingent
-
2025-10-24$638,000 Active
-
2022-05-13soldstatus $500,000
-
2018-04-30soldstatus $52,000
-
2014-12-09historical
-
2009-09-16$439,000
ⓘ Source: listings_history table (triggers on properties + properties_extension) + one-shot
backfill from property_details.listing_events for pre-trigger history.
Tax reassessment forecast NY · Partial reset (capped growth)
- Current annual tax
- $5,508 · $459/mo
- Projected year-2 tax
- $7,814 · $651/mo
- Expected delta
- +$2,306/yr (+$192/mo · 41.9%)
ⓘ Screening estimate from a state-policy table — verify with the county assessor before closing.
Climate risk First Street
- Flood 1/10 Low FEMA zone X (unshaded) · 0% chance over 30 yrs
- Wildfire 1/10 Low
- Heat 7/10 Severe 7 d/yr ≥98°F today · 16 d/yr by 30 yrs out
- Wind 6/10 Major 61% chance of damaging wind over 30 yrs
- Air quality 4/10 Moderate 5 unhealthy d/yr today · 7 by 30 yrs out
Nearby sold comps map
Loading sold comps map…
Walkable amenities ~0.75 mi
Loading nearby amenities…
Taxation est. · year 1
- Rental income
- $73,932
- − Mortgage interest
- −$33,542
- − Property taxes
- −$5,508
- − Insurance
- −$2,994
- − Repairs & maintenance
- −$5,915
- − Management
- −$5,915
- − HOA
- −$960
- − Depreciation
- −$17,420
- Taxable income
- $1,679
- Est. tax owed @ 24.0%
- −$403
- After-tax cash flow
- $10,859/yr
For passive investors: Depreciation is non-cash, so a rental often shows a tax loss while cash-flowing — sheltering income. Rental losses are passive: they offset passive income freely, and up to $25,000/yr can offset ordinary (W-2) income if you actively participate and your MAGI is under $100k (phasing out to $0 by $150k); unused losses carry forward. On sale, claimed depreciation is recaptured at up to 25%, and gains may owe capital-gains tax (a 1031 exchange can defer both). Figures are a year-1 estimate at your 24.0% rate — not tax advice; consult a CPA.
Schools (NCES district)
No district data.
Livability — New York
- Score
- 75/100
- State rank
- #268
- US rank
- #4188
Category grades
Schools grade is shown separately in the Schools card above.
Census & demographics
- Census place
- New York, NY
- County
- Richmond County · 404,174 people
- City population
- 7,731,280
- Metro
- New York-Newark-Jersey City, NY-NJ-PA
- Population (ZIP)
- 45,658
- Household income
- $71,561
- Rent vs Own
- Severe rent burden
- 2401.0
Population outlook (Richmond County) Hauer SSP2
- Today (2025)
- 482,784 people
- By 2030
- 481,831 · -0.2%
- By 2040
- 473,159 · -2.0%
- By 2050
- 457,242 · -5.3%
- By 2075
- 408,029 · -15.5%
- By 2100
- 341,459 · -29.3%
Race, ethnicity, and origin ACS 2023
- Neighborhood character
- Highly diverse neighborhood (Simpson 0.73)
- Race & ethnicity
- White 36% Black 25% Hispanic / Latino 24% Asian 13% Two or more races 8% Native American 1%
- Hispanic origin (detail)
- Mexican 4% Puerto Rican 10% Dominican 2%
- Common ancestry
- Scotch-Irish 3% Romanian 2% Swiss 2%
- Foreign-born
- 32% · Canada, China, Jamaica
- Languages at home
- 54% English-only · Spanish 16% Chinese 8% Other Indo-European 5%
Political lean MEDSL · Richmond
- 2024 margin
- Strong R (+29.8) · D 35.1% · R 64.9%
- 2008→2024 swing
- -25.7pp toward R · 2008: -4.0pp · 2024: -29.8pp
- All cycles
- 2024: R+29.8 2020: R+14.9 2016: R+16.8 2012: D+0.8 2008: R+4.0
Not yet ingested
- Civics
- —
Market trends
- HPI YoY
- ▼ -254.93%
- Current HPI
- 346.7976
- Rent YoY
- ▲ 1.99%
- Metro
- New York-Newark-Jersey City, NY-NJ-PA
- State GDP YoY
- ▲ 2.60%
- F500 in state
- 92
Industry mix (Fortune 500 HQ in NY)
| Industry | F500 HQs | Revenue |
|---|---|---|
| Financial Services | 10 | $950B |
|
||
| Consumer Goods | 9 | $162B |
|
||
| Insurance | 4 | $225B |
|
||
| Telecommunications | 2 | $144B |
|
||
| Pharmaceuticals | 2 | $112B |
|
||
| Media / Entertainment | 2 | $69B |
|
||
Price history
+36.4% since first listed9 events — show timeline
- 2026-04-15 Price Changed $598,800 SIBORMLS
- 2025-12-17 Relisted — SIBORMLS
- 2025-12-01 Listing Removed — SIBORMLS
- 2025-10-27 Contingent — SIBORMLS
- 2025-10-24 Listed $638,000 SIBORMLS
- 2022-05-13 Sold (Public Records) $500,000 Public Records
- 2018-04-30 Sold (Public Records) $52,000 Public Records
- 2014-12-09 Listing Removed — SIBORMLS
- 2009-09-16 Listed $439,000 SIBORMLS
Property tax history
+2.5%/yrLatest (2025): $5,508 · +6.0% YoY. Source: county tax records.
Cash-flow waterfall
monthlySold comps — $/sqft
last 12 mo · ≤1 miLoading sold comps…