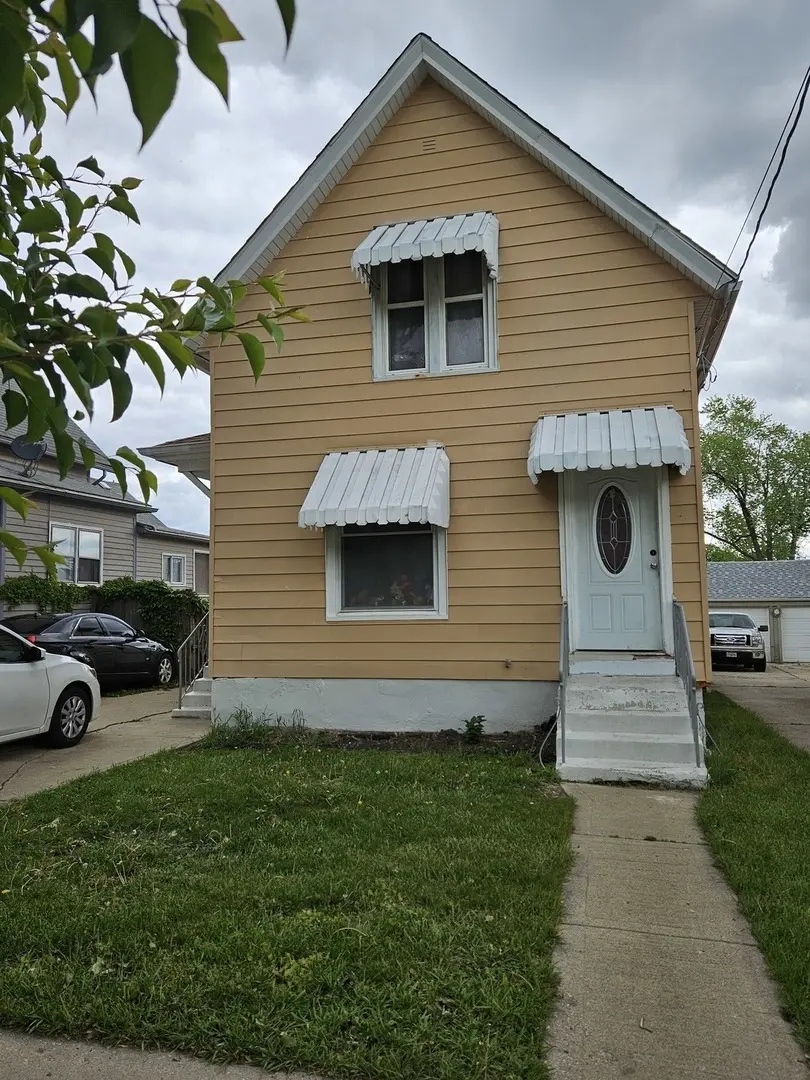
315 Vandalia St · Elgin, IL
Flood risk 1/10 · Minimal
- FEMA flood zone
- X (unshaded)
- Chance of flooding over 30 yrs
- 0.0%
- Est. flood insurance / yr
- $473 – $860
Fire risk 1/10 · Minimal
- Est. fire insurance / yr
- $804 – $1,492
Heat risk 3/10 · Minor
- Hot days now (above 102°F)
- 7 days/yr
- Hot days in 30 yrs
- 14 days/yr
Wind risk 2/10 · Minimal
- Chance of severe wind over 30 yrs
- 0.0%
Air-quality risk 2/10 · Minimal
- Unhealthy air days now
- 1 days/yr
- Unhealthy air days in 30 yrs
- 2 days/yr
Risk factors via First Street. Map © Google.
Why this score? — see what drove the D grade
The composite is a weighted blend of 9 inputs, each scored 0–100. Each bar is that input's sub-score; the figure is the points it added to the 100-point composite (weight × sub-score).
- Cash flow +12.6/30.0
- ARV discount +11.7/15.0
- 1% rule +4.7/10.0
- Livability +4.2/5.0
- DSCR +3.8/10.0
- Rent growth +3.4/5.0
- Condition / age +2.5/5.0
- Schools +1.9/10.0
- Appreciation +0.0/10.0
$211,000
🖨 Deal sheet (PDF) 📄 Offer letter ✓ Due diligence
Listing remarks MLS
Don't miss out opportunity to make this your home. 3 bedrooms, 2 full bathrooms. House has tons of potential bring your ideas. Upstirs 2 bedrooms with 1 bathroom and 1 bedroom located on main level. Unfinished basement has planty of room for storage. Nice size back yard. Great and convenient location.
Key facts
- 2 parking spots
- Built 1920
- Listed 393 days
Neighborhood map
What this means for you Summary
Snapshot
- This is a 3-bed/2.0-bath single-family listed at $211k.
Deal economics
- At list price, monthly cash flow is $-25 ($-304/yr) — negative.
- To cash-flow at today's rent, offer at most $207k (2.1% below list).
- To meet the 1% rule (rent ≥ 1% of price), the offer needs to be $205k (2.8% below list).
- Recommended offer: $186k (12.0% below list) — sets the bar for market timing.
- Cap rate 6.1% vs local median 3.4% in Elgin — top-decile yield for the area; either an underpriced asset or a hidden risk that comps aren't pricing in. Stress-test before assuming the spread holds.
Location & tenants
- Location reads 83/100 on livability (#47 in IL, #975 nationally) — a professional / high-income tenant draw. Strengths: amenities A+, commute A+, housing A+; Watch: health & safety C-.
- SD U-46 (suburban): math 19% / reading 20% proficiency, ranked #386 of 620 in IL (top 62%) — low school quality limits family demand, transient renter base, plan for 1-2y turnover.
- Zoned schools: Harriet Gifford Elem School (math 2% / reading 2%, grade F, #1,927 of 2,056 statewide, top 100%, 461 students, 0% FRL); Abbott Middle School (math 5% / reading 10%, grade F, #612 of 665 statewide, top 93%, 551 students, 0% FRL); Larkin High School (math 10% / reading 13%, grade F, #520 of 693 statewide, top 75%, 2,264 students, 0% FRL) — zoned schools average 0% FRL vs 52% district-wide (52 pts lower); this property's tenant base skews higher-income than the district average.
- Zoned-school proficiency averages 7% at this address vs 20% district-wide (-12 pts) — the specific schools serving this property underperform the SD U-46 average; the district grade overstates school quality for this exact location.
- Market conditions: Rents rising (+3.7%/yr); 89 active listings in the ZIP; 14 comparable units currently listed for rent nearby; rentals at typical pace (median 23d on market — plan ~3-4 weeks tenant-placement turnaround); solid renter incomes; 1,944 units permitted in Kane County in 2024 (357 in 5+ unit buildings).
Forward outlook
- Local home prices are declining (-3.0%/yr); year-one equity from $1k of loan paydown is wiped out by about $6k of value loss. Plan a longer hold.
Negotiation context
- It's been on market 393 days — a 12% lower offer ($186k) is reasonable based on typical stale-listing flexibility.
- 4 sale attempts since 14y ago; this cycle's ask has dropped $28k (12%) from the opening price — seller is motivated, your offer sets the floor, not the list.
- Current owner paid $32k; list at $211k implies a 559% gain — meaningful room to come down on a strong offer.
Risks & watch-outs
- Watch-outs: property tax is 2.6% of price; built in 1920 — expect roof / HVAC / electrical / plumbing capex.
Questions for the listing agent
- What do current leases actually rent for vs. the listed asking? Can we see a recent rent roll and the last 12 months of T-12 income?
- It's been on market 393 days. Have you received any prior offers? Is the seller open to a 12% concession, seller financing, or rate buy-down credit?
- Built in 1920 — when were the roof, HVAC, electrical panel, plumbing, and water heater last replaced?
- Property tax is high relative to price — has the assessment been appealed recently, and will the sale trigger a re-assessment?
- Why hasn't it sold? Are there any deal-killer items the seller is aware of (foundation, flood, title, zoning, code violations)?
- Is there a deadline driving the sale (1031 exchange, divorce, estate, relocation)? That informs how much negotiation room exists.
- Schools are D-rated, which usually means shorter tenancies and higher turnover. Who's the typical renter profile here, and what's been the actual vacancy rate?
- The area grade is low — what's the realistic commute time and amenity access for the typical tenant pool here? Any planned neighborhood developments (good or bad) we should know about?
- What's the average days-on-market for RENTAL listings here right now (not sales)? A rising rental-DOM trend means longer vacancies and softer asking-rent achievability than the comps imply.
- What's the recent tenant-quality profile in this submarket — average credit score on applications, eviction rate, late-payment / NSF rate, and stable-employment percentage? A property-management company in the area should have these aggregated.
- How much new for-sale + rental construction is in the pipeline within 1–3 miles? Heavy new supply typically softens prices + rents 12–24 months out; constrained supply supports both.
Investment metrics
- 1% rule
- 0.97% ✗
- Cap rate
- 6.15%
- Cash-on-cash
- -0.52%
- DSCR
- 0.98
- GRM
- 8.6
CMA / ARV
- ARV (median comp)
- $232,461
- List price
- $211,000
- Delta
- -9.23%
- Verdict
- FAIR
- Comps
- 20 within 1.0 mi
Show comp detail 12 sales within ~0.75 mi
| Address | Dist | Beds/Ba | Sqft | Sold | Price | $/sf | Match |
|---|---|---|---|---|---|---|---|
| 50 Sheridan St | 0.36mi | 3/1.0 | 1,200 (0%) | 2mo | $250,000 | $208 | 78 |
| 375 S Edison Ave | 0.39mi | 3/2.0 | 1,125 (-6%) | 0mo | $300,000 | $267 | 71 |
| 63 S Union St | 0.34mi | 2/1.5 (-1) | 1,264 (+5%) | 1mo | $330,000 | $261 | 67 |
| 800 Morgan St | 0.26mi | 2/1.0 (-1) | 1,128 (-6%) | 3mo | $275,000 | $244 | 66 |
| 353 Wilcox Ave | 0.12mi | 4/2.0 (+1) | 1,352 (+13%) | 3mo | $229,000 | $169 | 66 |
| 121 Wilcox Ave | 0.24mi | 4/2.0 (+1) | 1,060 (-12%) | 1mo | $290,000 | $274 | 64 |
| 30 S Commonwealth Ave | 0.46mi | 3/2.0 | 1,088 (-9%) | 2mo | $250,000 | $230 | 62 |
| 25 N Worth Ave | 0.59mi | 3/1.0 | 1,264 (+5%) | 1mo | $306,000 | $242 | 59 |
| 490 S Alfred Ave | 0.56mi | 3/1.0 | 1,320 (+10%) | 4mo | $280,000 | $212 | 50 |
| 12 N Du Bois Ave | 0.60mi | 3/2.0 | 1,047 (-13%) | 3mo | $300,000 | $287 | 48 |
| 231 S Aldine St | 0.53mi | 2/1.0 (-1) | 1,079 (-10%) | 6mo | $259,900 | $241 | 45 |
| 78 S Edison Ave | 0.52mi | 2/1.0 (-1) | 1,368 (+14%) | 3mo | $270,000 | $197 | 41 |
Match score weights: distance 35% · size 25% · config 20% · recency 20%. Top-matched comps best support the ARV.
Projected returns pro-forma
-3.0% appreciation · 3.69% rent growth · sell at horizon
- IRR
- -16.2%
- Equity multiple
- 0.42×
- Total profit
- $-34,227
- Equity at exit
- $31,461
- IRR
- -6.4%
- Equity multiple
- 0.57×
- Total profit
- $-25,326
- Equity at exit
- $18,243
Cash invested: $59,080 (down + closing). Projections, not guarantees.
Landlord ↔ Tenant lean methodology
- Overall (STATE)
- 43 Moderately Tenant-Leaning
- State Illinois
- 43 Moderately Tenant-Leaning · D+7
- County
- — inherits STATE
- City
- — inherits STATE
ZIP-level market 60123
- Rents YoY
- 3.7%
- Active inventory
- 89
- Price-to-rent
- 8.6×
Monthly cashflow live
- Estimated rent
- $2,051 high interval (Pro) →
- Mortgage (P&I)
- −$1,107
- Tax from tax record
- −$451 /mo · $5,411/yr
- Insurance
- −$88
- HOA
- −$0
- Vacancy / Maint / Mgmt
- −$431
- Net cashflow
- $-25
Break-even live
Sensitivity live
| Price | -10% $94 | -5% $34 | +0% $-25 | +5% $-85 | +10% $-145 |
|---|---|---|---|---|---|
| Rent | -10% $-187 | -5% $-106 | +0% $-25 | +5% $56 | +10% $137 |
| Rate | -1.0pp $81 | -0.5pp $28 | base $-25 | +0.5pp $-80 | +1.0pp $-136 |
UW: 25.0% down · 7.5% · 30yr · 1.5% tax · 5.0% vac · 8.0% maint · 8.0% mgmt
Financing live
Cash to close
- Down payment
- $52,750
- Closing costs
- $6,330
- Reserves months
- —
- Total cash needed
- —
Loan-product check · same deal, 3 products live
Conventional
25% down · 7.5% · 30yr
- Down + closing
- —
- Monthly P&I
- —
- Monthly cashflow
- —
- DSCR
- —
- Eligible?
- —
Personal DTI + credit; lowest rate.
DSCR
20% down · 8.5% · 30yr
- Down + closing
- —
- Monthly P&I
- —
- Monthly cashflow
- —
- DSCR
- —
- Eligible?
- —
No personal income docs; deal must DSCR.
Hard money
10% down · 12.0% · 12mo
- Down + closing
- —
- Monthly P&I
- —
- Monthly cashflow
- —
- DSCR
- —
- Eligible?
- —
Short-term bridge; refi at stabilization.
Rent comps 14 comps
| Address | Beds | Baths | Sqft | Rent | $/sqft | DOM | Units | Dist |
|---|---|---|---|---|---|---|---|---|
| 261 Orchard St Elgin, IL | 2.0 | 1.0 | 1200 | $2,750 | $2.29 | 45d | 1 | 0.26mi |
| 202 Perry St Unit 1 Elgin, IL | 3.0 | 1.5 | 1100 | $2,000 | $1.82 | 45d | 1 | 0.41mi |
| 276 Morgan St Unit 1 Elgin, IL | 2.0 | 1.0 | 1200 | $1,800 | $1.50 | 12d | 1 | 0.59mi |
| 719 W Highland Ave Elgin, IL | 2.0 | 2.0 | 900 | $1,485 | $1.65 | 3d | 1 | 0.61mi |
| 52 N Crystal St Elgin, IL | 2.0 | 1.0 | 1200 | $1,895 | $1.58 | 26d | 1 | 0.71mi |
| 50 S Grove Ave Elgin, IL | 1.0–3.0 | 1.0–2.0 | 1563 | $3,100 | $1.98 | 45d | 3 | 0.84mi |
| 3 Times Square Rd Unit 102 Elgin, IL | 2.0 | 1.0 | 775 | $1,450 | $1.87 | 20d | 1 | 1.06mi |
| 203 Symphony Way Unit B Elgin, IL | 2.0 | 1.0 | 750 | $1,425 | $1.90 | 45d | 1 | 1.10mi |
| 292 Villa St Apt 4 Elgin, IL | 2.0 | 1.0 | 800 | $1,350 | $1.69 | 45d | 1 | 1.16mi |
| 92 Pauline Dr Unit 2 Elgin, IL | 2.0 | 1.0 | 800 | $1,300 | $1.62 | 22d | 1 | 1.24mi |
| 418 Saint Charles St Unit B Elgin, IL | 2.0 | 1.0 | 900 | $1,700 | $1.89 | 19d | 1 | 1.26mi |
| 1716 Maple Ln Elgin, IL | 2.0 | 1.0 | 791 | $1,850 | $2.34 | 5d | 1 | 1.38mi |
| 406 Prospect Blvd Unit 2 Elgin, IL | 2.0 | 1.0 | 900 | $1,525 | $1.69 | 6d | 1 | 1.43mi |
| 420 Prospect Blvd Unit 1-N Elgin, IL | 2.0 | 1.0 | 800 | $1,700 | $2.12 | 9d | 1 | 1.45mi |
Listing history 32 events
-
2026-06-21days on market $211,000 Active 393 DOM
-
2026-06-18days on market $211,000 Active 390 DOM
-
2026-06-17days on market $211,000 Active 389 DOM
-
2026-06-16days on market $211,000 Active 388 DOM
-
2026-06-15days on market $211,000 Active 387 DOM
-
2026-06-13days on market $211,000 Active 385 DOM
-
2026-06-09days on market $211,000 Active 381 DOM
-
2026-06-08days on market $211,000 Active 380 DOM
-
2026-06-07days on market $211,000 Active 379 DOM
-
2026-06-04days on market $211,000 Active 376 DOM
-
2026-06-03days on market $211,000 Active 375 DOM
-
2026-06-02days on market $211,000 Active 374 DOM
-
2026-06-01days on market $211,000 Active 373 DOM
-
2026-05-31days on market $211,000 Active 372 DOM
-
2025-10-15price $211,000 304-char remark
Show marketing remark (304 chars)
Don't miss out opportunity to make this your home. 3 bedrooms, 2 full bathrooms. House has tons of potential bring your ideas. Upstirs 2 bedrooms with 1 bathroom and 1 bedroom located on main level. Unfinished basement has planty of room for storage. Nice size back yard. Great and convenient location.
-
2025-08-28price $215,000 304-char remark
Show marketing remark (304 chars)
Don't miss out opportunity to make this your home. 3 bedrooms, 2 full bathrooms. House has tons of potential bring your ideas. Upstirs 2 bedrooms with 1 bathroom and 1 bedroom located on main level. Unfinished basement has planty of room for storage. Nice size back yard. Great and convenient location.
-
2025-05-24$239,500 Active 304-char remark
Show marketing remark (304 chars)
Don't miss out opportunity to make this your home. 3 bedrooms, 2 full bathrooms. House has tons of potential bring your ideas. Upstirs 2 bedrooms with 1 bathroom and 1 bedroom located on main level. Unfinished basement has planty of room for storage. Nice size back yard. Great and convenient location.
-
2014-04-30soldstatus $32,000 Closed Sale 31-char remark
Show marketing remark (31 chars)
There are no remarks available.
-
2014-04-18status Pending 31-char remark
Show marketing remark (31 chars)
There are no remarks available.
-
2014-03-28historical 31-char remark
Show marketing remark (31 chars)
There are no remarks available.
-
2014-02-28status Pending 31-char remark
Show marketing remark (31 chars)
There are no remarks available.
-
2014-02-12historical
-
2014-02-07$38,500 New 31-char remark
Show marketing remark (31 chars)
There are no remarks available.
-
2013-10-10status Pending
-
2013-06-04historical Contingent
-
2013-05-22price Price Change
-
2013-03-14status Reactivated
-
2013-02-08historical Contingent
-
2013-01-07price Price Change
-
2012-12-07price Price Change
-
2012-10-26New
-
2003-12-16soldstatus $141,000
ⓘ Source: listings_history table (triggers on properties + properties_extension) + one-shot
backfill from property_details.listing_events for pre-trigger history.
Tax reassessment forecast IL · Partial reset (capped growth)
- Current annual tax
- $5,411 · $451/mo
- Projected year-2 tax
- $5,411 · $451/mo
- Expected delta
- $0/yr ($0/mo · 0.0%)
ⓘ Screening estimate from a state-policy table — verify with the county assessor before closing.
Climate risk First Street
- Flood 1/10 Low FEMA zone X (unshaded) · 0% chance over 30 yrs
- Wildfire 1/10 Low
- Heat 3/10 Moderate 7 d/yr ≥102°F today · 14 d/yr by 30 yrs out
- Wind 2/10 Low 0% chance of damaging wind over 30 yrs
- Air quality 2/10 Low 1 unhealthy d/yr today · 2 by 30 yrs out
Nearby sold comps map
Loading sold comps map…
Walkable amenities ~0.75 mi
Loading nearby amenities…
Taxation est. · year 1
- Rental income
- $24,607
- − Mortgage interest
- −$11,819
- − Property taxes
- −$5,411
- − Insurance
- −$1,055
- − Repairs & maintenance
- −$1,969
- − Management
- −$1,969
- − Depreciation
- −$6,138
- Taxable loss
- −$3,753
- Est. tax savings @ 24.0%
- +$901
- After-tax cash flow
- $596/yr
For passive investors: Depreciation is non-cash, so a rental often shows a tax loss while cash-flowing — sheltering income. Rental losses are passive: they offset passive income freely, and up to $25,000/yr can offset ordinary (W-2) income if you actively participate and your MAGI is under $100k (phasing out to $0 by $150k); unused losses carry forward. On sale, claimed depreciation is recaptured at up to 25%, and gains may owe capital-gains tax (a 1031 exchange can defer both). Figures are a year-1 estimate at your 24.0% rate — not tax advice; consult a CPA.
Schools (NCES district)
- District
- SD U-46
- NCES district ID
- 1713710
- Math proficiency
- 19% ▼ -7.00%
- Reading proficiency
- 20% ▼ -7.00%
- Median HH income
- $69,757
- Composite
- 19.39/100
- National rank
- #8783
- State rank
- #386 of 620 in IL
Livability — Elgin
- Score
- 83/100
- State rank
- #47
- US rank
- #975
Category grades
Schools grade is shown separately in the Schools card above.
Census & demographics
- Census place
- Elgin, IL
- County
- Kane County · 361,735 people
- City population
- 124,091
- Metro
- Chicago-Naperville-Elgin, IL-IN-WI
- Population (ZIP)
- 48,379
- Household income
- $87,693
- Rent vs Own
- Severe rent burden
- 1119.0
Population outlook (Kane County) Hauer SSP2
- Today (2025)
- 559,449 people
- By 2030
- 568,757 · +1.7%
- By 2040
- 575,969 · +3.0%
- By 2050
- 563,477 · +0.7%
- By 2075
- 492,321 · -12.0%
- By 2100
- 380,943 · -31.9%
Race, ethnicity, and origin ACS 2023
- Neighborhood character
- Diverse neighborhood (Simpson 0.63)
- Race & ethnicity
- Hispanic / Latino 47% White 38% Two or more races 17% Black 6% Asian 5% Native American 1%
- Hispanic origin (detail)
- Mexican 38% Puerto Rican 4%
- Common ancestry
- Romanian 5% Italian 2% Slovak 1%
- Foreign-born
- 23% · Canada, Jamaica
- Languages at home
- 57% English-only · Spanish 38% Other Asian/Pacific 1% Other Indo-European 1%
Political lean MEDSL · Kane
- 2024 margin
- Lean D (+9.4) · D 54.0% · R 44.6% · Other 1.4%
- 2008→2024 swing
- -2.4pp toward R · 2008: 11.8pp · 2024: 9.4pp
- All cycles
- 2024: D+9.4 2020: D+14.4 2016: D+8.9 2012: D+0.9 2008: D+11.8
Not yet ingested
- Civics
- —
Market trends
- HPI YoY
- ▼ -140.80%
- Current HPI
- 226.0713
- Rent YoY
- ▲ 3.69%
- Metro
- Chicago-Naperville-Elgin, IL-IN-WI
- State GDP YoY
- ▲ 1.59%
- F500 in state
- 60
Industry mix (Fortune 500 HQ in IL)
| Industry | F500 HQs | Revenue |
|---|---|---|
| Insurance | 4 | $201B |
|
||
| Consumer Goods | 4 | $87B |
|
||
| Industrial Machinery | 3 | $64B |
|
||
| Healthcare | 2 | $55B |
|
||
| Retail / Pharmacy | 1 | $148B |
|
||
| Agriculture / Food | 1 | $86B |
|
||
Price history
+49.6% since first listed18 events — show timeline
- 2025-10-15 Price Changed $211,000 MRED as Distributed by MLS Grid
- 2025-08-28 Price Changed $215,000 MRED as Distributed by MLS Grid
- 2025-05-24 Listed $239,500 MRED as Distributed by MLS Grid
- 2014-04-30 Sold (MLS) $32,000 MRED as Distributed by MLS Grid
- 2014-04-18 Pending — MRED as Distributed by MLS Grid
- 2014-03-28 Listing Removed — MRED as Distributed by MLS Grid
- 2014-02-28 Pending — MRED as Distributed by MLS Grid
- 2014-02-12 Listing Removed — MRED as Distributed by MLS Grid
- 2014-02-07 Listed $38,500 MRED as Distributed by MLS Grid
- 2013-10-10 Pending — MRED as Distributed by MLS Grid
- 2013-06-04 Contingent — MRED as Distributed by MLS Grid
- 2013-05-22 Price Changed — MRED as Distributed by MLS Grid
- 2013-03-14 Relisted — MRED as Distributed by MLS Grid
- 2013-02-08 Contingent — MRED as Distributed by MLS Grid
- 2013-01-07 Price Changed — MRED as Distributed by MLS Grid
- 2012-12-07 Price Changed — MRED as Distributed by MLS Grid
- 2012-10-26 Listed — MRED as Distributed by MLS Grid
- 2003-12-16 Sold (Public Records) $141,000 Public Records
Property tax history
+1.8%/yrLatest (2024): $5,411 · +3.9% YoY. Source: county tax records.
Cash-flow waterfall
monthlySold comps — $/sqft
last 12 mo · ≤1 miLoading sold comps…