222 Ny-143 · Greenville, NY
Flood risk 1/10 · Minimal
- FEMA flood zone
- X (unshaded)
- Chance of flooding over 30 yrs
- 0.0%
- Est. flood insurance / yr
- $507 – $1,088
Fire risk 4/10 · Minor
- Est. fire insurance / yr
- $691 – $1,283
Heat risk 2/10 · Minimal
- Hot days now (above 93°F)
- 6 days/yr
- Hot days in 30 yrs
- 12 days/yr
Wind risk 3/10 · Minor
- Chance of severe wind over 30 yrs
- 5.0%
Air-quality risk 1/10 · Minimal
- Unhealthy air days now
- 0 days/yr
- Unhealthy air days in 30 yrs
- 0 days/yr
Risk factors via First Street. Map © Google.
Why this score? — see what drove the C grade
The composite is a weighted blend of 9 inputs, each scored 0–100. Each bar is that input's sub-score; the figure is the points it added to the 100-point composite (weight × sub-score).
- Cash flow +19.1/30.0
- Appreciation +10.0/10.0
- DSCR +6.0/10.0
- 1% rule +5.1/10.0
- Schools +4.5/10.0
- ARV discount +4.4/15.0
- Livability +3.2/5.0
- Rent growth +2.5/5.0
- Condition / age +2.2/5.0
$149,000
🖨 Deal sheet 📄 Offer letter ✓ Due diligence
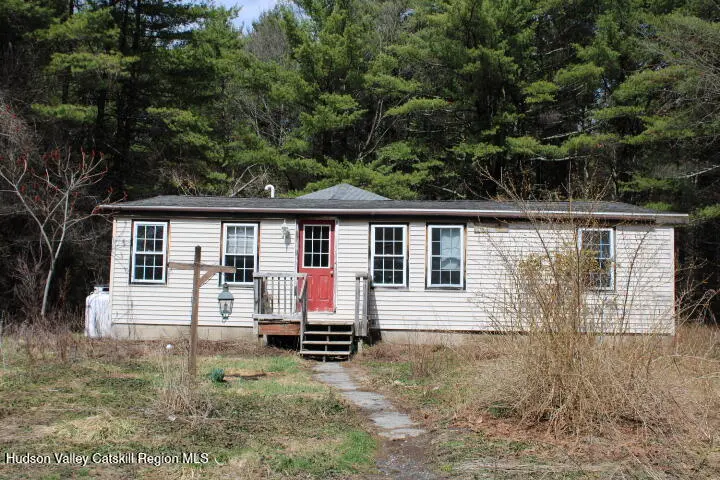
Listing remarks
This 5 bedroom fixer has many benefits adding to its potential. Situated on a five acre lot, it's within striking distance of the Capital District. There is a working well, septic and electric service. There is also a concrete slab suitable for either a garage, carport or other structure. The home is semi-secluded. Please do not enter without an appointment.
Key facts
- Five acre lot
- Electric service
- Working well
Tags
Neighborhood map
What this means for you Summary
Snapshot
- This is a 5-bed/2.0-bath single-family listed at $149k. Condition is rated fair.
Deal economics
- At list price, monthly cash flow is $157 ($2k/yr) — positive.
- The deal already cash-flows at list — no discount required.
- Meets the 1% rule at list price ($2k rent vs $149k).
- Cap rate 7.6% vs local median 3.1% in Greenville — top-decile yield for the area; either an underpriced asset or a hidden risk that comps aren't pricing in. Stress-test before assuming the spread holds.
Location & tenants
- Location reads 65/100 on livability (#713 in NY) — a middle-class / working-renter tenant base. Strengths: crime A+, employment A+, schools B+; Watch: amenities F, commute F, cost of living F.
- Greenville Central School District (rural): math 48% / reading 55% proficiency, ranked #338 of 590 in NY (top 57%) — acceptable for families but not a draw, mixed tenant base, ~2y average lease.
- Market conditions: 17 active listings in the ZIP; 675 units permitted in Albany County in 2024 (451 in 5+ unit buildings).
Forward outlook
- In year one you build about $16k of equity ($1k loan paydown + $15k appreciation (10.0% local appreciation)).
- Albany County population projected at +9% by 2050 — modest demand growth; plan on rents tracking national, not racing it.
- At projected returns (10.0% appreciation + 3.0% rent growth), your $42k cash investment doubles in ~3 years — after that, you're playing with house money.
- By year 3, paydown + projected appreciation supports a ~$40k cash-out refi (75% LTV) — recoverable capital for the next deal without selling this one.
Negotiation context
- Only 1 days on market — expect competitive offers; lowballing is unlikely to land.
Questions for the listing agent
- Have any recent inspections been done? Can we get a copy of the seller's disclosures and any deferred-maintenance estimates?
- Is there a deadline driving the sale (1031 exchange, divorce, estate, relocation)? That informs how much negotiation room exists.
- Schools are B-rated — typically a magnet for longer-tenancy family renters. What's the average tenant stay here, and is there a school-zone premium baked into asking?
- What's the average days-on-market for RENTAL listings here right now (not sales)? A rising rental-DOM trend means longer vacancies and softer asking-rent achievability than the comps imply.
- What's the recent tenant-quality profile in this submarket — average credit score on applications, eviction rate, late-payment / NSF rate, and stable-employment percentage? A property-management company in the area should have these aggregated.
- How much new for-sale + rental construction is in the pipeline within 1–3 miles? Heavy new supply typically softens prices + rents 12–24 months out; constrained supply supports both.
Investment metrics
- 1% rule
- 1.01% ✓
- Cap rate
- 7.56%
- Cash-on-cash
- 4.52%
- DSCR
- 1.20
- GRM
- 8.3
CMA / ARV
- ARV (on-the-fly)
- $139,380
- Comps found
- 1
Show comp detail 1 sale within ~0.75 mi
| Address | Dist | Beds/Ba | Sqft | Sold | Price | $/sf | Match |
|---|---|---|---|---|---|---|---|
| 222 Ny-143 | 0.00mi | 5/2.0 | 2,020 (0%) | 1mo | $140,000 | $69 | 100 |
Match score weights: distance 35% · size 25% · config 20% · recency 20%. Top-matched comps best support the ARV.
Projected returns pro-forma
10.0% appreciation · 3.0% rent growth · sell at horizon
- IRR
- 27.6%
- Equity multiple
- 3.19×
- Total profit
- $91,184
- Equity at exit
- $134,231
- IRR
- 24.1%
- Equity multiple
- 7.25×
- Total profit
- $260,693
- Equity at exit
- $289,474
Cash invested: $41,720 (down + closing). Projections, not guarantees.
Landlord ↔ Tenant lean methodology
- Overall (STATE)
- 15 Strongly Tenant-Friendly
- State New York
- 15 Strongly Tenant-Friendly · D+10
- County
- — inherits STATE
- City
- — inherits STATE
ZIP-level market 12193
- Home prices YoY
- 16.9%
- Active inventory
- 17
- Price-to-rent
- 8.3×
Monthly cashflow live
- Estimated rent
- $1,502 medium interval (Pro) →
- Mortgage (P&I)
- −$781
- Tax est. 1.5%
- −$186 /mo · $2,235/yr
- Insurance
- −$62
- HOA
- −$0
- Vacancy / Maint / Mgmt
- −$316
- Net cashflow
- $157
Break-even live
UW: 25.0% down · 7.5% · 30yr · 1.5% tax · 5.0% vac · 8.0% maint · 8.0% mgmt
Financing live
Cash to close
- Down payment
- $37,250
- Closing costs
- $4,470
- Reserves months
- —
- Total cash needed
- —
Loan-product check · same deal, 3 products live
Conventional
25% down · 7.5% · 30yr
- Down + closing
- —
- Monthly P&I
- —
- Monthly cashflow
- —
- DSCR
- —
- Eligible?
- —
Personal DTI + credit; lowest rate.
DSCR
20% down · 8.5% · 30yr
- Down + closing
- —
- Monthly P&I
- —
- Monthly cashflow
- —
- DSCR
- —
- Eligible?
- —
No personal income docs; deal must DSCR.
Hard money
10% down · 12.0% · 12mo
- Down + closing
- —
- Monthly P&I
- —
- Monthly cashflow
- —
- DSCR
- —
- Eligible?
- —
Short-term bridge; refi at stabilization.
Listing history 2 events
-
2026-04-04status Pending
-
2026-04-03$149,000 Active
ⓘ Source: listings_history table (triggers on properties + properties_extension) + one-shot
backfill from property_details.listing_events for pre-trigger history.
Climate risk First Street
- Flood 1/10 Low FEMA zone X (unshaded) · 0% chance over 30 yrs
- Wildfire 4/10 Moderate
- Heat 2/10 Low 6 d/yr ≥93°F today · 12 d/yr by 30 yrs out
- Wind 3/10 Moderate 5% chance of damaging wind over 30 yrs
- Air quality 1/10 Low 0 unhealthy d/yr today · 0 by 30 yrs out
Nearby sold comps map
Loading sold comps map…
Walkable amenities ~0.75 mi
Loading nearby amenities…
Taxation est. · year 1
- Rental income
- $18,029
- − Mortgage interest
- −$8,346
- − Property taxes
- −$2,235
- − Insurance
- −$745
- − Repairs & maintenance
- −$1,442
- − Management
- −$1,442
- − Depreciation
- −$4,335
- Taxable loss
- −$517
- Est. tax savings @ 24.0%
- +$124
- After-tax cash flow
- $2,010/yr
For passive investors: Depreciation is non-cash, so a rental often shows a tax loss while cash-flowing — sheltering income. Rental losses are passive: they offset passive income freely, and up to $25,000/yr can offset ordinary (W-2) income if you actively participate and your MAGI is under $100k (phasing out to $0 by $150k); unused losses carry forward. On sale, claimed depreciation is recaptured at up to 25%, and gains may owe capital-gains tax (a 1031 exchange can defer both). Figures are a year-1 estimate at your 24.0% rate — not tax advice; consult a CPA.
Condition & rehab AI · 13 photos
This 5-bedroom fixer-upper has a lot of potential but requires extensive repairs and maintenance to improve its condition and increase its value.
Repairs flagged
- Major roof — The roof appears to be in poor condition, with visible signs of wear and tear.
- Major exterior siding — The exterior siding is peeling and in need of repainting.
- Major flooring — The flooring in the interior appears to be in poor condition, with visible wear and tear.
- Major interior walls — The interior walls have visible cracks and peeling paint, indicating a need for repair and repainting.
- Major landscaping — The landscaping and fencing are overgrown and in need of maintenance.
Value-add opportunities
- Resale roof replacement — A new roof will significantly improve the home's appearance and increase its value.
- Resale exterior siding repair and repainting — A new exterior siding and repainting will improve the home's curb appeal and increase its value.
- Resale flooring replacement — New flooring will improve the home's appearance and increase its value.
- Resale interior wall repair and repainting — New interior walls and repainting will improve the home's appearance and increase its value.
- Both landscaping and fencing maintenance — Maintaining the landscaping and fencing will improve the home's curb appeal and increase its value.
Renovation cost estimate screening
| Repair item | Severity | Est. cost |
|---|---|---|
| roof · The roof appears to be in poor condition, with visible signs of wear and tear. | Major | $15,000–50,000 |
| exterior siding · The exterior siding is peeling and in need of repainting. | Major | $15,000–50,000 |
| flooring · The flooring in the interior appears to be in poor condition, with visible wear and tear. | Major | $15,000–50,000 |
| interior walls · The interior walls have visible cracks and peeling paint, indicating a need for repair and repainting. | Major | $15,000–50,000 |
| landscaping · The landscaping and fencing are overgrown and in need of maintenance. | Major | $15,000–50,000 |
| Total estimated repair cost · 5 items | $75,000–250,000 |
Value-add ROI direction
- Resale roof replacement — A new roof will significantly improve the home's appearance and increase its value. ↑
- Resale exterior siding repair and repainting — A new exterior siding and repainting will improve the home's curb appeal and increase its value. ↑
- Resale flooring replacement — New flooring will improve the home's appearance and increase its value. ↑
- Resale interior wall repair and repainting — New interior walls and repainting will improve the home's appearance and increase its value. ↑
- Both landscaping and fencing maintenance — Maintaining the landscaping and fencing will improve the home's curb appeal and increase its value. ↑
ⓘ Cost ranges are severity-bucket heuristics (US national rule-of-thumb). Get contractor quotes + a written scope before underwriting a rehab budget.
Schools (NCES district)
- District
- Greenville Central School District
- NCES district ID
- 3612870
- Math proficiency
- 48% ▲ 5.00%
- Reading proficiency
- 55% ▲ 16.00%
- Median HH income
- $58,430
- Composite
- 44.81/100
- National rank
- #2740
- State rank
- #338 of 590 in NY
Livability — Greenville
- Score
- 65/100
- State rank
- #713
- US rank
- #13570
Category grades
Schools grade is shown separately in the Schools card above.
Census & demographics
- City population
- 3,648
- Population (ZIP)
- 1,829
Population outlook (Albany County) Hauer SSP2
- Today (2025)
- 320,794 people
- By 2030
- 327,401 · +2.1%
- By 2040
- 338,218 · +5.4%
- By 2050
- 348,467 · +8.6%
- By 2075
- 381,693 · +19.0%
- By 2100
- 393,809 · +22.8%
Race, ethnicity, and origin ACS 2023
- Neighborhood character
- Predominantly White (96%)
- Race & ethnicity
- White 96% Two or more races 2% Black 1%
- Common ancestry
- Iranian 20% Romanian 5% Lithuanian 2%
- Foreign-born
- 3% · Canada, China
Political lean MEDSL · Albany
- 2024 margin
- Strong D (+25.8) · D 62.9% · R 37.1%
- 2008→2024 swing
- -3.6pp toward R · 2008: 29.4pp · 2024: 25.8pp
- All cycles
- 2024: D+25.8 2020: D+31.4 2016: D+24.3 2012: D+31.0 2008: D+29.4
Not yet ingested
- Civics
- —
Market trends
- HPI YoY
- ▲ 44.94%
- Current HPI
- 311.509
- Rent YoY
- —
- Metro
- —
- State GDP YoY
- ▲ 2.60%
- F500 in state
- 92
Industry mix (Fortune 500 HQ in NY)
| Industry | F500 HQs | Revenue |
|---|---|---|
| Financial Services | 10 | $950B |
|
||
| Consumer Goods | 9 | $162B |
|
||
| Insurance | 4 | $225B |
|
||
| Telecommunications | 2 | $144B |
|
||
| Pharmaceuticals | 2 | $112B |
|
||
| Media / Entertainment | 2 | $69B |
|
||
Price history
2 events — show timeline
- 2026-04-04 Pending — HVCRMLS
- 2026-04-03 Listed $149,000 HVCRMLS
Cash-flow waterfall
monthlySold comps — $/sqft
last 12 mo · ≤1 miLoading sold comps…