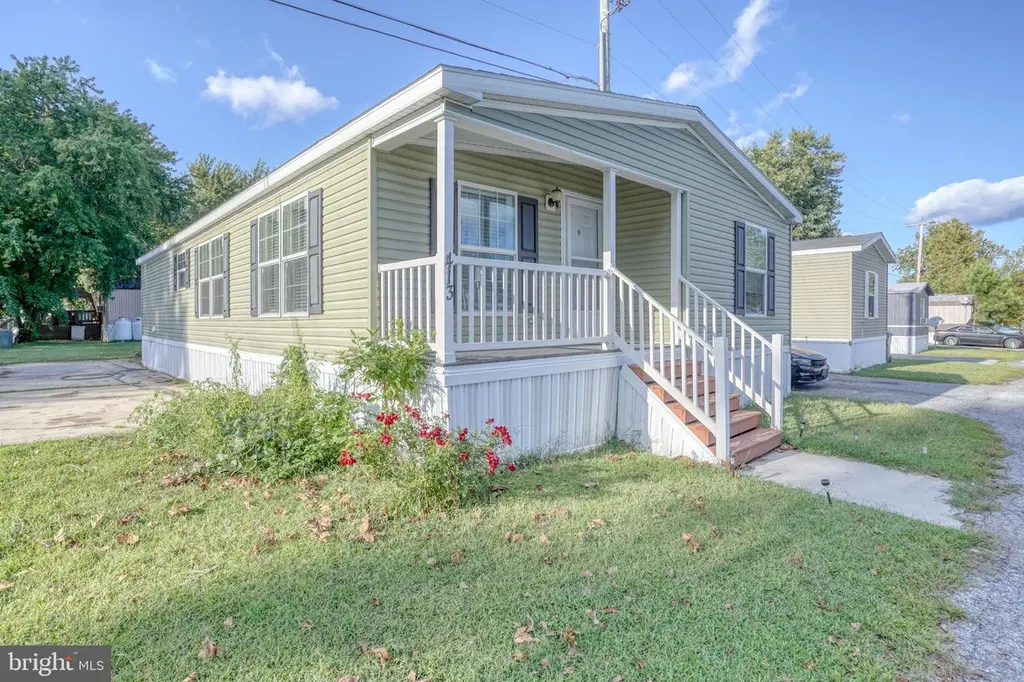
413 Fourth St · Magnolia, DE
Flood risk 5/10 · Moderate
- FEMA flood zone
- X (unshaded)
- Chance of flooding over 30 yrs
- 0.67%
- Est. flood insurance / yr
- $473 – $860
Fire risk 1/10 · Minimal
- Est. fire insurance / yr
- $476 – $884
Heat risk 8/10 · Major
- Hot days now (above 101°F)
- 7 days/yr
- Hot days in 30 yrs
- 16 days/yr
Wind risk 7/10 · Major
- Chance of severe wind over 30 yrs
- 78.0%
Air-quality risk 2/10 · Minimal
- Unhealthy air days now
- 1 days/yr
- Unhealthy air days in 30 yrs
- 2 days/yr
Risk factors via First Street. Map © Google.
Why this score? — see what drove the C+ grade
The composite is a weighted blend of 9 inputs, each scored 0–100. Each bar is that input's sub-score; the figure is the points it added to the 100-point composite (weight × sub-score).
- Cash flow +30.0/30.0
- 1% rule +10.0/10.0
- DSCR +10.0/10.0
- Condition / age +4.0/5.0
- Livability +3.2/5.0
- Schools +3.0/10.0
- Rent growth +2.5/5.0
- ARV discount +0.0/15.0
- Appreciation +0.0/10.0
$139,900
🖨 Deal sheet 📄 Offer letter ✓ Due diligence
Listing remarks MLS
Welcome to 413 Fourth Street in the community of High Point Park. This home features a open floor plan with a modern look and feel. Only five years old, this home needs nothing and is ready to go for the new owners. With a large kitchen with abundant cabinet and counter space, the gourmet in the family will love this space. The dining area has plenty of space for family and friends on those special occasions. With four bedrooms and two full baths, this is one of the largest homes in the community. There is plenty of space for everyone here. Come see it today!
Key facts
- 3 parking spots
- Community pool
- Built 2020
Neighborhood map
What this means for you Summary
Snapshot
- This is a 4-bed/2.0-bath single-family listed at $140k. Condition is rated good.
Deal economics
- At list price, monthly cash flow is $1k ($13k/yr) — positive.
- The deal already cash-flows at list — no discount required.
- Meets the 1% rule at list price ($3k rent vs $140k).
- Recommended offer: $127k (9.0% below list) — sets the bar for market timing.
- Cap rate 15.9% vs local median 2.3% in Magnolia — top-decile yield for the area; either an underpriced asset or a hidden risk that comps aren't pricing in. Stress-test before assuming the spread holds.
Location & tenants
- Location reads 64/100 on livability (#51 in DE) — a middle-class / working-renter tenant base. Strengths: cost of living A+, employment A-, housing B+; Watch: schools F, crime F, amenities F.
- Lake Forest School District (rural): math 26% / reading 44% proficiency, ranked #13 of 26 in DE (top 50%) — families likely to look elsewhere, expect single-tenant / working-renter base with shorter leases.
- Market conditions: 73 active listings in the ZIP; 1 comparable units currently listed for rent nearby; solid renter incomes; 1,201 units permitted in Kent County in 2024 (116 in 5+ unit buildings).
- This rent runs 39% of the median local income ($80k/yr) — at the standard rent-burdened threshold; future hikes will face affordability resistance.
Forward outlook
- Local home prices are declining (-3.0%/yr); year-one equity from $967 of loan paydown is wiped out by about $4k of value loss. Plan a longer hold.
- Kent County population projected at +22% by 2050 — long-run rental-demand tailwind backs the buy-and-hold thesis.
- At projected returns (-3.0% appreciation + 3.0% rent growth), your $39k cash investment doubles in ~4 years — after that, you're playing with house money.
Negotiation context
- It's been on market 91 days — a 9% lower offer ($127k) is reasonable based on typical stale-listing flexibility.
- 2 sale attempts with the ask held roughly flat each time — persistent listings suggest the price (not the market) is what's stuck; bring a comps-based counter.
Risks & watch-outs
- Climate carrying-cost: moderate flood risk; major wind risk, 78% chance of damaging wind over 30y; extreme-heat days projected 7→16/yr by 2055 (HVAC capex compounding) — expect insurance premiums to compound above CPI over the hold.
Questions for the listing agent
- It's been on market 91 days. Have you received any prior offers? Is the seller open to a 9% concession, seller financing, or rate buy-down credit?
- Why hasn't it sold? Are there any deal-killer items the seller is aware of (foundation, flood, title, zoning, code violations)?
- Is there a deadline driving the sale (1031 exchange, divorce, estate, relocation)? That informs how much negotiation room exists.
- Schools are F-rated, which usually means shorter tenancies and higher turnover. Who's the typical renter profile here, and what's been the actual vacancy rate?
- Crime grade is F in this area — have there been break-ins, vandalism, or insurance claims at this property in the last 3 years? What carrier currently insures it and at what premium?
- What's the average days-on-market for RENTAL listings here right now (not sales)? A rising rental-DOM trend means longer vacancies and softer asking-rent achievability than the comps imply.
- What's the recent tenant-quality profile in this submarket — average credit score on applications, eviction rate, late-payment / NSF rate, and stable-employment percentage? A property-management company in the area should have these aggregated.
- How much new for-sale + rental construction is in the pipeline within 1–3 miles? Heavy new supply typically softens prices + rents 12–24 months out; constrained supply supports both.
Investment metrics
- 1% rule
- 1.89% ✓
- Cap rate
- 15.89%
- Cash-on-cash
- 34.27%
- DSCR
- 2.52
- GRM
- 4.4
CMA / ARV
- ARV (median comp)
- $111,669
- List price
- $139,900
- Delta
- 25.28%
- Verdict
- OVERPRICED
- Comps
- 20 within 1.0 mi
Show comp detail 12 sales within ~0.75 mi
| Address | Dist | Beds/Ba | Sqft | Sold | Price | $/sf | Match |
|---|---|---|---|---|---|---|---|
| 103 Barefoot Ln | 0.45mi | 3/2.0 (-1) | 1,574 (+0%) | 1mo | $260,000 | $165 | 73 |
| 395 Barefoot Ln | 0.35mi | 3/2.0 (-1) | 1,512 (-4%) | 1mo | $259,000 | $171 | 72 |
| 307 Jean Bradley Cir #314 | 0.11mi | 3/2.0 (-1) | 1,364 (-13%) | 4mo | $137,500 | $101 | 64 |
| 357 Barefoot Ln | 0.34mi | 3/2.0 (-1) | 1,752 (+12%) | 1mo | $257,000 | $147 | 59 |
| 105 Jury Dr #5 | 0.24mi | 3/2.0 (-1) | 1,792 (+14%) | 3mo | $125,000 | $70 | 58 |
| 74 Wanchese Dr | 0.65mi | 3/2.0 (-1) | 1,627 (+4%) | 2mo | $409,990 | $252 | 57 |
| 155 E Poplar St | 0.49mi | 3/2.0 (-1) | 1,700 (+8%) | 2mo | $275,000 | $162 | 57 |
| 117 Wanchese Dr | 0.62mi | 3/3.0 (-1) | 1,627 (+4%) | 1mo | $399,990 | $246 | 55 |
| 30 Wanchese Dr | 0.65mi | 3/2.0 (-1) | 1,627 (+4%) | 8mo | $429,900 | $264 | 52 |
| 30 Manteo Dr | 0.66mi | 3/2.0 (-1) | 1,778 (+13%) | 8mo | $439,900 | $247 | 36 |
| 273 Buxton Cir | 0.71mi | 3/2.0 (-1) | 1,778 (+13%) | 9mo | $444,900 | $250 | 32 |
| 245 Buxton Cir | 0.74mi | 3/2.0 (-1) | 1,778 (+13%) | 10mo | $489,900 | $276 | 30 |
Match score weights: distance 35% · size 25% · config 20% · recency 20%. Top-matched comps best support the ARV.
Projected returns pro-forma
-3.0% appreciation · 3.0% rent growth · sell at horizon
- IRR
- 29.7%
- Equity multiple
- 2.24×
- Total profit
- $48,621
- Equity at exit
- $20,860
- IRR
- 37.0%
- Equity multiple
- 4.43×
- Total profit
- $134,248
- Equity at exit
- $12,096
Cash invested: $39,172 (down + closing). Projections, not guarantees.
Landlord ↔ Tenant lean methodology
- Overall (STATE)
- 70 Landlord-Friendly
- State Delaware
- 70 Landlord-Friendly · D+7
- County
- — inherits STATE
- City
- — inherits STATE
ZIP-level market 19946
- Home prices YoY
- -16.1%
- Active inventory
- 73
- Price-to-rent
- 4.4×
Monthly cashflow live
- Estimated rent
- $2,640 medium interval (Pro) →
- Mortgage (P&I)
- −$734
- Tax est. 1.5%
- −$175 /mo · $2,098/yr
- Insurance
- −$58
- HOA
- −$0
- Vacancy / Maint / Mgmt
- −$554
- Net cashflow
- $1,119
Break-even live
UW: 25.0% down · 7.5% · 30yr · 1.5% tax · 5.0% vac · 8.0% maint · 8.0% mgmt
Financing live
Cash to close
- Down payment
- $34,975
- Closing costs
- $4,197
- Reserves months
- —
- Total cash needed
- —
Loan-product check · same deal, 3 products live
Conventional
25% down · 7.5% · 30yr
- Down + closing
- —
- Monthly P&I
- —
- Monthly cashflow
- —
- DSCR
- —
- Eligible?
- —
Personal DTI + credit; lowest rate.
DSCR
20% down · 8.5% · 30yr
- Down + closing
- —
- Monthly P&I
- —
- Monthly cashflow
- —
- DSCR
- —
- Eligible?
- —
No personal income docs; deal must DSCR.
Hard money
10% down · 12.0% · 12mo
- Down + closing
- —
- Monthly P&I
- —
- Monthly cashflow
- —
- DSCR
- —
- Eligible?
- —
Short-term bridge; refi at stabilization.
Rent comps 1 comps
| Address | Beds | Baths | Sqft | Rent | $/sqft | DOM | Units | Dist |
|---|---|---|---|---|---|---|---|---|
| 2 Willow Dr Frederica, DE | 3.0–4.0 | 2.0 | 1312 | $1,849 | $1.41 | 43d | 1 | 0.05mi |
Listing history 21 events
-
2026-06-19days on market $139,900 Active 91 DOM
-
2026-06-18days on market $139,900 Active 90 DOM
-
2026-06-17days on market $139,900 Active 89 DOM
-
2026-06-16days on market $139,900 Active 88 DOM
-
2026-06-15days on market $139,900 Active 87 DOM
-
2026-06-14days on market $139,900 Active 85 DOM
-
2026-06-13days on market $139,900 Active 84 DOM
-
2026-06-10days on market $139,900 Active 82 DOM
-
2026-06-09days on market $139,900 Active 81 DOM
-
2026-06-08days on market $139,900 Active 80 DOM
-
2026-06-07days on market $139,900 Active 79 DOM
-
2026-06-05days on market $139,900 Active 76 DOM
-
2026-06-03days on market $139,900 Active 75 DOM
-
2026-06-02days on market $139,900 Active 74 DOM
-
2026-06-01days on market $139,900 Active 73 DOM
-
2026-05-31days on market $139,900 Active 72 DOM
-
2026-05-30days on market $139,900 Active 71 DOM
-
2026-03-20$139,900 Active 565-char remark
Show marketing remark (565 chars)
Welcome to 413 Fourth Street in the community of High Point Park. This home features a open floor plan with a modern look and feel. Only five years old, this home needs nothing and is ready to go for the new owners. With a large kitchen with abundant cabinet and counter space, the gourmet in the family will love this space. The dining area has plenty of space for family and friends on those special occasions. With four bedrooms and two full baths, this is one of the largest homes in the community. There is plenty of space for everyone here. Come see it today!
-
2025-12-15historical
-
2025-11-18price $139,900
-
2025-09-29$159,900 Active
ⓘ Source: listings_history table (triggers on properties + properties_extension) + one-shot
backfill from property_details.listing_events for pre-trigger history.
Climate risk First Street
- Flood 5/10 Major FEMA zone X (unshaded) · 67% chance over 30 yrs
- Wildfire 1/10 Low
- Heat 8/10 Severe 7 d/yr ≥101°F today · 16 d/yr by 30 yrs out
- Wind 7/10 Severe 78% chance of damaging wind over 30 yrs
- Air quality 2/10 Low 1 unhealthy d/yr today · 2 by 30 yrs out
Nearby sold comps map
Loading sold comps map…
Walkable amenities ~0.75 mi
Loading nearby amenities…
Taxation est. · year 1
- Rental income
- $31,679
- − Mortgage interest
- −$7,837
- − Property taxes
- −$2,098
- − Insurance
- −$700
- − Repairs & maintenance
- −$2,534
- − Management
- −$2,534
- − Depreciation
- −$4,070
- Taxable income
- $11,906
- Est. tax owed @ 24.0%
- −$2,857
- After-tax cash flow
- $10,567/yr
For passive investors: Depreciation is non-cash, so a rental often shows a tax loss while cash-flowing — sheltering income. Rental losses are passive: they offset passive income freely, and up to $25,000/yr can offset ordinary (W-2) income if you actively participate and your MAGI is under $100k (phasing out to $0 by $150k); unused losses carry forward. On sale, claimed depreciation is recaptured at up to 25%, and gains may owe capital-gains tax (a 1031 exchange can defer both). Figures are a year-1 estimate at your 24.0% rate — not tax advice; consult a CPA.
Condition & rehab AI · 12 photos
This home is in good condition with a modern kitchen and ample space. It is move-in ready and would benefit from some exterior and interior updates to enhance its curb appeal and add value.
Value-add opportunities
- Both landscaping — enhances curb appeal and adds value
- Both paint exterior — improves curb appeal and adds value
- Both paint interior walls — enhances interior appearance and adds value
Renovation cost estimate screening
Value-add ROI direction
- Both landscaping — enhances curb appeal and adds value ↑
- Both paint exterior — improves curb appeal and adds value ↑
- Both paint interior walls — enhances interior appearance and adds value ↑
ⓘ Cost ranges are severity-bucket heuristics (US national rule-of-thumb). Get contractor quotes + a written scope before underwriting a rehab budget.
Schools (NCES district)
- District
- Lake Forest School District
- NCES district ID
- 1000790
- Math proficiency
- 26% ▼ -23.00%
- Reading proficiency
- 44% ▼ -14.00%
- Median HH income
- $52,034
- Composite
- 30.47/100
- National rank
- #6225
- State rank
- #13 of 26 in DE
Livability — Magnolia
- Score
- 64/100
- State rank
- #51
- US rank
- #13984
Category grades
Schools grade is shown separately in the Schools card above.
Census & demographics
- County
- Kent County · 82,184 people
- Metro
- Dover, DE
- Population (ZIP)
- 5,603
- Household income
- $80,459
- Rent vs Own
- Severe rent burden
- 128.0
Population outlook (Kent County) Hauer SSP2
- Today (2025)
- 194,477 people
- By 2030
- 204,351 · +5.1%
- By 2040
- 222,135 · +14.2%
- By 2050
- 236,483 · +21.6%
- By 2075
- 266,327 · +36.9%
- By 2100
- 275,335 · +41.6%
Race, ethnicity, and origin ACS 2023
- Neighborhood character
- Diverse neighborhood (Simpson 0.55)
- Race & ethnicity
- White 64% Black 19% Two or more races 10% Hispanic / Latino 5%
- Common ancestry
- Romanian 2% Italian 1% Iranian 1%
- Foreign-born
- 3% · Canada
- Languages at home
- 97% English-only · Spanish 3%
Political lean MEDSL · Kent
- 2024 margin
- Toss-up / Even · D 50.2% · R 48.2% · Other 1.7%
- 2008→2024 swing
- -7.8pp toward R · 2008: 9.8pp · 2024: 2.0pp
- All cycles
- 2024: D+2.0 2020: D+4.1 2016: R+4.9 2012: D+4.9 2008: D+9.8
Not yet ingested
- Civics
- —
Market trends
- HPI YoY
- ▼ -36.16%
- Current HPI
- 189.0713
- Rent YoY
- —
- Metro
- Dover, DE
- State GDP YoY
- —
- F500 in state
- 0
Price history
-12.5% since first listed4 events — show timeline
- 2026-03-20 Listed $139,900 BRIGHT MLS
- 2025-12-15 Listing Removed — BRIGHT MLS
- 2025-11-18 Price Changed $139,900 BRIGHT MLS
- 2025-09-29 Listed $159,900 BRIGHT MLS
Cash-flow waterfall
monthlySold comps — $/sqft
last 12 mo · ≤1 miLoading sold comps…