 5-Plex
437 N Courtland St · East Stroudsburg, PA
Flood risk 1/10 · Minimal
- FEMA flood zone
- X (unshaded)
- Chance of flooding over 30 yrs
- 0.0%
- Est. flood insurance / yr
- $507 – $1,088
Fire risk 1/10 · Minimal
- Est. fire insurance / yr
- $511 – $949
Heat risk 4/10 · Minor
- Hot days now (above 99°F)
- 7 days/yr
- Hot days in 30 yrs
- 16 days/yr
Wind risk 4/10 · Minor
- Chance of severe wind over 30 yrs
- 11.0%
Air-quality risk 2/10 · Minimal
- Unhealthy air days now
- 1 days/yr
- Unhealthy air days in 30 yrs
- 2 days/yr
Risk factors via First Street. Map © Google.
Why this score? — see what drove the C+ grade
The composite is a weighted blend of 9 inputs, each scored 0–100. Each bar is that input's sub-score; the figure is the points it added to the 100-point composite (weight × sub-score).
- Cash flow +24.9/30.0
- DSCR +8.1/10.0
- ARV discount +7.5/15.0
- 1% rule +6.5/10.0
- Rent growth +5.0/5.0
- Livability +4.2/5.0
- Schools +3.0/10.0
- Condition / age +2.2/5.0
- Appreciation +0.0/10.0
$800,000
🖨 Deal sheet (PDF) 📄 Offer letter ✓ Due diligence
Multi-family units
County records classify this as Multi-Family (5+ Unit). Listing-text estimate: 5 units. confirmed
5+ unit building — per-unit beds/baths from public records are typically unavailable; the breakdown below (if shown) is an estimate from the listing text.
Listing remarks MLS
5 Unit multi-family opportunity in a prime location. Fully occupied, income producing investment, don't miss out. 1- 3Bed, 2 - 2Bed, & 2 - 1Bed units. All within close proximity of major highways, Public transportation, local schools, grocery stores and city amenities.
Key facts
- Grocery stores
- City amenities
- Local schools
Tags
Neighborhood map
What this means for you Summary
Snapshot
- This is a 1×3bd/1ba + 2×2bd/1ba + 2×1bd/1ba units multifamily listed at $800k. Condition is rated fair.
Deal economics
- At list price, monthly cash flow is $2k ($21k/yr) — positive. Per door: $346/mo.
- The deal already cash-flows at list — no discount required.
- Meets the 1% rule at list price ($9k rent vs $800k).
- Recommended offer: $776k (3.0% below list) — sets the bar for market timing.
- Cap rate 8.9% vs local median 3.6% in East Stroudsburg — top-decile yield for the area; either an underpriced asset or a hidden risk that comps aren't pricing in. Stress-test before assuming the spread holds.
Location & tenants
- Location reads 84/100 on livability (#108 in PA, #833 nationally) — a professional / high-income tenant draw. Strengths: commute A+, cost of living A+, housing A+.
- East Stroudsburg Area SD (rural): math 25% / reading 43% proficiency, ranked #413 of 539 in PA (top 77%) — families likely to look elsewhere, expect single-tenant / working-renter base with shorter leases.
- Market conditions: Rents rising fast (+10.4%/yr); 199 active listings in the ZIP; solid renter incomes; 278 units permitted in Monroe County in 2024 (52 in 5+ unit buildings).
- At $9,187/mo this rent would consume 122% of the median local household income ($91k/yr) (locally 672% of renters already pay >50% of income on rent) — very limited rent-growth headroom before tenants either downsize or default.
Forward outlook
- Local home prices are declining (-3.0%/yr); year-one equity from $6k of loan paydown is wiped out by about $24k of value loss. Plan a longer hold.
- Monroe County population projected at -11% by 2050 — secular population decline; favor cash flow + early exit over multi-decade hold.
- At projected returns (-3.0% appreciation + 8.0% rent growth), your $224k cash investment doubles in ~8 years — after that, you're playing with house money.
Negotiation context
- It's been on market 41 days — a 3% lower offer ($776k) is reasonable based on typical stale-listing flexibility.
Risks & watch-outs
- Watch-outs: built in 1902 — expect roof / HVAC / electrical / plumbing capex.
Questions for the listing agent
- It's been on market 41 days. Have you received any prior offers? Is the seller open to a 3% concession, seller financing, or rate buy-down credit?
- Can we see the unit-by-unit rent roll, current vacancy, and any below-market leases? What's the average tenancy length?
- What capital expenditures (roof, boiler, parking lot, exteriors) have been made in the last 5 years, and what's planned in the next 2?
- Have any recent inspections been done? Can we get a copy of the seller's disclosures and any deferred-maintenance estimates?
- Built in 1902 — when were the roof, HVAC, electrical panel, plumbing, and water heater last replaced?
- Is there a deadline driving the sale (1031 exchange, divorce, estate, relocation)? That informs how much negotiation room exists.
- Schools are B-rated — typically a magnet for longer-tenancy family renters. What's the average tenant stay here, and is there a school-zone premium baked into asking?
- What's the average days-on-market for RENTAL listings here right now (not sales)? A rising rental-DOM trend means longer vacancies and softer asking-rent achievability than the comps imply.
- What's the recent tenant-quality profile in this submarket — average credit score on applications, eviction rate, late-payment / NSF rate, and stable-employment percentage? A property-management company in the area should have these aggregated.
- How much new apartment / multifamily construction is in the pipeline within 1–3 miles? Heavy new supply (>2% of stock underway) typically softens rents 12–24 months out; light construction supports rent growth.
Investment metrics
- 1% rule
- 1.15% ✓
- Cap rate
- 8.89%
- Cash-on-cash
- 9.26%
- DSCR
- 1.41
- GRM
- 7.3
CMA / ARV
- ARV (median comp)
- $476,024
- List price
- $800,000
- Delta
- 68.06%
- Verdict
- OVERPRICED
- Comps
- 3 within 1.0 mi
Projected returns pro-forma
-3.0% appreciation · 8.0% rent growth · sell at horizon
- IRR
- 3.2%
- Equity multiple
- 1.13×
- Total profit
- $29,183
- Equity at exit
- $119,283
- IRR
- 17.1%
- Equity multiple
- 2.74×
- Total profit
- $388,759
- Equity at exit
- $69,169
Cash invested: $224,000 (down + closing). Projections, not guarantees.
Landlord ↔ Tenant lean methodology
- Overall (STATE)
- 62 Landlord-Friendly
- State Pennsylvania
- 62 Landlord-Friendly · EVEN
- County
- — inherits STATE
- City
- — inherits STATE
ZIP-level market 18301
- Rents YoY
- 10.4%
- Active inventory
- 199
- Price-to-rent
- 32.1×
Monthly cashflow live
- Estimated rent
- $9,187 high interval (Pro) →
- Mortgage (P&I)
- −$4,195
- Tax est. 1.5%
- −$1,000 /mo · $12,000/yr
- Insurance
- −$333
- HOA
- −$0
- Vacancy / Maint / Mgmt
- −$1,929
- Net cashflow
- $1,729
Break-even live
Sensitivity live
| Price | -10% $2,282 | -5% $2,006 | +0% $1,729 | +5% $1,453 | +10% $1,176 |
|---|---|---|---|---|---|
| Rent | -10% $1,003 | -5% $1,366 | +0% $1,729 | +5% $2,092 | +10% $2,455 |
| Rate | -1.0pp $2,132 | -0.5pp $1,933 | base $1,729 | +0.5pp $1,522 | +1.0pp $1,311 |
5-unit breakdown (identical units grouped — click to expand)
| Units | Beds | Baths | Est. rent |
|---|---|---|---|
| 1× unit | 3 | 1 | $2,076 |
| 2× units | 2 | 1 | $3,790 |
| #2 | 2 | 1 | $1,895 |
| #3 | 2 | 1 | $1,895 |
| 2× units | 1 | 1 | $3,320 |
| #4 | 1 | 1 | $1,660 |
| #5 | 1 | 1 | $1,660 |
| Total (5 units) | $9,187 | ||
UW: 25.0% down · 7.5% · 30yr · 1.5% tax · 5.0% vac · 8.0% maint · 8.0% mgmt
Financing live
Cash to close
- Down payment
- $200,000
- Closing costs
- $24,000
- Reserves months
- —
- Total cash needed
- —
Loan-product check · same deal, 3 products live
Conventional
25% down · 7.5% · 30yr
- Down + closing
- —
- Monthly P&I
- —
- Monthly cashflow
- —
- DSCR
- —
- Eligible?
- —
Personal DTI + credit; lowest rate.
DSCR
20% down · 8.5% · 30yr
- Down + closing
- —
- Monthly P&I
- —
- Monthly cashflow
- —
- DSCR
- —
- Eligible?
- —
No personal income docs; deal must DSCR.
Hard money
10% down · 12.0% · 12mo
- Down + closing
- —
- Monthly P&I
- —
- Monthly cashflow
- —
- DSCR
- —
- Eligible?
- —
Short-term bridge; refi at stabilization.
Listing history 18 events
-
2026-06-21days on market $800,000 Active 41 DOM
-
2026-06-19days on market $800,000 Active 39 DOM
-
2026-06-18days on market $800,000 Active 38 DOM
-
2026-06-17days on market $800,000 Active 37 DOM
-
2026-06-16days on market $800,000 Active 36 DOM
-
2026-06-15days on market $800,000 Active 35 DOM
-
2026-06-14days on market $800,000 Active 33 DOM
-
2026-06-13days on market $800,000 Active 32 DOM
-
2026-06-10days on market $800,000 Active 30 DOM
-
2026-06-09days on market $800,000 Active 29 DOM
-
2026-06-08days on market $800,000 Active 28 DOM
-
2026-06-07days on market $800,000 Active 27 DOM
-
2026-06-05days on market $800,000 Active 24 DOM
-
2026-06-02days on market $800,000 Active 22 DOM
-
2026-06-01days on market $800,000 Active 21 DOM
-
2026-05-31days on market $800,000 Active 20 DOM
-
2026-05-30days on market $800,000 Active 19 DOM
-
2026-05-01$800,000 Active 274-char remark
Show marketing remark (274 chars)
5 Unit multi-family opportunity in a prime location. Fully occupied, income producing investment, don't miss out. 1- 3Bed, 2 - 2Bed, & 2 - 1Bed units. All within close proximity of major highways, Public transportation, local schools, grocery stores and city amenities.
ⓘ Source: listings_history table (triggers on properties + properties_extension) + one-shot
backfill from property_details.listing_events for pre-trigger history.
Climate risk First Street
- Flood 1/10 Low FEMA zone X (unshaded) · 0% chance over 30 yrs
- Wildfire 1/10 Low
- Heat 4/10 Moderate 7 d/yr ≥99°F today · 16 d/yr by 30 yrs out
- Wind 4/10 Moderate 11% chance of damaging wind over 30 yrs
- Air quality 2/10 Low 1 unhealthy d/yr today · 2 by 30 yrs out
Nearby sold comps map
Loading sold comps map…
Walkable amenities ~0.75 mi
Loading nearby amenities…
Taxation est. · year 1
- Rental income
- $110,244
- − Mortgage interest
- −$44,812
- − Property taxes
- −$12,000
- − Insurance
- −$4,000
- − Repairs & maintenance
- −$8,820
- − Management
- −$8,820
- − Depreciation
- −$23,273
- Taxable income
- $8,520
- Est. tax owed @ 24.0%
- −$2,045
- After-tax cash flow
- $18,705/yr
For passive investors: Depreciation is non-cash, so a rental often shows a tax loss while cash-flowing — sheltering income. Rental losses are passive: they offset passive income freely, and up to $25,000/yr can offset ordinary (W-2) income if you actively participate and your MAGI is under $100k (phasing out to $0 by $150k); unused losses carry forward. On sale, claimed depreciation is recaptured at up to 25%, and gains may owe capital-gains tax (a 1031 exchange can defer both). Figures are a year-1 estimate at your 24.0% rate — not tax advice; consult a CPA.
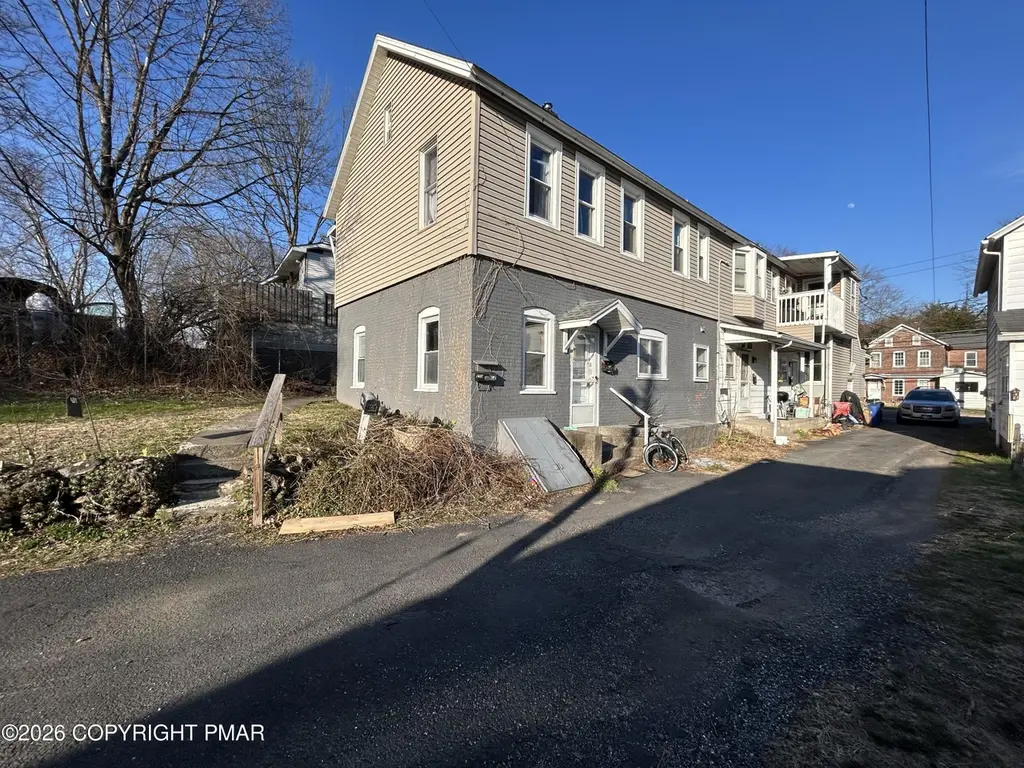
Condition & rehab AI · 3 photos
This multi-family property requires significant exterior and interior repairs, including siding, roof, HVAC, and landscaping. Immediate action is needed to improve its condition and increase its resale and rental value.
Repairs flagged
- Major exterior siding — Significant wear and discoloration.
- Major roof — Visible damage and lack of uniform appearance.
- Major HVAC units — Old and may need replacement.
- Major landscaping — Sparse and overgrown vegetation, low curb appeal.
Value-add opportunities
- Both exterior siding replacement — Improves curb appeal and property value.
- Both roof repair/replacement — Enhances property value and reduces maintenance costs.
- Both HVAC unit replacement — Improves comfort and energy efficiency, attracting tenants.
- Both landscaping and curb appeal — Enhances property value and attracts tenants by improving curb appeal.
Renovation cost estimate screening
| Repair item | Severity | Est. cost |
|---|---|---|
| exterior siding · Significant wear and discoloration. | Major | $15,000–50,000 |
| roof · Visible damage and lack of uniform appearance. | Major | $15,000–50,000 |
| HVAC units · Old and may need replacement. | Major | $15,000–50,000 |
| landscaping · Sparse and overgrown vegetation, low curb appeal. | Major | $15,000–50,000 |
| Total estimated repair cost · 4 items | $60,000–200,000 |
Value-add ROI direction
- Both exterior siding replacement — Improves curb appeal and property value. ↑
- Both roof repair/replacement — Enhances property value and reduces maintenance costs. ↑
- Both HVAC unit replacement — Improves comfort and energy efficiency, attracting tenants. ↑
- Both landscaping and curb appeal — Enhances property value and attracts tenants by improving curb appeal. ↑
ⓘ Cost ranges are severity-bucket heuristics (US national rule-of-thumb). Get contractor quotes + a written scope before underwriting a rehab budget.
Schools (NCES district)
- District
- East Stroudsburg Area SD
- NCES district ID
- 4208670
- Math proficiency
- 25% ▼ -11.00%
- Reading proficiency
- 43% ▼ -18.00%
- Median HH income
- $57,142
- Composite
- 30.13/100
- National rank
- #6332
- State rank
- #413 of 539 in PA
Livability — East Stroudsburg
- Score
- 84/100
- State rank
- #108
- US rank
- #833
Category grades
Schools grade is shown separately in the Schools card above.
Census & demographics
- Census place
- East Stroudsburg, PA
- County
- Monroe County · 59,057 people
- City population
- 28,977
- Metro
- East Stroudsburg, PA
- Population (ZIP)
- 28,977
- Household income
- $90,522
- Rent vs Own
- Severe rent burden
- 672.0
Population outlook (Monroe County) Hauer SSP2
- Today (2025)
- 164,099 people
- By 2030
- 161,412 · -1.6%
- By 2040
- 154,616 · -5.8%
- By 2050
- 146,710 · -10.6%
- By 2075
- 140,830 · -14.2%
- By 2100
- 138,472 · -15.6%
Race, ethnicity, and origin ACS 2023
- Neighborhood character
- Diverse neighborhood (Simpson 0.64)
- Race & ethnicity
- White 53% Black 21% Hispanic / Latino 18% Two or more races 10% Asian 2%
- Hispanic origin (detail)
- Puerto Rican 8% Dominican 3%
- Common ancestry
- Romanian 6% Lithuanian 3% Portuguese 1%
- Foreign-born
- 12% · Canada, China, Jamaica
- Languages at home
- 82% English-only · Spanish 9% Russian/Polish/Slavic 2% Other Indo-European 2%
Political lean MEDSL · Monroe
- 2024 margin
- Toss-up / Even · D 49.1% · R 49.9%
- 2008→2024 swing
- -17.1pp toward R · 2008: 16.3pp · 2024: -0.8pp
- All cycles
- 2024: R+0.8 2020: D+6.4 2016: D+0.3 2012: D+14.0 2008: D+16.3
Not yet ingested
- Civics
- —
Market trends
- HPI YoY
- ▼ -109.90%
- Current HPI
- 154.4762
- Rent YoY
- ▲ 10.44%
- Metro
- East Stroudsburg, PA
- State GDP YoY
- ▲ 1.68%
- F500 in state
- 34
Industry mix (Fortune 500 HQ in PA)
| Industry | F500 HQs | Revenue |
|---|---|---|
| Healthcare | 2 | $309B |
|
||
| Insurance | 2 | $27B |
|
||
| Telecommunications / Media | 1 | $124B |
|
||
| Industrial Distribution | 1 | $22B |
|
||
| Financial Services | 1 | $20B |
|
||
| Chemicals / Materials | 1 | $18B |
|
||
Price history
1 event — show timeline
- 2026-05-01 Listed $800,000 PMAR
Cash-flow waterfall
monthlySold comps — $/sqft
last 12 mo · ≤1 miLoading sold comps…