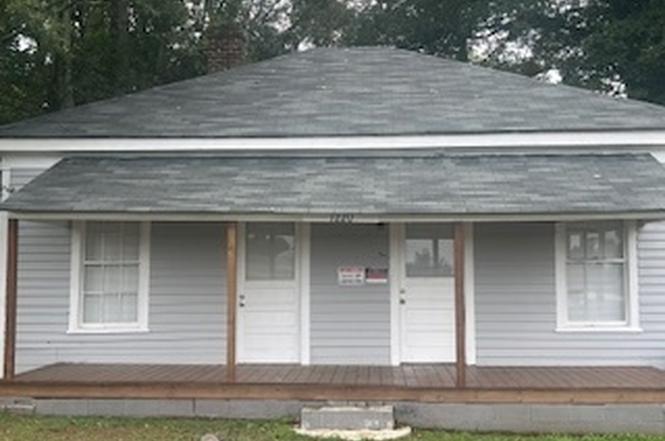
1220 Ellis Rd · Griffin, GA
Flood risk 1/10 · Minimal
- FEMA flood zone
- X (unshaded)
- Chance of flooding over 30 yrs
- 0.0%
- Est. flood insurance / yr
- $507 – $1,088
Fire risk 3/10 · Minor
- Est. fire insurance / yr
- $963 – $1,789
Heat risk 6/10 · Moderate
- Hot days now (above 104°F)
- 7 days/yr
- Hot days in 30 yrs
- 18 days/yr
Wind risk 6/10 · Moderate
- Chance of severe wind over 30 yrs
- 38.0%
Air-quality risk 4/10 · Minor
- Unhealthy air days now
- 4 days/yr
- Unhealthy air days in 30 yrs
- 5 days/yr
Risk factors via First Street. Map © Google.
Why this score? — see what drove the C- grade
The composite is a weighted blend of 9 inputs, each scored 0–100. Each bar is that input's sub-score; the figure is the points it added to the 100-point composite (weight × sub-score).
- Cash flow +22.5/30.0
- ARV discount +7.7/15.0
- DSCR +7.2/10.0
- 1% rule +4.6/10.0
- Rent growth +3.3/5.0
- Livability +2.7/5.0
- Condition / age +2.5/5.0
- Schools +1.4/10.0
- Appreciation +0.0/10.0
$115,000
🖨 Deal sheet 📄 Offer letter ✓ Due diligence
Listing remarks
2Bedroom/1Bath, New Carpet and Fresh Paint, Cash or Conventional Loan, Come Out To See This One. No Disclosure Seller Never Lived In Property, SOLD AS-IS, AGENT IS RELATED TO SELLER.
Key facts
- 8,712 sq ft lot
- Built 1930
- Listed 72 days
Neighborhood map
What this means for you Summary
Snapshot
- This is a 2-bed/1.0-bath single-family listed at $115k.
Deal economics
- At list price, monthly cash flow is $194 ($2k/yr) — positive.
- The deal already cash-flows at list — no discount required.
- To meet the 1% rule (rent ≥ 1% of price), the offer needs to be $111k (3.6% below list).
- Recommended offer: $108k (6.0% below list) — sets the bar for market timing.
- Cap rate 8.3% vs local median 4.3% in Griffin — top-decile yield for the area; either an underpriced asset or a hidden risk that comps aren't pricing in. Stress-test before assuming the spread holds.
Location & tenants
- Location reads 54/100 on livability (#529 in GA) — a working-class tenant base; expect higher turnover. Strengths: cost of living A+, housing A+; Watch: crime F, amenities F, commute F.
- Griffin-Spalding County (suburban): math 13% / reading 19% proficiency, ranked #151 of 174 in GA (top 87%) — low school quality limits family demand, transient renter base, plan for 1-2y turnover; 68% free/reduced lunch — lower-income household profile, screen leases tightly.
- Zoned schools: Orrs Elementary School (math 17% / reading 17%, grade F, #936 of 1,228 statewide, top 79%, 534 students, 98% FRL); Carver Road Middle School (math 16% / reading 25%, grade F, #345 of 470 statewide, top 74%, 471 students, 98% FRL); Griffin High School (math 7% / reading 19%, grade F, #331 of 424 statewide, top 78%, 1,498 students, 98% FRL) — zoned schools average 98% FRL vs 68% district-wide (30 pts higher); higher-poverty schools than district average — tighter screening recommended.
- Market conditions: Rents rising (+3.3%/yr); 427 active listings in the ZIP; 40 comparable units currently listed for rent nearby; rentals at typical pace (median 25d on market — plan ~3-4 weeks tenant-placement turnaround); 342 units permitted in Spalding County in 2024 (0 in 5+ unit buildings).
Forward outlook
- Local home prices are declining (-3.0%/yr); year-one equity from $795 of loan paydown is wiped out by about $3k of value loss. Plan a longer hold.
- Spalding County population projected at -15% by 2050 — secular population decline; favor cash flow + early exit over multi-decade hold.
Negotiation context
- It's been on market 72 days — a 6% lower offer ($108k) is reasonable based on typical stale-listing flexibility.
Risks & watch-outs
- Watch-outs: built in 1930 — expect roof / HVAC / electrical / plumbing capex.
- Climate carrying-cost: major wind risk, 38% chance of damaging wind over 30y; extreme-heat days projected 7→18/yr by 2055 (HVAC capex compounding) — expect insurance premiums to compound above CPI over the hold.
Questions for the listing agent
- It's been on market 72 days. Have you received any prior offers? Is the seller open to a 6% concession, seller financing, or rate buy-down credit?
- Built in 1930 — when were the roof, HVAC, electrical panel, plumbing, and water heater last replaced?
- Why hasn't it sold? Are there any deal-killer items the seller is aware of (foundation, flood, title, zoning, code violations)?
- Is there a deadline driving the sale (1031 exchange, divorce, estate, relocation)? That informs how much negotiation room exists.
- Schools are F-rated, which usually means shorter tenancies and higher turnover. Who's the typical renter profile here, and what's been the actual vacancy rate?
- Crime grade is F in this area — have there been break-ins, vandalism, or insurance claims at this property in the last 3 years? What carrier currently insures it and at what premium?
- What's the average days-on-market for RENTAL listings here right now (not sales)? A rising rental-DOM trend means longer vacancies and softer asking-rent achievability than the comps imply.
- What's the recent tenant-quality profile in this submarket — average credit score on applications, eviction rate, late-payment / NSF rate, and stable-employment percentage? A property-management company in the area should have these aggregated.
- How much new for-sale + rental construction is in the pipeline within 1–3 miles? Heavy new supply typically softens prices + rents 12–24 months out; constrained supply supports both.
Investment metrics
- 1% rule
- 0.96% ✗
- Cap rate
- 8.32%
- Cash-on-cash
- 7.22%
- DSCR
- 1.32
- GRM
- 8.6
CMA / ARV
- ARV (on-the-fly)
- $115,584
- Comps found
- 12
Show comp detail 12 sales within ~0.75 mi
| Address | Dist | Beds/Ba | Sqft | Sold | Price | $/sf | Match |
|---|---|---|---|---|---|---|---|
| 1220 Ellis Rd | 0.00mi | 2/1.0 | 896 (0%) | 1mo | $100,000 | $112 | 99 |
| 1223 Herndon St | 0.03mi | 2/1.0 | 840 (-6%) | 4mo | $149,900 | $178 | 85 |
| 1117 Lake Ave | 0.28mi | 2/1.0 | 891 (-1%) | 9mo | $165,000 | $185 | 78 |
| 635 Garrett St | 0.24mi | 2/1.0 | 864 (-4%) | 20mo | $95,500 | $111 | 66 |
| 602 Melrose Ave | 0.31mi | 3/1.0 (+1) | 950 (+6%) | 6mo | $70,000 | $74 | 66 |
| 626 Garrett St | 0.23mi | 2/1.0 | 930 (+4%) | 22mo | $154,000 | $166 | 64 |
| 1213 Drewry Ave | 0.08mi | 3/1.5 (+1) | 962 (+7%) | 17mo | $139,000 | $144 | 63 |
| 1110 Lyndon Ave | 0.22mi | 2/1.0 | 1,008 (+12%) | 13mo | $130,000 | $129 | 58 |
| 22 Chestnut St | 0.37mi | 2/1.0 | 988 (+10%) | 14mo | $70,000 | $71 | 54 |
| 41 Bleachery St | 0.75mi | 2/1.0 | 900 (+0%) | 16mo | $134,900 | $150 | 51 |
| 135 Peachtree St | 0.47mi | 2/1.0 | 1,025 (+14%) | 9mo | $125,000 | $122 | 47 |
| 348 N 17th St | 0.48mi | 3/2.0 (+1) | 1,013 (+13%) | 23mo | $125,000 | $123 | 28 |
Match score weights: distance 35% · size 25% · config 20% · recency 20%. Top-matched comps best support the ARV.
Projected returns pro-forma
-3.0% appreciation · 3.34% rent growth · sell at horizon
- IRR
- -5.0%
- Equity multiple
- 0.81×
- Total profit
- $-5,964
- Equity at exit
- $17,147
- IRR
- 5.0%
- Equity multiple
- 1.37×
- Total profit
- $12,057
- Equity at exit
- $9,943
Cash invested: $32,200 (down + closing). Projections, not guarantees.
Landlord ↔ Tenant lean methodology
- Overall (STATE)
- 90 Strongly Landlord-Friendly
- State Georgia
- 90 Strongly Landlord-Friendly · R+3
- County
- — inherits STATE
- City
- — inherits STATE
ZIP-level market 30223
- Rents YoY
- 3.3%
- Active inventory
- 427
- Price-to-rent
- 8.6×
Monthly cashflow live
- Estimated rent
- $1,108 high interval (Pro) →
- Mortgage (P&I)
- −$603
- Tax from tax record
- −$31 /mo · $367/yr
- Insurance
- −$48
- HOA
- −$0
- Vacancy / Maint / Mgmt
- −$233
- Net cashflow
- $194
Break-even live
UW: 25.0% down · 7.5% · 30yr · 1.5% tax · 5.0% vac · 8.0% maint · 8.0% mgmt
Financing live
Cash to close
- Down payment
- $28,750
- Closing costs
- $3,450
- Reserves months
- —
- Total cash needed
- —
Loan-product check · same deal, 3 products live
Conventional
25% down · 7.5% · 30yr
- Down + closing
- —
- Monthly P&I
- —
- Monthly cashflow
- —
- DSCR
- —
- Eligible?
- —
Personal DTI + credit; lowest rate.
DSCR
20% down · 8.5% · 30yr
- Down + closing
- —
- Monthly P&I
- —
- Monthly cashflow
- —
- DSCR
- —
- Eligible?
- —
No personal income docs; deal must DSCR.
Hard money
10% down · 12.0% · 12mo
- Down + closing
- —
- Monthly P&I
- —
- Monthly cashflow
- —
- DSCR
- —
- Eligible?
- —
Short-term bridge; refi at stabilization.
Rent comps 40 comps
| Address | Beds | Baths | Sqft | Rent | $/sqft | DOM | Units | Dist |
|---|---|---|---|---|---|---|---|---|
| 415 N 18th St Unit 417 D Griffin, GA | 2.0 | 1.0 | 865 | $1,050 | $1.21 | 44d | 1 | 0.34mi |
| 419 N 18th St Griffin, GA | 2.0 | 1.0 | 865 | $1,050 | $1.21 | 18d | 1 | 0.37mi |
| 419 N 18th St Unit F Griffin, GA | 2.0 | 1.0 | 865 | $1,050 | $1.21 | 24d | 1 | 0.37mi |
| 356 N 19th St Griffin, GA | 2.0 | 1.5 | 896 | $995 | $1.11 | 1d | 1 | 0.41mi |
| 358 N 19th St Griffin, GA | 2.0 | 1.0 | 936 | $1,025 | $1.10 | 2d | 1 | 0.43mi |
| 405 N 15th St Unit A Griffin, GA | 1.0 | 1.0 | 586 | $650 | $1.11 | 3d | 1 | 0.50mi |
| 813 W Quilly St Griffin, GA | 2.0 | 1.0 | 838 | $1,200 | $1.43 | 4d | 1 | 0.51mi |
| 731 Williams St Unit A Griffin, GA | 1.0 | 1.0 | 770 | $800 | $1.04 | 44d | 1 | 0.56mi |
| 708 Ellis St Griffin, GA | 2.0 | 1.0 | 768 | $1,000 | $1.30 | 3d | 1 | 0.61mi |
| 716 Ray St Griffin, GA | 2.0 | 1.0 | 788 | $1,300 | $1.65 | 44d | 1 | 0.61mi |
| 215 Hillside Cir Griffin, GA | 2.0 | 1.0 | 1002 | $975 | $0.97 | 24d | 1 | 0.64mi |
| 207 Hillside Cir Griffin, GA | 3.0 | 1.0 | 1054 | $1,100 | $1.04 | 22d | 1 | 0.67mi |
| 353 N 13th St Unit 353 Griffin, GA | 2.0 | 1.0 | 1059 | $950 | $0.90 | 24d | 1 | 0.68mi |
| 113 Shandon Ln Griffin, GA | 3.0 | 2.0 | 1075 | $1,495 | $1.39 | 44d | 1 | 0.77mi |
| 503 Wheeler St Griffin, GA | 2.0 | 1.0 | 1028 | $1,250 | $1.22 | 44d | 1 | 0.81mi |
| 502 W Broadway St Griffin, GA | 1.0–2.0 | 1.0–2.0 | 1133 | $1,745 | $1.54 | 1d | 17 | 0.85mi |
| 212 Alabama St Griffin, GA | 2.0 | 1.0 | 728 | $995 | $1.37 | 44d | 1 | 0.95mi |
| 127 Tuscany Ln Griffin, GA | 3.0 | 2.0 | 1112 | $1,495 | $1.34 | 5d | 1 | 0.95mi |
| 816 Lane St Griffin, GA | 3.0 | 2.0 | 1120 | $1,300 | $1.16 | 44d | 1 | 0.95mi |
| 315 W Chappell St Unit 317 Griffin, GA | 2.0 | 1.0 | 980 | $900 | $0.92 | 24d | 1 | 0.98mi |
| 205 W Cherry St Griffin, GA | 2.0 | 1.0 | 972 | $950 | $0.98 | 3d | 1 | 0.98mi |
| 804 N 8th St Griffin, GA | 2.0 | 1.0 | 600 | $750 | $1.25 | 1d | 30 | 0.99mi |
| 724 W Taylor St Griffin, GA | 1.0 | 1.0 | 650 | $900 | $1.38 | 44d | 1 | 1.00mi |
| 738 W Poplar St Unit 4 Griffin, GA | 1.0 | 1.0 | 755 | $600 | $0.79 | 10d | 1 | 1.06mi |
| 217 W Central Ave Unit B Griffin, GA | 2.0 | 1.0 | 750 | $995 | $1.33 | 5d | 1 | 1.08mi |
| 1313 Ridgeview Dr Griffin, GA | 3.0 | 1.0 | 840 | $1,050 | $1.25 | 24d | 1 | 1.10mi |
| 413 N Hill St Unit B Griffin, GA | 2.0 | 1.0 | 792 | $875 | $1.10 | 4d | 1 | 1.10mi |
| 614 W Poplar St Griffin, GA | 3.0 | 1.0 | 1100 | $1,100 | $1.00 | 22d | 1 | 1.11mi |
| 616 W Poplar St Unit 1 Griffin, GA | 1.0 | 1.0 | 900 | $595 | $0.66 | 22d | 1 | 1.12mi |
| 1048 W College Street Ext Griffin, GA | 1.0 | 1.0 | 606 | $750 | $1.24 | 24d | 1 | 1.15mi |
| 617 Meriwether St Griffin, GA | 1.0–2.0 | 1.0 | 745 | $1,481 | $1.99 | 1d | 4 | 1.20mi |
| 521 Meriwether St Unit A Triplex Griffin, GA | 2.0 | 1.0 | 850 | $1,250 | $1.47 | 44d | 1 | 1.21mi |
| 521 Meriwether St Unit C Triplex Griffin, GA | 2.0 | 1.0 | 800 | $1,200 | $1.50 | 44d | 1 | 1.21mi |
| 521 Meriwether St Apt C Griffin, GA | 2.0 | 1.0 | 800 | $1,150 | $1.44 | 44d | 1 | 1.21mi |
| 416 W Poplar St Griffin, GA | 1.0–2.0 | 1.0 | 925 | $1,436 | $1.55 | 1d | 4 | 1.22mi |
| 117 Blanton Ave Unit A Griffin, GA | 2.0 | 1.0 | 718 | $975 | $1.36 | 24d | 1 | 1.22mi |
| 1344 D F Fuller Dr Griffin, GA | 3.0 | 1.0 | 800 | $1,200 | $1.50 | 24d | 1 | 1.25mi |
| 422 Meriwether St Unit 2 Griffin, GA | 3.0 | 2.0 | 1100 | $1,250 | $1.14 | 13d | 1 | 1.26mi |
| 1128 W College St Unit A-1 Model Unit Griffin, GA | 2.0 | 1.0 | 900 | $1,250 | $1.39 | 44d | 1 | 1.29mi |
| 1597 W McIntosh Rd Griffin, GA | 1.0–2.0 | 1.0–2.0 | 884 | $1,376 | $1.56 | 1d | 17 | 1.30mi |
Listing history 2 events
-
2026-04-24status Under Contract
-
2026-02-10$115,000 New
ⓘ Source: listings_history table (triggers on properties + properties_extension) + one-shot
backfill from property_details.listing_events for pre-trigger history.
Tax reassessment forecast GA · Resets to sale price
- Current annual tax
- $367 · $31/mo
- Projected year-2 tax
- $1,058 · $88/mo
- Expected delta
- +$691/yr (+$58/mo · 188.5%)
ⓘ Screening estimate from a state-policy table — verify with the county assessor before closing.
Climate risk First Street
- Flood 1/10 Low FEMA zone X (unshaded) · 0% chance over 30 yrs
- Wildfire 3/10 Moderate
- Heat 6/10 Major 7 d/yr ≥104°F today · 18 d/yr by 30 yrs out
- Wind 6/10 Major 38% chance of damaging wind over 30 yrs
- Air quality 4/10 Moderate 4 unhealthy d/yr today · 5 by 30 yrs out
Nearby sold comps map
Loading sold comps map…
Walkable amenities ~0.75 mi
Loading nearby amenities…
Taxation est. · year 1
- Rental income
- $13,296
- − Mortgage interest
- −$6,442
- − Property taxes
- −$367
- − Insurance
- −$575
- − Repairs & maintenance
- −$1,064
- − Management
- −$1,064
- − Depreciation
- −$3,345
- Taxable income
- $440
- Est. tax owed @ 24.0%
- −$106
- After-tax cash flow
- $2,220/yr
For passive investors: Depreciation is non-cash, so a rental often shows a tax loss while cash-flowing — sheltering income. Rental losses are passive: they offset passive income freely, and up to $25,000/yr can offset ordinary (W-2) income if you actively participate and your MAGI is under $100k (phasing out to $0 by $150k); unused losses carry forward. On sale, claimed depreciation is recaptured at up to 25%, and gains may owe capital-gains tax (a 1031 exchange can defer both). Figures are a year-1 estimate at your 24.0% rate — not tax advice; consult a CPA.
Schools (NCES district)
- District
- Griffin-Spalding County
- NCES district ID
- 1302520
- Math proficiency
- 13% ▼ -13.00%
- Reading proficiency
- 19% ▼ -12.00%
- Median HH income
- $40,895
- Composite
- 13.71/100
- National rank
- #9496
- State rank
- #151 of 174 in GA
Livability — Griffin
- Score
- 54/100
- State rank
- #529
- US rank
- #23746
Category grades
Schools grade is shown separately in the Schools card above.
Census & demographics
- Census place
- Griffin, GA
- County
- Spalding County · 66,676 people
- City population
- 28,414
- Metro
- Atlanta-Sandy Springs-Alpharetta, GA
- Population (ZIP)
- 38,262
- Household income
- $59,054
- Rent vs Own
- Severe rent burden
- 1297.0
Population outlook (Spalding County) Hauer SSP2
- Today (2025)
- 63,015 people
- By 2030
- 61,689 · -2.1%
- By 2040
- 57,932 · -8.1%
- By 2050
- 53,474 · -15.1%
- By 2075
- 43,228 · -31.4%
- By 2100
- 32,290 · -48.8%
Race, ethnicity, and origin ACS 2023
- Neighborhood character
- Diverse neighborhood (Simpson 0.59)
- Race & ethnicity
- White 50% Black 38% Hispanic / Latino 7% Two or more races 5% Asian 1%
- Hispanic origin (detail)
- Mexican 5%
- Common ancestry
- Slovak 1% Serbian 1%
- Foreign-born
- 4% · Canada, South Korea
- Languages at home
- 92% English-only · Spanish 6% Korean 1%
Political lean MEDSL · Spalding
- 2024 margin
- R (+16.7) · D 41.4% · R 58.1%
- 2008→2024 swing
- +2.1pp toward D · 2008: -18.8pp · 2024: -16.7pp
- All cycles
- 2024: R+16.7 2020: R+20.8 2016: R+24.2 2012: R+20.0 2008: R+18.8
Not yet ingested
- Civics
- —
Market trends
- HPI YoY
- ▼ -142.92%
- Current HPI
- 225.7933
- Rent YoY
- ▲ 3.34%
- Metro
- Atlanta-Sandy Springs-Alpharetta, GA
- State GDP YoY
- ▲ 2.66%
- F500 in state
- 28
Industry mix (Fortune 500 HQ in GA)
| Industry | F500 HQs | Revenue |
|---|---|---|
| Paper / Packaging | 2 | $29B |
|
||
| Retail | 1 | $160B |
|
||
| Transportation / Logistics | 1 | $91B |
|
||
| Airlines | 1 | $62B |
|
||
| Consumer Goods | 1 | $47B |
|
||
| Utilities | 1 | $25B |
|
||
Price history
2 events — show timeline
- 2026-04-24 Pending — GAMLS
- 2026-02-10 Listed $115,000 GAMLS
Property tax history
-1.7%/yrLatest (2025): $367 · -2.2% YoY. Source: county tax records.
Cash-flow waterfall
monthlySold comps — $/sqft
last 12 mo · ≤1 miLoading sold comps…