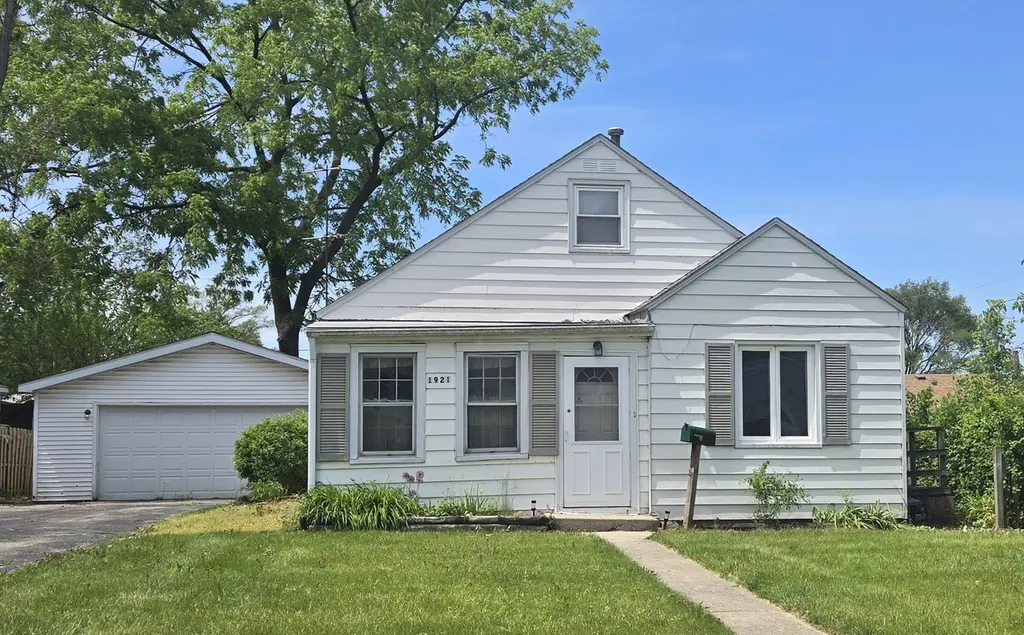
1921 Kelly Ave · Crest Hill, IL
Flood risk 1/10 · Minimal
- FEMA flood zone
- X (unshaded)
- Chance of flooding over 30 yrs
- 0.0%
- Est. flood insurance / yr
- $507 – $1,088
Fire risk 2/10 · Minimal
- Est. fire insurance / yr
- $804 – $1,492
Heat risk 3/10 · Minor
- Hot days now (above 102°F)
- 7 days/yr
- Hot days in 30 yrs
- 15 days/yr
Wind risk 2/10 · Minimal
- Chance of severe wind over 30 yrs
- 1.0%
Air-quality risk 2/10 · Minimal
- Unhealthy air days now
- 1 days/yr
- Unhealthy air days in 30 yrs
- 2 days/yr
Risk factors via First Street. Map © Google.
Why this score? — see what drove the C+ grade
The composite is a weighted blend of 9 inputs, each scored 0–100. Each bar is that input's sub-score; the figure is the points it added to the 100-point composite (weight × sub-score).
- Cash flow +26.3/30.0
- DSCR +8.9/10.0
- ARV discount +7.5/15.0
- 1% rule +7.1/10.0
- Schools +3.4/10.0
- Livability +3.2/5.0
- Rent growth +2.5/5.0
- Condition / age +2.5/5.0
- Appreciation +0.0/10.0
$199,000
🖨 Deal sheet 📄 Offer letter ✓ Due diligence
Listing remarks
Welcome to this two to three bedroom home. Enclosed front porch. Hardwood floors throughout. Electric Fireplace in Living Room. Kitchen features stainless steel appliances. Second bedroom has sliding doors that lead to the back yard and spacious deck. Attic has been finished with built-ins and extra storage. Could be a third bedroom or sitting area. Spacious two car garage and shed. Being Sold "AS-IS"
Key facts
- Finished attic
- Electric fireplace
- Sliding doors
Tags
Property features AI
Finance
- Other: Lot dimensions approximately 62 x 131 x 62 x 132; Lot size less than 0.25 acre; Parcel number available
- HOA & community: No master association fee required
Exterior
- Parking: Detached garage with garage door opener (owned); Asphalt driveway; Two covered garage spaces (two total parking spaces)
- Utilities: Public water; Public sewer; Electric service with circuit breakers
- Home design: Detached single-family home; 1.5-story design; Fee simple ownership; Built approximately 81–90 years ago; Shingle/asphalt roof; Property not currently leased
- Construction: Vinyl siding; Concrete perimeter foundation; Built before 1978
- Exterior features: Deck; Porch
Interior
- Kitchen: Kitchen on main level, 10 x 11 (laminate flooring, blinds and curtains/drapes)
- Bedrooms: Master bedroom on main level (hardwood flooring); Second bedroom on main level, 9 x 12 (hardwood flooring, blinds)
- Flooring: Hardwood flooring in main living areas and bedrooms; Laminate flooring in kitchen; Carpet in family room (attic level)
- Bathrooms: One full bathroom
- Heating & cooling: Natural gas heating; Window air conditioning units and electric cooling
- Interior features: Finished attic with interior stair; Crawl space basement; Drapes and blinds on windows; Five total rooms
- Laundry & utility: Laundry room
Neighborhood map
What this means for you Summary
Snapshot
- This is a 2-bed/1.0-bath other listed at $199k.
Deal economics
- At list price, monthly cash flow is $512 ($6k/yr) — positive.
- The deal already cash-flows at list — no discount required.
- Meets the 1% rule at list price ($2k rent vs $199k).
- Recommended offer: $193k (3.0% below list) — sets the bar for market timing.
- Cap rate 9.4% vs local median 5.3% in Crest Hill — top-decile yield for the area; either an underpriced asset or a hidden risk that comps aren't pricing in. Stress-test before assuming the spread holds.
Location & tenants
- Location reads 63/100 on livability (#792 in IL) — a middle-class / working-renter tenant base. Strengths: cost of living A+, housing A+, crime A-; Watch: amenities F, commute F, health & safety F.
- Lockport Twp Hsd 205 (suburban): math 35% / reading 38% proficiency, ranked #153 of 620 in IL (top 25%) — families likely to look elsewhere, expect single-tenant / working-renter base with shorter leases.
- Zoned schools: Lockport Township High Sch East (math 35% / reading 38%, grade F, #117 of 693 statewide, top 17%, 3,872 students, 0% FRL).
- Market conditions: 35 active listings in the ZIP; 3 comparable units currently listed for rent nearby; rentals leasing fast (median 1d on market — plan ~1-2 weeks tenant-placement turnaround); 2,028 units permitted in Will County in 2024 (530 in 5+ unit buildings).
Forward outlook
- Local home prices are declining (-3.0%/yr); year-one equity from $1k of loan paydown is wiped out by about $6k of value loss. Plan a longer hold.
- Will County population projected to shrink 4% by 2050 — rents likely to lag national; underwrite the cash flow, not the appreciation.
- At projected returns (-3.0% appreciation + 3.0% rent growth), your $56k cash investment doubles in ~10 years — after that, you're playing with house money.
Negotiation context
- It's been on market 32 days — a 3% lower offer ($193k) is reasonable based on typical stale-listing flexibility.
Risks & watch-outs
- Watch-outs: built in 1943 — expect roof / HVAC / electrical / plumbing capex.
Questions for the listing agent
- It's been on market 32 days. Have you received any prior offers? Is the seller open to a 3% concession, seller financing, or rate buy-down credit?
- Built in 1943 — when were the roof, HVAC, electrical panel, plumbing, and water heater last replaced?
- Is there a deadline driving the sale (1031 exchange, divorce, estate, relocation)? That informs how much negotiation room exists.
- Schools are F-rated, which usually means shorter tenancies and higher turnover. Who's the typical renter profile here, and what's been the actual vacancy rate?
- What's the average days-on-market for RENTAL listings here right now (not sales)? A rising rental-DOM trend means longer vacancies and softer asking-rent achievability than the comps imply.
- What's the recent tenant-quality profile in this submarket — average credit score on applications, eviction rate, late-payment / NSF rate, and stable-employment percentage? A property-management company in the area should have these aggregated.
- How much new for-sale + rental construction is in the pipeline within 1–3 miles? Heavy new supply typically softens prices + rents 12–24 months out; constrained supply supports both.
Investment metrics
- 1% rule
- 1.21% ✓
- Cap rate
- 9.38%
- Cash-on-cash
- 11.02%
- DSCR
- 1.49
- GRM
- 6.9
CMA / ARV
No comps found within radius.
Projected returns pro-forma
-3.0% appreciation · 3.0% rent growth · sell at horizon
- IRR
- 0.2%
- Equity multiple
- 1.01×
- Total profit
- $403
- Equity at exit
- $29,672
- IRR
- 9.9%
- Equity multiple
- 1.76×
- Total profit
- $42,531
- Equity at exit
- $17,206
Cash invested: $55,720 (down + closing). Projections, not guarantees.
Landlord ↔ Tenant lean methodology
- Overall (STATE)
- 43 Moderately Tenant-Leaning
- State Illinois
- 43 Moderately Tenant-Leaning · D+7
- County
- — inherits STATE
- City
- — inherits STATE
ZIP-level market 60403
- Active inventory
- 35
- Price-to-rent
- 6.9×
Monthly cashflow live
- Estimated rent
- $2,416 medium interval (Pro) →
- Mortgage (P&I)
- −$1,044
- Tax from tax record
- −$270 /mo · $3,240/yr
- Insurance
- −$83
- HOA
- −$0
- Vacancy / Maint / Mgmt
- −$507
- Net cashflow
- $512
Break-even live
UW: 25.0% down · 7.5% · 30yr · 1.5% tax · 5.0% vac · 8.0% maint · 8.0% mgmt
Financing live
Cash to close
- Down payment
- $49,750
- Closing costs
- $5,970
- Reserves months
- —
- Total cash needed
- —
Loan-product check · same deal, 3 products live
Conventional
25% down · 7.5% · 30yr
- Down + closing
- —
- Monthly P&I
- —
- Monthly cashflow
- —
- DSCR
- —
- Eligible?
- —
Personal DTI + credit; lowest rate.
DSCR
20% down · 8.5% · 30yr
- Down + closing
- —
- Monthly P&I
- —
- Monthly cashflow
- —
- DSCR
- —
- Eligible?
- —
No personal income docs; deal must DSCR.
Hard money
10% down · 12.0% · 12mo
- Down + closing
- —
- Monthly P&I
- —
- Monthly cashflow
- —
- DSCR
- —
- Eligible?
- —
Short-term bridge; refi at stabilization.
Rent comps 3 comps
| Address | Beds | Baths | Sqft | Rent | $/sqft | DOM | Units | Dist |
|---|---|---|---|---|---|---|---|---|
| 1805 Kelly Ave Crest Hill, IL | 3.0 | 1.5 | 1188 | $2,450 | $2.06 | 1d | 1 | 0.20mi |
| 1615 Arbor Ln Crest Hill, IL | 2.0 | 1.0–1.5 | 624 | $1,899 | $3.04 | 1d | 57 | 0.78mi |
| 1304 Norley Ave Joliet, IL | 3.0 | 3.0 | 1500 | $2,650 | $1.77 | 22d | 1 | 0.94mi |
Listing history 16 events
-
2026-06-18days on market $199,000 Active 32 DOM
-
2026-06-17days on market $199,000 Active 31 DOM
-
2026-06-16days on market $199,000 Active 30 DOM
-
2026-06-15days on market $199,000 Active 29 DOM
-
2026-06-13days on market $199,000 Active 27 DOM
-
2026-06-10status $199,000 Active 23 DOM
-
2026-06-09days on market $199,000 Contingent - Continue to Show 23 DOM
-
2026-06-08days on market $199,000 Contingent - Continue to Show 22 DOM
-
2026-06-08status $199,000 Contingent - Continue to Show 21 DOM
-
2026-06-07days on market $199,000 Active 21 DOM
-
2026-06-04statusdays on market $199,000 Active 18 DOM
-
2026-06-03days on market $199,000 Contingent - Continue to Show 17 DOM
-
2026-06-02days on market $199,000 Contingent - Continue to Show 16 DOM
-
2026-06-01days on market $199,000 Contingent - Continue to Show 15 DOM
-
2026-05-31days on market $199,000 Contingent - Continue to Show 14 DOM
-
2026-05-16$199,000 Active
ⓘ Source: listings_history table (triggers on properties + properties_extension) + one-shot
backfill from property_details.listing_events for pre-trigger history.
Tax reassessment forecast IL · Partial reset (capped growth)
- Current annual tax
- $3,240 · $270/mo
- Projected year-2 tax
- $3,878 · $323/mo
- Expected delta
- +$639/yr (+$53/mo · 19.7%)
ⓘ Screening estimate from a state-policy table — verify with the county assessor before closing.
Climate risk First Street
- Flood 1/10 Low FEMA zone X (unshaded) · 0% chance over 30 yrs
- Wildfire 2/10 Low
- Heat 3/10 Moderate 7 d/yr ≥102°F today · 15 d/yr by 30 yrs out
- Wind 2/10 Low 100% chance of damaging wind over 30 yrs
- Air quality 2/10 Low 1 unhealthy d/yr today · 2 by 30 yrs out
Nearby sold comps map
Loading sold comps map…
Walkable amenities ~0.75 mi
Loading nearby amenities…
Taxation est. · year 1
- Rental income
- $28,987
- − Mortgage interest
- −$11,147
- − Property taxes
- −$3,240
- − Insurance
- −$995
- − Repairs & maintenance
- −$2,319
- − Management
- −$2,319
- − Depreciation
- −$5,789
- Taxable income
- $3,178
- Est. tax owed @ 24.0%
- −$763
- After-tax cash flow
- $5,379/yr
For passive investors: Depreciation is non-cash, so a rental often shows a tax loss while cash-flowing — sheltering income. Rental losses are passive: they offset passive income freely, and up to $25,000/yr can offset ordinary (W-2) income if you actively participate and your MAGI is under $100k (phasing out to $0 by $150k); unused losses carry forward. On sale, claimed depreciation is recaptured at up to 25%, and gains may owe capital-gains tax (a 1031 exchange can defer both). Figures are a year-1 estimate at your 24.0% rate — not tax advice; consult a CPA.
Schools (NCES district)
- District
- Lockport Twp Hsd 205
- NCES district ID
- 1723350
- Math proficiency
- 35% ▼ -5.00%
- Reading proficiency
- 38% ▼ -4.00%
- Median HH income
- $69,994
- Composite
- 33.5/100
- National rank
- #5440
- State rank
- #153 of 620 in IL
Livability — Crest Hill
- Score
- 63/100
- State rank
- #792
- US rank
- #15733
Category grades
Schools grade is shown separately in the Schools card above.
Census & demographics
- Census place
- Crest Hill, IL
- City population
- 17,226
- Population (ZIP)
- 17,226
Population outlook (Will County) Hauer SSP2
- Today (2025)
- 705,368 people
- By 2030
- 708,154 · +0.4%
- By 2040
- 702,692 · -0.4%
- By 2050
- 680,249 · -3.6%
- By 2075
- 611,990 · -13.2%
- By 2100
- 516,215 · -26.8%
Race, ethnicity, and origin ACS 2023
- Neighborhood character
- Diverse neighborhood (Simpson 0.64)
- Race & ethnicity
- White 52% Hispanic / Latino 26% Black 14% Two or more races 13% Asian 3%
- Hispanic origin (detail)
- Mexican 22%
- Common ancestry
- Romanian 7% Lithuanian 2% Subsaharan African 1%
- Foreign-born
- 12% · Canada, South Korea
- Languages at home
- 76% English-only · Spanish 16% Russian/Polish/Slavic 2% Tagalog/Filipino 2%
Political lean MEDSL · Will
- 2024 margin
- Toss-up / Even · D 50.1% · R 48.5% · Other 1.4%
- 2008→2024 swing
- -11.6pp toward R · 2008: 13.2pp · 2024: 1.6pp
- All cycles
- 2024: D+1.6 2020: D+8.3 2016: D+5.7 2012: D+3.7 2008: D+13.2
Not yet ingested
- Civics
- —
Market trends
- HPI YoY
- ▼ -136.15%
- Current HPI
- 205.702
- Rent YoY
- —
- Metro
- —
- State GDP YoY
- ▲ 1.59%
- F500 in state
- 60
Industry mix (Fortune 500 HQ in IL)
| Industry | F500 HQs | Revenue |
|---|---|---|
| Insurance | 4 | $201B |
|
||
| Consumer Goods | 4 | $87B |
|
||
| Industrial Machinery | 3 | $64B |
|
||
| Healthcare | 2 | $55B |
|
||
| Retail / Pharmacy | 1 | $148B |
|
||
| Agriculture / Food | 1 | $86B |
|
||
Price history
1 event — show timeline
- 2026-05-16 Listed $199,000 MRED as Distributed by MLS Grid
Property tax history
+1.6%/yrLatest (2024): $3,240 · +9.4% YoY. Source: county tax records.
Cash-flow waterfall
monthlySold comps — $/sqft
last 12 mo · ≤1 miLoading sold comps…