 5-Plex
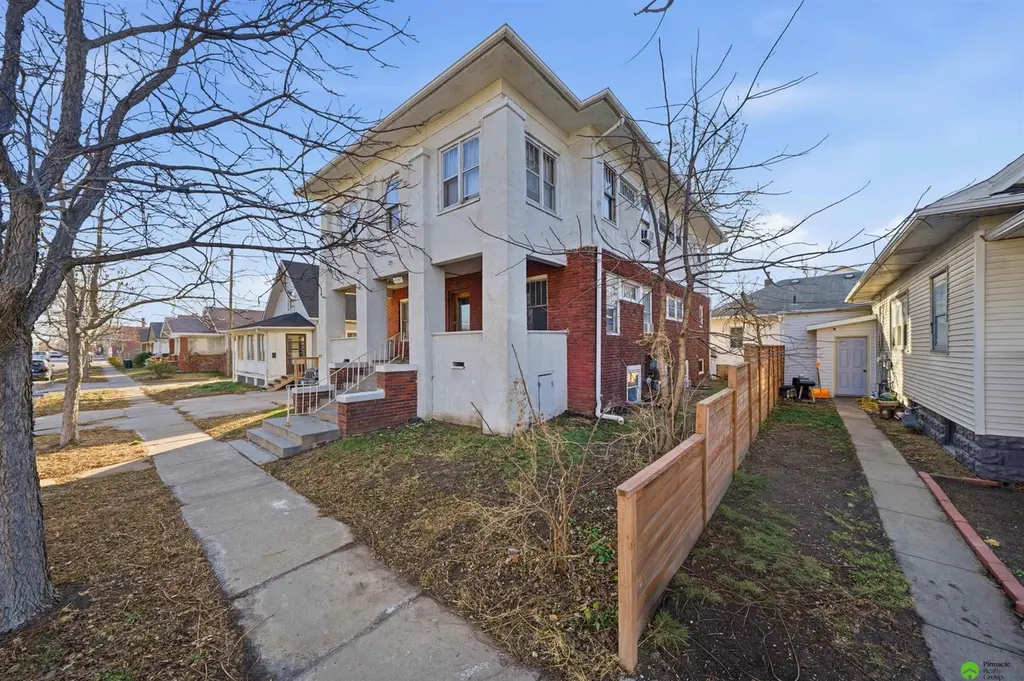
5907 Havelock Ave · Lincoln, NE
Flood risk 1/10 · Minimal
- FEMA flood zone
- X (unshaded)
- Chance of flooding over 30 yrs
- 0.0%
- Est. flood insurance / yr
- $507 – $1,088
Fire risk 3/10 · Minor
- Est. fire insurance / yr
- $1,161 – $2,155
Heat risk 3/10 · Minor
- Hot days now (above 104°F)
- 7 days/yr
- Hot days in 30 yrs
- 16 days/yr
Wind risk 2/10 · Minimal
- Chance of severe wind over 30 yrs
- —
Air-quality risk 1/10 · Minimal
- Unhealthy air days now
- 0 days/yr
- Unhealthy air days in 30 yrs
- 0 days/yr
Risk factors via First Street. Map © Google.
Why this score? — see what drove the B+ grade
The composite is a weighted blend of 9 inputs, each scored 0–100. Each bar is that input's sub-score; the figure is the points it added to the 100-point composite (weight × sub-score).
- Cash flow +30.0/30.0
- ARV discount +15.0/15.0
- 1% rule +10.0/10.0
- DSCR +10.0/10.0
- Schools +4.4/10.0
- Livability +4.2/5.0
- Rent growth +3.1/5.0
- Condition / age +2.5/5.0
- Appreciation +0.0/10.0
$249,900
🖨 Deal sheet (PDF) 📄 Offer letter ✓ Due diligence
Multi-family units
County records classify this as Multi-Family (5+ Unit). Listing-text estimate: 5 units. confirmed
5+ unit building — per-unit beds/baths from public records are typically unavailable; the breakdown below (if shown) is an estimate from the listing text.
Listing remarks
Well-located 5 unit apartment building at 5907 Havelock Avenue in Lincoln, Nebraska. This property offers a solid multifamily investment with stable rental demand in the Havelock neighborhood. The unit mix of 2/1 bed 1 bath, 2/0 bed 0 bath and 1-2 bed 1 bath units provides consistent occupancy and dependable cash flow for an investor. The property is positioned near local retail, dining, and major arterial access, with convenient proximity to surrounding residential neighborhoods and employment centers. Havelock continues to be a strong submarket for workforce housing, supporting long-term rental stability. This is a straightforward multifamily opportunity for an investor seeking steady in-
Key facts
- Employment centers
- Local retail
- Dining
Tags
Property features AI
Finance
- Financial info: Residential income property with five units
Exterior
- Parking: Two parking spaces; no garage
- Utilities: Public water; Public sewer; Six electric meters; Three gas meters
- Home design: Multi-family residential income property; Originally built in 1925
- Construction: Block foundation
- Exterior features: Lot about 44 x 66 (up to 1/4 acre); Lot included in price
Interior
- Heating & cooling: Natural gas forced air heating; Five separate air conditioning units (multi-unit property)
- Interior features: Contains a basement; One furnace serving the property
Neighborhood map
What this means for you Summary
Snapshot
- This is a 2×2bd/1ba + 2×2bd/?ba + 1×1bd/1ba units multifamily listed at $250k.
Deal economics
- At list price, monthly cash flow is $2k ($26k/yr) — positive. Per door: $439/mo.
- The deal already cash-flows at list — no discount required.
- Meets the 1% rule at list price ($5k rent vs $250k).
- Cap rate 16.8% vs local median 3.0% in Lincoln — top-decile yield for the area; either an underpriced asset or a hidden risk that comps aren't pricing in. Stress-test before assuming the spread holds.
Location & tenants
- Location reads 85/100 on livability (#5 in NE, #545 nationally) — a professional / high-income tenant draw. Strengths: amenities A+, cost of living A+, housing A+; Watch: crime D+.
- Lincoln Public Schools (urban): math 50% / reading 53% proficiency, ranked #59 of 111 in NE (top 53%) — acceptable for families but not a draw, mixed tenant base, ~2y average lease.
- Zoned schools: Huntington Elementary School (math 22% / reading 32%, grade F, #438 of 502 statewide, top 88%, 372 students, 0% FRL); Dawes Middle School (math 32% / reading 38%, grade F, #103 of 128 statewide, top 80%, 405 students, 48% FRL); Lincoln Northeast High School (math 34% / reading 36%, grade F, #207 of 261 statewide, top 79%, 1,812 students, 62% FRL) — zoned schools at 37% FRL track the district average.
- Zoned-school proficiency averages 32% at this address vs 52% district-wide (-19 pts) — the specific schools serving this property underperform the Lincoln Public Schools average; the district grade overstates school quality for this exact location.
- Market conditions: Rents rising (+2.4%/yr); 100 active listings in the ZIP; 1,940 units permitted in Lancaster County in 2024 (895 in 5+ unit buildings).
- At $4,933/mo this rent would consume 85% of the median local household income ($69k/yr) (locally 557% of renters already pay >50% of income on rent) — very limited rent-growth headroom before tenants either downsize or default.
Forward outlook
- Local home prices are declining (-3.0%/yr); year-one equity from $2k of loan paydown is wiped out by about $7k of value loss. Plan a longer hold.
- Lancaster County population projected at +37% by 2050 — long-run rental-demand tailwind backs the buy-and-hold thesis.
- At projected returns (-3.0% appreciation + 2.4% rent growth), your $70k cash investment doubles in ~4 years — after that, you're playing with house money.
Negotiation context
- Only 6 days on market — expect competitive offers; lowballing is unlikely to land.
- 8 sale attempts since 3y ago with the ask held roughly flat each time — persistent listings suggest the price (not the market) is what's stuck; bring a comps-based counter.
Risks & watch-outs
- Watch-outs: built in 1925 — expect roof / HVAC / electrical / plumbing capex.
Questions for the listing agent
- Can we see the unit-by-unit rent roll, current vacancy, and any below-market leases? What's the average tenancy length?
- What capital expenditures (roof, boiler, parking lot, exteriors) have been made in the last 5 years, and what's planned in the next 2?
- Built in 1925 — when were the roof, HVAC, electrical panel, plumbing, and water heater last replaced?
- Is there a deadline driving the sale (1031 exchange, divorce, estate, relocation)? That informs how much negotiation room exists.
- Schools are A-rated — typically a magnet for longer-tenancy family renters. What's the average tenant stay here, and is there a school-zone premium baked into asking?
- Crime grade is D in this area — have there been break-ins, vandalism, or insurance claims at this property in the last 3 years? What carrier currently insures it and at what premium?
- What's the average days-on-market for RENTAL listings here right now (not sales)? A rising rental-DOM trend means longer vacancies and softer asking-rent achievability than the comps imply.
- What's the recent tenant-quality profile in this submarket — average credit score on applications, eviction rate, late-payment / NSF rate, and stable-employment percentage? A property-management company in the area should have these aggregated.
- How much new apartment / multifamily construction is in the pipeline within 1–3 miles? Heavy new supply (>2% of stock underway) typically softens rents 12–24 months out; light construction supports rent growth.
Investment metrics
- 1% rule
- 1.97% ✓
- Cap rate
- 16.83%
- Cash-on-cash
- 37.64%
- DSCR
- 2.67
- GRM
- 4.2
CMA / ARV
- ARV (median comp)
- $308,399
- List price
- $249,900
- Delta
- -18.97%
- Verdict
- UNDERPRICED
- Comps
- 14 within 1.0 mi
Show comp detail 1 sale within ~0.75 mi
| Address | Dist | Beds/Ba | Sqft | Sold | Price | $/sf | Match |
|---|---|---|---|---|---|---|---|
| 4318 N 60th St | 0.08mi | 4/3.0 | 2,842 (+2%) | 21mo | $315,000 | $111 | 75 |
Match score weights: distance 35% · size 25% · config 20% · recency 20%. Top-matched comps best support the ARV.
Projected returns pro-forma
-3.0% appreciation · 2.37% rent growth · sell at horizon
- IRR
- 32.9%
- Equity multiple
- 2.38×
- Total profit
- $96,240
- Equity at exit
- $37,261
- IRR
- 39.6%
- Equity multiple
- 4.59×
- Total profit
- $251,447
- Equity at exit
- $21,607
Cash invested: $69,972 (down + closing). Projections, not guarantees.
Landlord ↔ Tenant lean methodology
- Overall (STATE)
- 83 Strongly Landlord-Friendly
- State Nebraska
- 83 Strongly Landlord-Friendly · R+13
- County
- — inherits STATE
- City
- — inherits STATE
ZIP-level market 68507
- Rents YoY
- 2.4%
- Active inventory
- 100
- Price-to-rent
- 20.7×
Monthly cashflow live
- Estimated rent
- $4,933 high interval (Pro) →
- Mortgage (P&I)
- −$1,311
- Tax from tax record
- −$288 /mo · $3,453/yr
- Insurance
- −$104
- HOA
- −$0
- Vacancy / Maint / Mgmt
- −$1,036
- Net cashflow
- $2,195
Break-even live
Sensitivity live
| Price | -10% $2,336 | -5% $2,265 | +0% $2,195 | +5% $2,124 | +10% $2,053 |
|---|---|---|---|---|---|
| Rent | -10% $1,805 | -5% $2,000 | +0% $2,195 | +5% $2,390 | +10% $2,584 |
| Rate | -1.0pp $2,321 | -0.5pp $2,258 | base $2,195 | +0.5pp $2,130 | +1.0pp $2,064 |
5-unit breakdown (identical units grouped — click to expand)
| Units | Beds | Baths | Est. rent |
|---|---|---|---|
| 2× units | 2 | 1 | $2,014 |
| #1 | 2 | 1 | $1,007 |
| #2 | 2 | 1 | $1,007 |
| 2× units | 2 | 0 | $2,014 |
| #3 | 2 | 0 | $1,007 |
| #4 | 2 | 0 | $1,007 |
| 1× unit | 1 | 1 | $903 |
| Total (5 units) | $4,933 | ||
UW: 25.0% down · 7.5% · 30yr · 1.5% tax · 5.0% vac · 8.0% maint · 8.0% mgmt
Financing live
Cash to close
- Down payment
- $62,475
- Closing costs
- $7,497
- Reserves months
- —
- Total cash needed
- —
Loan-product check · same deal, 3 products live
Conventional
25% down · 7.5% · 30yr
- Down + closing
- —
- Monthly P&I
- —
- Monthly cashflow
- —
- DSCR
- —
- Eligible?
- —
Personal DTI + credit; lowest rate.
DSCR
20% down · 8.5% · 30yr
- Down + closing
- —
- Monthly P&I
- —
- Monthly cashflow
- —
- DSCR
- —
- Eligible?
- —
No personal income docs; deal must DSCR.
Hard money
10% down · 12.0% · 12mo
- Down + closing
- —
- Monthly P&I
- —
- Monthly cashflow
- —
- DSCR
- —
- Eligible?
- —
Short-term bridge; refi at stabilization.
Listing history 20 events
-
2026-05-20status Pending
-
2026-05-13$249,900 New
-
2026-05-13historical
-
2026-05-01$259,000 New
-
2026-05-01historical
-
2026-04-10$279,000 New
-
2026-04-10historical
-
2026-03-20$299,000 New
-
2026-03-20historical
-
2026-03-10$326,600 New
-
2026-03-09historical
-
2026-01-05$336,600 New
-
2023-12-23historical
-
2023-09-20price $315,000
-
2023-06-26historical
-
2023-06-22$330,000 New
-
2023-04-26$2,835,000 New
-
2021-05-20soldstatus $330,000
-
2017-12-29soldstatus $205,100
-
2004-02-11soldstatus $150,000
ⓘ Source: listings_history table (triggers on properties + properties_extension) + one-shot
backfill from property_details.listing_events for pre-trigger history.
Tax reassessment forecast NE · Resets to sale price
- Current annual tax
- $3,453 · $288/mo
- Projected year-2 tax
- $4,323 · $360/mo
- Expected delta
- +$871/yr (+$73/mo · 25.2%)
ⓘ Screening estimate from a state-policy table — verify with the county assessor before closing.
Climate risk First Street
- Flood 1/10 Low FEMA zone X (unshaded) · 0% chance over 30 yrs
- Wildfire 3/10 Moderate
- Heat 3/10 Moderate 7 d/yr ≥104°F today · 16 d/yr by 30 yrs out
- Wind 2/10 Low
- Air quality 1/10 Low 0 unhealthy d/yr today · 0 by 30 yrs out
Nearby sold comps map
Loading sold comps map…
Walkable amenities ~0.75 mi
Loading nearby amenities…
Taxation est. · year 1
- Rental income
- $59,196
- − Mortgage interest
- −$13,998
- − Property taxes
- −$3,453
- − Insurance
- −$1,250
- − Repairs & maintenance
- −$4,736
- − Management
- −$4,736
- − Depreciation
- −$7,270
- Taxable income
- $23,754
- Est. tax owed @ 24.0%
- −$5,701
- After-tax cash flow
- $20,636/yr
For passive investors: Depreciation is non-cash, so a rental often shows a tax loss while cash-flowing — sheltering income. Rental losses are passive: they offset passive income freely, and up to $25,000/yr can offset ordinary (W-2) income if you actively participate and your MAGI is under $100k (phasing out to $0 by $150k); unused losses carry forward. On sale, claimed depreciation is recaptured at up to 25%, and gains may owe capital-gains tax (a 1031 exchange can defer both). Figures are a year-1 estimate at your 24.0% rate — not tax advice; consult a CPA.
Schools (NCES district)
- District
- Lincoln Public Schools
- NCES district ID
- 3172840
- Math proficiency
- 50% ▼ -6.00%
- Reading proficiency
- 53% ▼ -3.00%
- Median HH income
- $50,273
- Composite
- 44.05/100
- National rank
- #2880
- State rank
- #59 of 111 in NE
Livability — Lincoln
- Score
- 85/100
- State rank
- #5
- US rank
- #545
Category grades
Schools grade is shown separately in the Schools card above.
Census & demographics
- Census place
- Lincoln, NE
- County
- Lancaster County · 291,509 people
- City population
- 291,509
- Metro
- Lincoln, NE
- Population (ZIP)
- 16,029
- Household income
- $69,488
- Rent vs Own
- Severe rent burden
- 557.0
Population outlook (Lancaster County) Hauer SSP2
- Today (2025)
- 352,806 people
- By 2030
- 377,899 · +7.1%
- By 2040
- 428,582 · +21.5%
- By 2050
- 483,103 · +36.9%
- By 2075
- 632,390 · +79.2%
- By 2100
- 759,513 · +115.3%
Race, ethnicity, and origin ACS 2023
- Neighborhood character
- Predominantly White (82%)
- Race & ethnicity
- White 82% Two or more races 10% Hispanic / Latino 9% Black 2% Asian 1%
- Hispanic origin (detail)
- Mexican 7%
- Common ancestry
- Italian 2% Romanian 2% Lithuanian 2%
- Foreign-born
- 4% · Canada, China, Vietnam
- Languages at home
- 94% English-only · Spanish 4% Vietnamese 1% Arabic 1%
Political lean MEDSL · Lancaster
- 2024 margin
- Toss-up / Even · D 51.4% · R 47.1% · Other 1.5%
- 2008→2024 swing
- -0.7pp no change · 2008: 5.0pp · 2024: 4.3pp
- All cycles
- 2024: D+4.3 2020: D+7.8 2016: D+0.1 2012: R+1.0 2008: D+5.0
Not yet ingested
- Civics
- —
Market trends
- HPI YoY
- ▼ -273.66%
- Current HPI
- 234.3628
- Rent YoY
- ▲ 2.37%
- Metro
- Lincoln, NE
- State GDP YoY
- ▲ 0.68%
- F500 in state
- 2
Industry mix (Fortune 500 HQ in NE)
| Industry | F500 HQs | Revenue |
|---|---|---|
| Conglomerate | 1 | $371B |
|
||
Price history
+66.6% since first listed20 events — show timeline
- 2026-05-20 Pending — GPRMLS
- 2026-05-13 Listing Removed — GPRMLS
- 2026-05-13 Listed $249,900 GPRMLS
- 2026-05-01 Listing Removed — GPRMLS
- 2026-05-01 Listed $259,000 GPRMLS
- 2026-04-10 Listing Removed — GPRMLS
- 2026-04-10 Listed $279,000 GPRMLS
- 2026-03-20 Listing Removed — GPRMLS
- 2026-03-20 Listed $299,000 GPRMLS
- 2026-03-10 Listed $326,600 GPRMLS
- 2026-03-09 Listing Removed — GPRMLS
- 2026-01-05 Listed $336,600 GPRMLS
- 2023-12-23 Listing Removed — GPRMLS
- 2023-09-20 Price Changed $315,000 GPRMLS
- 2023-06-26 Listing Removed — GPRMLS
- 2023-06-22 Listed $330,000 GPRMLS
- 2023-04-26 Listed $2,835,000 GPRMLS
- 2021-05-20 Sold (Public Records) $330,000 Public Records
- 2017-12-29 Sold (Public Records) $205,100 Public Records
- 2004-02-11 Sold (Public Records) $150,000 Public Records
Property tax history
+7.5%/yrLatest (2025): $3,453 · -6.8% YoY. Source: county tax records.
Cash-flow waterfall
monthlySold comps — $/sqft
last 12 mo · ≤1 miLoading sold comps…