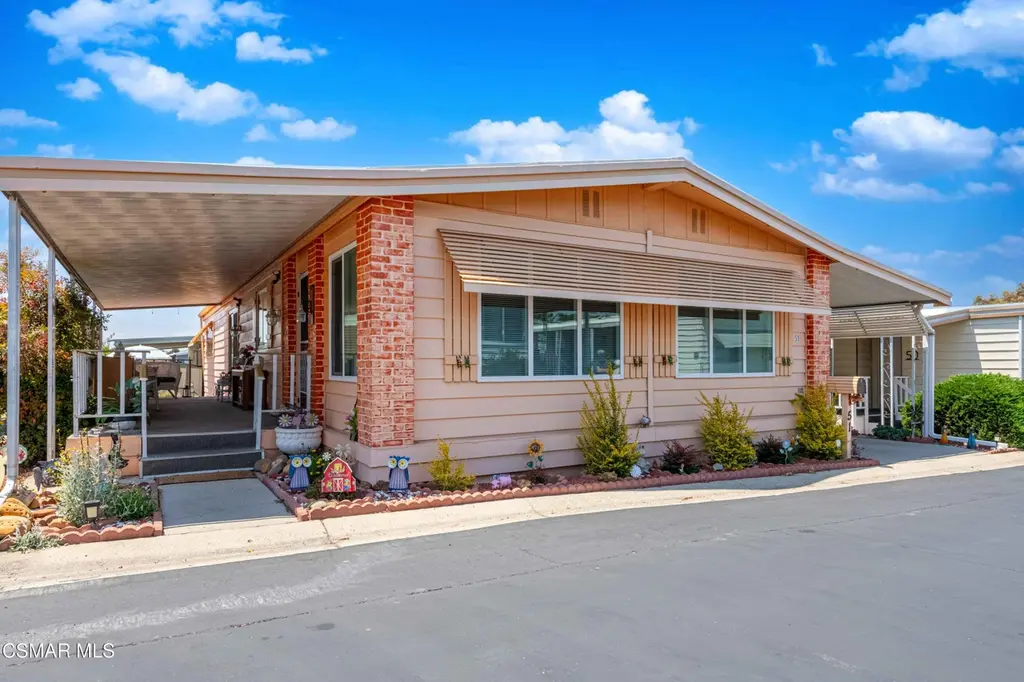
51 Saint Charles Ct #51 · Thousand Oaks, CA
Flood risk 1/10 · Minimal
- FEMA flood zone
- X (unshaded)
- Chance of flooding over 30 yrs
- 0.0%
- Est. flood insurance / yr
- $507 – $1,088
Fire risk 6/10 · Moderate
- Est. fire insurance / yr
- $659 – $1,223
Heat risk 3/10 · Minor
- Hot days now (above 99°F)
- 7 days/yr
- Hot days in 30 yrs
- 20 days/yr
Wind risk 1/10 · Minimal
- Chance of severe wind over 30 yrs
- —
Air-quality risk 2/10 · Minimal
- Unhealthy air days now
- 2 days/yr
- Unhealthy air days in 30 yrs
- 2 days/yr
Risk factors via First Street. Map © Google.
Why this score? — see what drove the B- grade
The composite is a weighted blend of 9 inputs, each scored 0–100. Each bar is that input's sub-score; the figure is the points it added to the 100-point composite (weight × sub-score).
- Cash flow +30.0/30.0
- DSCR +10.0/10.0
- 1% rule +9.8/10.0
- Schools +6.0/10.0
- ARV discount +5.0/15.0
- Livability +3.5/5.0
- Rent growth +2.6/5.0
- Condition / age +2.5/5.0
- Appreciation +0.0/10.0
$265,000
🖨 Deal sheet 📄 Offer letter ✓ Due diligence
Listing remarks MLS
Welcome to Ventu Estates 55+ Senior Park! This spacious home has new carpeting and flooring, new oven, fresh interior paint, and dual pane windows. Enjoy the beautiful community pool and clubhouse offering monthly potlucks, bingo, and wellness speakers. Conveniently located to markets, restaurants, shopping malls, hiking & biking trails.
Key facts
- Community pool
- Gas stovetop
- Front porch
Tags
Property features AI
Finance
- Other: All appliances and indoor/outdoor furnishings included; Pet restrictions apply; Rent control in effect; Manufactured homes allowed
- Financial info: Accepts Conventional and Cash offers
- HOA & community: Month-to-month land lease
Exterior
- Parking: 2-space carport (not attached)
- Home design: Manufactured home; Single-level entry with steps; Model: Budger; Located in a senior community
- Construction: Masonite siding; Aluminum and Masonite skirting; Pier jacks foundation; Built in 1976
- Exterior features: Front porch; Covered porch; Double pane windows; No significant view; Private pool and spa
Interior
- Kitchen: Microwave; Range hood
- Bedrooms: 2 bedrooms
- Flooring: Carpet; Linoleum
- Bathrooms: 2 full bathrooms
- Heating & cooling: Ceiling fan(s); Heating present
- Interior features: Wet bar; Bar
- Laundry & utility: Laundry area
Neighborhood map
What this means for you Summary
Snapshot
- This is a 2-bed/2.0-bath manufactured listed at $265k.
Deal economics
- At list price, monthly cash flow is $1k ($15k/yr) — positive.
- The deal already cash-flows at list — no discount required.
- Meets the 1% rule at list price ($4k rent vs $265k).
- Recommended offer: $257k (3.0% below list) — sets the bar for market timing.
- Cap rate 12.1% vs local median 2.8% in Thousand Oaks — top-decile yield for the area; either an underpriced asset or a hidden risk that comps aren't pricing in. Stress-test before assuming the spread holds.
Location & tenants
- Location reads 70/100 on livability (#226 in CA) — a middle-class / working-renter tenant base. Strengths: crime A+, commute A+, employment A+; Watch: cost of living F, health & safety F.
- Conejo Valley Unified (urban): math 57% / reading 72% proficiency, ranked #59 of 517 in CA (top 11%) — acceptable for families but not a draw, mixed tenant base, ~2y average lease; only 19% free/reduced lunch — higher-income household profile.
- Market conditions: Rents flat; 144 active listings in the ZIP; 11 comparable units currently listed for rent nearby; rentals at typical pace (median 16d on market — plan ~3-4 weeks tenant-placement turnaround); high-income renter base; 1,759 units permitted in Ventura County in 2024 (1,196 in 5+ unit buildings).
- This rent runs 32% of the median local income ($149k/yr) — at the standard rent-burdened threshold; future hikes will face affordability resistance.
Forward outlook
- Local home prices are declining (-3.0%/yr); year-one equity from $2k of loan paydown is wiped out by about $8k of value loss. Plan a longer hold.
- Ventura County population projected at +4% by 2050 — modest demand growth; plan on rents tracking national, not racing it.
- At projected returns (-3.0% appreciation + 0.3% rent growth), your $74k cash investment doubles in ~8 years — after that, you're playing with house money.
Negotiation context
- It's been on market 34 days — a 3% lower offer ($257k) is reasonable based on typical stale-listing flexibility.
- 2 sale attempts with the ask held roughly flat each time — persistent listings suggest the price (not the market) is what's stuck; bring a comps-based counter.
Risks & watch-outs
- Climate carrying-cost: major wildfire risk — expect insurance premiums to compound above CPI over the hold.
Questions for the listing agent
- It's been on market 34 days. Have you received any prior offers? Is the seller open to a 3% concession, seller financing, or rate buy-down credit?
- Built in 1976 — when were the roof, HVAC, electrical panel, plumbing, and water heater last replaced?
- Is there a deadline driving the sale (1031 exchange, divorce, estate, relocation)? That informs how much negotiation room exists.
- Schools are B-rated — typically a magnet for longer-tenancy family renters. What's the average tenant stay here, and is there a school-zone premium baked into asking?
- What's the average days-on-market for RENTAL listings here right now (not sales)? A rising rental-DOM trend means longer vacancies and softer asking-rent achievability than the comps imply.
- What's the recent tenant-quality profile in this submarket — average credit score on applications, eviction rate, late-payment / NSF rate, and stable-employment percentage? A property-management company in the area should have these aggregated.
- How much new for-sale + rental construction is in the pipeline within 1–3 miles? Heavy new supply typically softens prices + rents 12–24 months out; constrained supply supports both.
Investment metrics
- 1% rule
- 1.48% ✓
- Cap rate
- 12.07%
- Cash-on-cash
- 20.62%
- DSCR
- 1.92
- GRM
- 5.6
CMA / ARV
- ARV (median comp)
- $251,228
- List price
- $265,000
- Delta
- 5.48%
- Verdict
- FAIR
- Comps
- 12 within 1.0 mi
Show comp detail 12 sales within ~0.75 mi
| Address | Dist | Beds/Ba | Sqft | Sold | Price | $/sf | Match |
|---|---|---|---|---|---|---|---|
| 51 Saint Charles Ct #51 | 0.00mi | 2/2.0 | 1,536 (0%) | 10mo | $255,000 | $166 | 92 |
| 164 Phyllis Way | 0.07mi | 3/2.0 (+1) | 1,530 (-0%) | 12mo | $313,500 | $205 | 81 |
| 37 PRINGLE Ct | 0.03mi | 2/2.0 | 1,440 (-6%) | 11mo | $285,000 | $198 | 79 |
| 1 Ortega Dr | 0.18mi | 2/2.0 | 1,431 (-7%) | 4mo | $345,000 | $241 | 77 |
| 99 Jeannine Ct #99 | 0.12mi | 2/2.0 | 1,440 (-6%) | 9mo | $125,000 | $87 | 76 |
| 166 Phyllis Way #166 | 0.08mi | 3/2.0 (+1) | 1,488 (-3%) | 12mo | $325,000 | $218 | 76 |
| 90 Jeannine Ct #90 | 0.11mi | 2/2.0 | 1,440 (-6%) | 11mo | $255,000 | $177 | 75 |
| 223 Madonna | 0.11mi | 2/2.0 | 1,344 (-12%) | 3mo | $310,000 | $231 | 72 |
| 50 Saint Charles Ct | 0.02mi | 2/2.0 | 1,344 (-12%) | 8mo | $300,000 | $223 | 71 |
| 140 Allen Ct | 0.14mi | 2/2.0 | 1,440 (-6%) | 20mo | $260,000 | $181 | 67 |
| 73 Farland Dr #73 | 0.20mi | 2/2.0 | 1,320 (-14%) | 11mo | $147,500 | $112 | 58 |
| 141 Allen Ct | 0.13mi | 2/2.0 | 1,344 (-12%) | 18mo | $209,000 | $156 | 58 |
Match score weights: distance 35% · size 25% · config 20% · recency 20%. Top-matched comps best support the ARV.
Projected returns pro-forma
-3.0% appreciation · 0.3% rent growth · sell at horizon
- IRR
- 9.9%
- Equity multiple
- 1.38×
- Total profit
- $27,906
- Equity at exit
- $39,512
- IRR
- 16.6%
- Equity multiple
- 2.19×
- Total profit
- $88,651
- Equity at exit
- $22,912
Cash invested: $74,200 (down + closing). Projections, not guarantees.
Landlord ↔ Tenant lean methodology
- Overall (STATE)
- 18 Strongly Tenant-Friendly
- State California
- 18 Strongly Tenant-Friendly · D+13
- County
- — inherits STATE
- City
- — inherits STATE
ZIP-level market 91320
- Rents YoY
- 0.3%
- Active inventory
- 144
- Price-to-rent
- 5.6×
Monthly cashflow live
- Estimated rent
- $3,932 high interval (Pro) →
- Mortgage (P&I)
- −$1,390
- Tax est. 1.5%
- −$331 /mo · $3,975/yr
- Insurance
- −$110
- HOA
- −$0
- Vacancy / Maint / Mgmt
- −$826
- Net cashflow
- $1,275
Break-even live
UW: 25.0% down · 7.5% · 30yr · 1.5% tax · 5.0% vac · 8.0% maint · 8.0% mgmt
Financing live
Cash to close
- Down payment
- $66,250
- Closing costs
- $7,950
- Reserves months
- —
- Total cash needed
- —
Loan-product check · same deal, 3 products live
Conventional
25% down · 7.5% · 30yr
- Down + closing
- —
- Monthly P&I
- —
- Monthly cashflow
- —
- DSCR
- —
- Eligible?
- —
Personal DTI + credit; lowest rate.
DSCR
20% down · 8.5% · 30yr
- Down + closing
- —
- Monthly P&I
- —
- Monthly cashflow
- —
- DSCR
- —
- Eligible?
- —
No personal income docs; deal must DSCR.
Hard money
10% down · 12.0% · 12mo
- Down + closing
- —
- Monthly P&I
- —
- Monthly cashflow
- —
- DSCR
- —
- Eligible?
- —
Short-term bridge; refi at stabilization.
Rent comps 11 comps
| Address | Beds | Baths | Sqft | Rent | $/sqft | DOM | Units | Dist |
|---|---|---|---|---|---|---|---|---|
| 1048 Mountain Oak Pl Newbury Park, CA | 3.0 | 2.5 | 2019 | $4,200 | $2.08 | 23d | 1 | 0.18mi |
| 1384 Ashton Park Ln Newbury Park, CA | 3.0 | 2.5 | 1447 | $3,600 | $2.49 | 16d | 1 | 0.19mi |
| 1036 Pan Ct Newbury Park, CA | 3.0 | 2.5 | 2081 | $4,300 | $2.07 | 43d | 1 | 0.22mi |
| 341 Newbury Vista Ln Newbury Park, CA | 3.0 | 3.0 | 2200 | $4,600 | $2.09 | 43d | 1 | 0.30mi |
| 1570 Silver Shadow Dr Newbury Park, CA | 3.0 | 2.0 | 1611 | $4,100 | $2.55 | 2d | 1 | 0.30mi |
| 161 Heavenly Valley Rd Newbury Park, CA | 3.0 | 2.0 | 1499 | $3,395 | $2.26 | 3d | 1 | 0.34mi |
| 265 McKnight Rd Newbury Park, CA | 2.0 | 3.0 | 1200 | $3,800 | $3.17 | 43d | 1 | 0.44mi |
| 1699 Ramona Dr Newbury Park, CA | 3.0 | 3.0 | 2083 | $5,150 | $2.47 | 3d | 1 | 0.45mi |
| 1800 W Hillcrest Dr Newbury Park, CA | 1.0–2.0 | 1.0 | 932 | $2,917 | $3.13 | 1d | 33 | 0.82mi |
| 316 Pebble Beach Dr Newbury Park, CA | 3.0 | 2.5 | 2148 | $4,495 | $2.09 | 3d | 1 | 0.94mi |
| 562 Knollview Ln Thousand Oaks, CA | 3.0 | 3.0 | 1635 | $4,150 | $2.54 | 43d | 1 | 1.26mi |
Listing history 20 events
-
2026-06-18days on market $265,000 Active 34 DOM
-
2026-06-17days on market $265,000 Active 33 DOM
-
2026-06-16days on market $265,000 Active 32 DOM
-
2026-06-15days on market $265,000 Active 31 DOM
-
2026-06-13days on market $265,000 Active 29 DOM
-
2026-06-13days on market $265,000 Active 28 DOM
-
2026-06-10days on market $265,000 Active 26 DOM
-
2026-06-09days on market $265,000 Active 25 DOM
-
2026-06-08days on market $265,000 Active 24 DOM
-
2026-06-07days on market $265,000 Active 23 DOM
-
2026-06-05days on market $265,000 Active 20 DOM
-
2026-06-03days on market $265,000 Active 19 DOM
-
2026-06-02days on market $265,000 Active 18 DOM
-
2026-06-01days on market $265,000 Active 17 DOM
-
2026-05-31days on market $265,000 Active 16 DOM
-
2026-05-15$265,000 Active 488-char remark
-
2025-08-26status Pending 343-char remark
Show marketing remark (343 chars)
Welcome to Ventu Estates 55+ Senior Park! This spacious home has new carpeting and flooring, new oven, fresh interior paint, and dual pane windows. Enjoy the beautiful community pool and clubhouse offering monthly potlucks, bingo, and wellness speakers. Conveniently located to markets, restaurants, shopping malls, hiking & biking trails.
-
2025-08-26soldstatus $255,000 Closed 343-char remark
Show marketing remark (343 chars)
Welcome to Ventu Estates 55+ Senior Park! This spacious home has new carpeting and flooring, new oven, fresh interior paint, and dual pane windows. Enjoy the beautiful community pool and clubhouse offering monthly potlucks, bingo, and wellness speakers. Conveniently located to markets, restaurants, shopping malls, hiking & biking trails.
-
2025-07-12historical Active Under Contract 343-char remark
Show marketing remark (343 chars)
Welcome to Ventu Estates 55+ Senior Park! This spacious home has new carpeting and flooring, new oven, fresh interior paint, and dual pane windows. Enjoy the beautiful community pool and clubhouse offering monthly potlucks, bingo, and wellness speakers. Conveniently located to markets, restaurants, shopping malls, hiking & biking trails.
-
2025-05-30$265,000 Active 343-char remark
Show marketing remark (343 chars)
Welcome to Ventu Estates 55+ Senior Park! This spacious home has new carpeting and flooring, new oven, fresh interior paint, and dual pane windows. Enjoy the beautiful community pool and clubhouse offering monthly potlucks, bingo, and wellness speakers. Conveniently located to markets, restaurants, shopping malls, hiking & biking trails.
ⓘ Source: listings_history table (triggers on properties + properties_extension) + one-shot
backfill from property_details.listing_events for pre-trigger history.
Climate risk First Street
- Flood 1/10 Low FEMA zone X (unshaded) · 0% chance over 30 yrs
- Wildfire 6/10 Major
- Heat 3/10 Moderate 7 d/yr ≥99°F today · 20 d/yr by 30 yrs out
- Wind 1/10 Low
- Air quality 2/10 Low 2 unhealthy d/yr today · 2 by 30 yrs out
Nearby sold comps map
Loading sold comps map…
Walkable amenities ~0.75 mi
Loading nearby amenities…
Taxation est. · year 1
- Rental income
- $47,181
- − Mortgage interest
- −$14,844
- − Property taxes
- −$3,975
- − Insurance
- −$1,325
- − Repairs & maintenance
- −$3,774
- − Management
- −$3,774
- − Depreciation
- −$7,709
- Taxable income
- $11,779
- Est. tax owed @ 24.0%
- −$2,827
- After-tax cash flow
- $12,470/yr
For passive investors: Depreciation is non-cash, so a rental often shows a tax loss while cash-flowing — sheltering income. Rental losses are passive: they offset passive income freely, and up to $25,000/yr can offset ordinary (W-2) income if you actively participate and your MAGI is under $100k (phasing out to $0 by $150k); unused losses carry forward. On sale, claimed depreciation is recaptured at up to 25%, and gains may owe capital-gains tax (a 1031 exchange can defer both). Figures are a year-1 estimate at your 24.0% rate — not tax advice; consult a CPA.
Schools (NCES district)
- District
- Conejo Valley Unified
- NCES district ID
- 0609640
- Math proficiency
- 57% ▬ 0.00%
- Reading proficiency
- 72% ▲ 6.00%
- Median HH income
- $100,413
- Composite
- 59.57/100
- National rank
- #914
- State rank
- #59 of 517 in CA
Livability — Thousand Oaks
- Score
- 70/100
- State rank
- #226
- US rank
- #7364
Category grades
Schools grade is shown separately in the Schools card above.
Census & demographics
- Census place
- Thousand Oaks, CA
- County
- Ventura County · 829,955 people
- City population
- 121,704
- Metro
- Oxnard-Thousand Oaks-Ventura, CA
- Population (ZIP)
- 43,472
- Household income
- $148,991
- Rent vs Own
- Severe rent burden
- 756.0
Population outlook (Ventura County) Hauer SSP2
- Today (2025)
- 895,754 people
- By 2030
- 912,134 · +1.8%
- By 2040
- 931,454 · +4.0%
- By 2050
- 934,609 · +4.3%
- By 2075
- 924,899 · +3.3%
- By 2100
- 864,712 · -3.5%
Race, ethnicity, and origin ACS 2023
- Neighborhood character
- Diverse neighborhood (Simpson 0.56)
- Race & ethnicity
- White 63% Hispanic / Latino 19% Two or more races 16% Asian 11% Black 2%
- Hispanic origin (detail)
- Mexican 13%
- Common ancestry
- Italian 4% Romanian 3% Lithuanian 3%
- Foreign-born
- 19% · Canada, China, Vietnam
- Languages at home
- 76% English-only · Spanish 12% Other Indo-European 4% Chinese 2%
Political lean MEDSL · Ventura
- 2024 margin
- D (+15.1) · D 56.1% · R 41.0% · Other 2.9%
- 2008→2024 swing
- +2.8pp toward D · 2008: 12.3pp · 2024: 15.1pp
- All cycles
- 2024: D+15.1 2020: D+21.1 2016: D+16.8 2012: D+5.3 2008: D+12.3
Not yet ingested
- Civics
- —
Market trends
- HPI YoY
- ▼ -917.39%
- Current HPI
- 283.6467
- Rent YoY
- ▲ 0.30%
- Metro
- Oxnard-Thousand Oaks-Ventura, CA
- State GDP YoY
- ▲ 3.21%
- F500 in state
- 116
Industry mix (Fortune 500 HQ in CA)
| Industry | F500 HQs | Revenue |
|---|---|---|
| Technology | 27 | $1,492B |
|
||
| Financial Services | 3 | $174B |
|
||
| Retail | 3 | $44B |
|
||
| Insurance | 3 | $26B |
|
||
| Media / Entertainment | 2 | $115B |
|
||
| Pharmaceuticals / Biotech | 2 | $62B |
|
||
Price history
+0.0% since first listed5 events — show timeline
- 2026-05-15 Listed $265,000 CSMAR
- 2025-08-26 Pending — CSMAR
- 2025-08-26 Sold (MLS) $255,000 CSMAR
- 2025-07-12 Contingent — CSMAR
- 2025-05-30 Listed $265,000 CSMAR
Cash-flow waterfall
monthlySold comps — $/sqft
last 12 mo · ≤1 miLoading sold comps…