 Multi-family
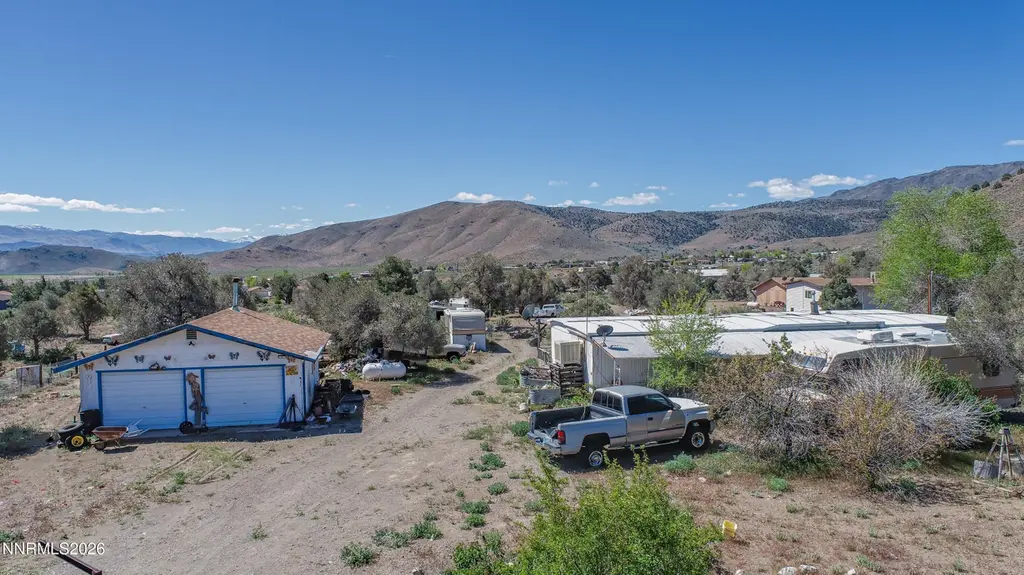
3791 Walker View Rd · Topaz Ranch Estates, NV
Flood risk 1/10 · Minimal
- FEMA flood zone
- X (shaded)
- Chance of flooding over 30 yrs
- 0.0%
- Est. flood insurance / yr
- $507 – $1,088
Fire risk 5/10 · Moderate
- Est. fire insurance / yr
- $490 – $910
Heat risk 4/10 · Minor
- Hot days now (above 92°F)
- 7 days/yr
- Hot days in 30 yrs
- 19 days/yr
Wind risk 1/10 · Minimal
- Chance of severe wind over 30 yrs
- —
Air-quality risk 9/10 · Severe
- Unhealthy air days now
- 20 days/yr
- Unhealthy air days in 30 yrs
- 20 days/yr
Risk factors via First Street. Map © Google.
Why this score? — see what drove the C- grade
The composite is a weighted blend of 9 inputs, each scored 0–100. Each bar is that input's sub-score; the figure is the points it added to the 100-point composite (weight × sub-score).
- Cash flow +25.2/30.0
- DSCR +8.3/10.0
- 1% rule +5.4/10.0
- Schools +3.8/10.0
- Livability +3.2/5.0
- Rent growth +2.5/5.0
- Condition / age +2.5/5.0
- Appreciation +2.1/10.0
- ARV discount +0.0/15.0
$175,000
🖨 Deal sheet 📄 Offer letter ✓ Due diligence
Multi-family units
County records classify this as Multi-Family (2-4 Unit). Listing-text estimate: 1 unit. estimate disagrees with records
Listing remarks
Opportunity knocks for 2.64 acres of land in Topaz Ranch Estates. Value is in the land only. Manufactured home on site is considered uninhabitable and is being sold as-is. Listing agent has not entered the structure and makes no representations regarding its condition. Buyer to verify all aspects of the property, including utilities, zoning, and potential uses. Cash only and property is being sold in AS IS condition. No access is allowed into any building without an accepted offer.
Key facts
- 2.64 acre lot
- 2 garage spots
- Built 1970
Property features AI
Finance
- Other: Road is publicly maintained with public/county road frontage; Zoning: MF
- Financial info: Tax amount provided (excluded from detailed financial section)
- HOA & community: Not a senior community; Subdivision: Topaz Ranch Estates
Exterior
- Parking: Detached garage; Total of 4 parking spaces; 2 garage spaces; Garage has built-in shelves, built-in cabinets and is finished
- Security: No specific security features listed
- Utilities: Public water and shared well; Septic tank; Cable connected; Electricity connected; Phone connected; Sewer connected; Water available; Cellular coverage; Internet connected; Water meter installed; Propane owned
- Home design: Manufactured home; One story
- Construction: Metal siding; Composition roof; 8-point foundation; Outbuilding on property; Double wide or single wide body type (manufactured)
- Exterior features: Deck; Patio; Level lot; Mountain view; No waterfront
Interior
- Kitchen: No kitchen appliances listed
- Bedrooms: Bedroom details not provided
- Flooring: Flooring details not provided
- Bathrooms: 2 full bathrooms
- Heating & cooling: Propane heating; Evaporative cooling
- Interior features: No built-in appliances listed; No specific interior finishes listed
- Laundry & utility: No laundry hookups or appliances listed
Neighborhood map
What this means for you Summary
Snapshot
- This is a 2-bed/2.0-bath multifamily listed at $175k.
Deal economics
- At list price, monthly cash flow is $393 ($5k/yr) — positive.
- The deal already cash-flows at list — no discount required.
- Meets the 1% rule at list price ($2k rent vs $175k).
- Recommended offer: $170k (3.0% below list) — sets the bar for market timing.
Location & tenants
- Location reads 63/100 on livability (#52 in NV) — a middle-class / working-renter tenant base. Strengths: crime A+, cost of living A+, housing A+; Watch: health & safety C-, employment D, amenities F.
- Douglas County School District (town): math 36% / reading 51% proficiency, ranked #3 of 17 in NV (top 18%) — families likely to look elsewhere, expect single-tenant / working-renter base with shorter leases.
- Zoned schools: Minden Elementary School (math 57% / reading 57%, grade C+, #33 of 402 statewide, top 9%, 380 students, 25% FRL); Pau Wa Lu Middle School (math 27% / reading 41%, grade F, #35 of 109 statewide, top 33%, 481 students, 36% FRL); Douglas High School (math 30% / reading 54%, grade F, #35 of 131 statewide, top 28%, 1,643 students, 22% FRL) — zoned schools at 28% FRL track the district average.
- Market conditions: 45 active listings in the ZIP; 314 units permitted in Douglas County in 2024 (0 in 5+ unit buildings).
Forward outlook
- Local home prices are declining (-3.0%/yr); year-one equity from $1k of loan paydown is wiped out by about $5k of value loss. Plan a longer hold.
- Douglas County population projected to shrink 8% by 2050 — rents likely to lag national; underwrite the cash flow, not the appreciation.
Negotiation context
- It's been on market 44 days — a 3% lower offer ($170k) is reasonable based on typical stale-listing flexibility.
Risks & watch-outs
- Climate carrying-cost: moderate wildfire risk — expect insurance premiums to compound above CPI over the hold.
Questions for the listing agent
- It's been on market 44 days. Have you received any prior offers? Is the seller open to a 3% concession, seller financing, or rate buy-down credit?
- Built in 1970 — when were the roof, HVAC, electrical panel, plumbing, and water heater last replaced?
- Is there a deadline driving the sale (1031 exchange, divorce, estate, relocation)? That informs how much negotiation room exists.
- Schools are F-rated, which usually means shorter tenancies and higher turnover. Who's the typical renter profile here, and what's been the actual vacancy rate?
- What's the average days-on-market for RENTAL listings here right now (not sales)? A rising rental-DOM trend means longer vacancies and softer asking-rent achievability than the comps imply.
- What's the recent tenant-quality profile in this submarket — average credit score on applications, eviction rate, late-payment / NSF rate, and stable-employment percentage? A property-management company in the area should have these aggregated.
- How much new apartment / multifamily construction is in the pipeline within 1–3 miles? Heavy new supply (>2% of stock underway) typically softens rents 12–24 months out; light construction supports rent growth.
Investment metrics
- 1% rule
- 1.04% ✓
- Cap rate
- 8.99%
- Cash-on-cash
- 9.63%
- DSCR
- 1.43
- GRM
- 8.0
CMA / ARV
- ARV (median comp)
- $118,976
- List price
- $175,000
- Delta
- 47.09%
- Verdict
- OVERPRICED
- Comps
- 1 within 2.0 mi
Projected returns pro-forma
-3.0% appreciation · 3.0% rent growth · sell at horizon
- IRR
- -1.8%
- Equity multiple
- 0.93×
- Total profit
- $-3,396
- Equity at exit
- $26,093
- IRR
- 7.8%
- Equity multiple
- 1.59×
- Total profit
- $28,982
- Equity at exit
- $15,131
Cash invested: $49,000 (down + closing). Projections, not guarantees.
Landlord ↔ Tenant lean methodology
- Overall (STATE)
- 71 Landlord-Friendly
- State Nevada
- 71 Landlord-Friendly · R+1
- County
- — inherits STATE
- City
- — inherits STATE
ZIP-level market 89444
- Home prices YoY
- -1.5%
- Active inventory
- 45
- Price-to-rent
- 16.0×
Monthly cashflow live
- Estimated rent
- $1,821 medium interval (Pro) →
- Mortgage (P&I)
- −$918
- Tax from tax record
- −$55 /mo · $659/yr
- Insurance
- −$73
- HOA
- −$0
- Vacancy / Maint / Mgmt
- −$382
- Net cashflow
- $393
Break-even live
2-unit breakdown (identical units grouped — click to expand)
| Units | Beds | Baths | Est. rent |
|---|---|---|---|
| 2× units | 2 | 1 | $1,820 |
| #1 | 2 | 1 | $910 |
| #2 | 2 | 1 | $910 |
| Total (2 units) | $1,821 | ||
UW: 25.0% down · 7.5% · 30yr · 1.5% tax · 5.0% vac · 8.0% maint · 8.0% mgmt
Financing live
Cash to close
- Down payment
- $43,750
- Closing costs
- $5,250
- Reserves months
- —
- Total cash needed
- —
Loan-product check · same deal, 3 products live
Conventional
25% down · 7.5% · 30yr
- Down + closing
- —
- Monthly P&I
- —
- Monthly cashflow
- —
- DSCR
- —
- Eligible?
- —
Personal DTI + credit; lowest rate.
DSCR
20% down · 8.5% · 30yr
- Down + closing
- —
- Monthly P&I
- —
- Monthly cashflow
- —
- DSCR
- —
- Eligible?
- —
No personal income docs; deal must DSCR.
Hard money
10% down · 12.0% · 12mo
- Down + closing
- —
- Monthly P&I
- —
- Monthly cashflow
- —
- DSCR
- —
- Eligible?
- —
Short-term bridge; refi at stabilization.
Listing history 18 events
-
2026-06-19days on market $175,000 Active 44 DOM
-
2026-06-18days on market $175,000 Active 43 DOM
-
2026-06-17days on market $175,000 Active 42 DOM
-
2026-06-16days on market $175,000 Active 41 DOM
-
2026-06-15days on market $175,000 Active 40 DOM
-
2026-06-14days on market $175,000 Active 38 DOM
-
2026-06-13days on market $175,000 Active 37 DOM
-
2026-06-10days on market $175,000 Active 35 DOM
-
2026-06-09days on market $175,000 Active 34 DOM
-
2026-06-08days on market $175,000 Active 33 DOM
-
2026-06-07days on market $175,000 Active 32 DOM
-
2026-06-05pricedays on market $175,000 Active 29 DOM
-
2026-06-03days on market $199,900 Active 28 DOM
-
2026-06-02days on market $199,900 Active 27 DOM
-
2026-06-01days on market $199,900 Active 26 DOM
-
2026-05-31days on market $199,900 Active 25 DOM
-
2026-05-30days on market $199,900 Active 24 DOM
-
2026-05-06$199,900 Active 486-char remark
ⓘ Source: listings_history table (triggers on properties + properties_extension) + one-shot
backfill from property_details.listing_events for pre-trigger history.
Tax reassessment forecast NV · Resets to sale price
- Current annual tax
- $659 · $55/mo
- Projected year-2 tax
- $1,032 · $86/mo
- Expected delta
- +$374/yr (+$31/mo · 56.8%)
ⓘ Screening estimate from a state-policy table — verify with the county assessor before closing.
Climate risk First Street
- Flood 1/10 Low FEMA zone X (shaded) · 0% chance over 30 yrs
- Wildfire 5/10 Major
- Heat 4/10 Moderate 7 d/yr ≥92°F today · 19 d/yr by 30 yrs out
- Wind 1/10 Low
- Air quality 9/10 Extreme 20 unhealthy d/yr today · 20 by 30 yrs out
Nearby sold comps map
Loading sold comps map…
Walkable amenities ~0.75 mi
Loading nearby amenities…
Taxation est. · year 1
- Rental income
- $21,852
- − Mortgage interest
- −$9,803
- − Property taxes
- −$659
- − Insurance
- −$875
- − Repairs & maintenance
- −$1,748
- − Management
- −$1,748
- − Depreciation
- −$5,091
- Taxable income
- $1,928
- Est. tax owed @ 24.0%
- −$463
- After-tax cash flow
- $4,254/yr
For passive investors: Depreciation is non-cash, so a rental often shows a tax loss while cash-flowing — sheltering income. Rental losses are passive: they offset passive income freely, and up to $25,000/yr can offset ordinary (W-2) income if you actively participate and your MAGI is under $100k (phasing out to $0 by $150k); unused losses carry forward. On sale, claimed depreciation is recaptured at up to 25%, and gains may owe capital-gains tax (a 1031 exchange can defer both). Figures are a year-1 estimate at your 24.0% rate — not tax advice; consult a CPA.
Schools (NCES district)
- District
- Douglas County School District
- NCES district ID
- 3200090
- Math proficiency
- 36% ▼ -8.00%
- Reading proficiency
- 51% ▼ -4.00%
- Median HH income
- $59,850
- Composite
- 38.28/100
- National rank
- #4235
- State rank
- #3 of 17 in NV
Livability — Topaz Ranch Estates
- Score
- 63/100
- State rank
- #52
- US rank
- #14922
Category grades
Schools grade is shown separately in the Schools card above.
Census & demographics
- Census place
- Topaz Ranch Estates, NV
- Population (ZIP)
- 3,198
Population outlook (Douglas County) Hauer SSP2
- Today (2025)
- 48,884 people
- By 2030
- 48,922 · +0.1%
- By 2040
- 47,504 · -2.8%
- By 2050
- 44,750 · -8.5%
- By 2075
- 39,162 · -19.9%
- By 2100
- 34,512 · -29.4%
Race, ethnicity, and origin ACS 2023
- Neighborhood character
- Predominantly White (76%)
- Race & ethnicity
- White 76% Two or more races 14% Hispanic / Latino 11% Native American 2% Black 2%
- Hispanic origin (detail)
- Mexican 10%
- Common ancestry
- Iranian 4% Russian 3% Romanian 3%
- Foreign-born
- 3% · Canada
- Languages at home
- 95% English-only · Spanish 4%
Political lean MEDSL · Douglas
- 2024 margin
- Solid R (+32.9) · D 32.5% · R 65.3% · Other 2.1%
- 2008→2024 swing
- -17.4pp toward R · 2008: -15.5pp · 2024: -32.9pp
- All cycles
- 2024: R+32.9 2020: R+29.5 2016: R+32.1 2012: R+26.8 2008: R+15.5
Not yet ingested
- Civics
- —
Market trends
- HPI YoY
- ▼ -5.71%
- Current HPI
- 370.2513
- Rent YoY
- —
- Metro
- —
- State GDP YoY
- ▲ 3.08%
- F500 in state
- 6
Industry mix (Fortune 500 HQ in NV)
| Industry | F500 HQs | Revenue |
|---|---|---|
| Hotels / Casinos | 3 | $36B |
|
||
Price history
-12.5% since first listed2 events — show timeline
- 2026-06-04 Price Changed $175,000 NNRMLS
- 2026-05-06 Listed $199,900 NNRMLS
Property tax history
+2.9%/yrLatest (2025): $659 · +3.0% YoY. Source: county tax records.
Cash-flow waterfall
monthlySold comps — $/sqft
last 12 mo · ≤1 miLoading sold comps…