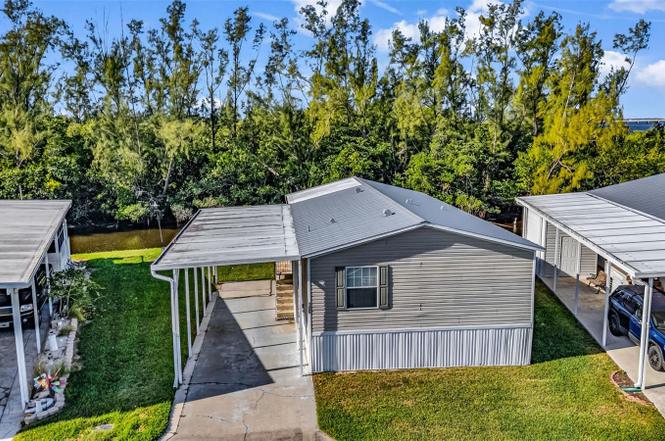
4300 Riverside Dr #106 · Cleveland, FL
Flood risk 10/10 · Severe
- FEMA flood zone
- AE
- Chance of flooding over 30 yrs
- 0.99%
- Est. flood insurance / yr
- $1,737 – $8,500
Fire risk 4/10 · Minor
- Est. fire insurance / yr
- $947 – $1,759
Heat risk 10/10 · Severe
- Hot days now (above 108°F)
- 7 days/yr
- Hot days in 30 yrs
- 28 days/yr
Wind risk 10/10 · Severe
- Chance of severe wind over 30 yrs
- 99.0%
Air-quality risk 2/10 · Minimal
- Unhealthy air days now
- 2 days/yr
- Unhealthy air days in 30 yrs
- 2 days/yr
Risk factors via First Street. Map © Google.
Why this score? — see what drove the C grade
The composite is a weighted blend of 9 inputs, each scored 0–100. Each bar is that input's sub-score; the figure is the points it added to the 100-point composite (weight × sub-score).
- Cash flow +19.8/30.0
- ARV discount +7.5/15.0
- 1% rule +6.7/10.0
- DSCR +6.3/10.0
- Schools +4.6/10.0
- Rent growth +3.5/5.0
- Livability +3.4/5.0
- Condition / age +2.5/5.0
- Appreciation +2.4/10.0
$165,000
🖨 Deal sheet 📄 Offer letter ✓ Due diligence
Listing remarks
Under contract-accepting backup offers. WATERFRONT 2 Bedroom, 2 Bathroom, 2 Car Carport manufactured home with a Florida room, BEAUTIFUL Water Views, a private dock and 72 FEET OF WATERFRONTAGE! lift MINUTES to Charlotte Harbor, located in the desirable 55+ River Forest Community! CLICK ON THE VIRTUAL TOUR LINK 1 FOR THE VIDEO AND VIRTUAL LINK 2 FOR THE 3D TOUR. This inviting home offers a bright and open floor plan enhanced by crown molding, skylights, and abundant natural light throughout. Designed for comfortable living and effortless entertaining, the open living room flows seamlessly into the kitchen—perfect for gathering with friends and family while preparing your favorite meal
Key facts
- Spa
- Private dock
- Screened-in deck
Tags
Property features AI
Finance
- Financial info: Total monthly fees $255; Total annual fees $3,060
- HOA & community: River Forest Mobile Home Park with required monthly fee; Monthly association fee $255; Association covers cable TV, pool, sewer, water, trash, grounds maintenance, recreational facilities and escrow reserves; Community clubhouse and pool; Shuffleboard court; Golf carts allowed; Buyer approval required; Senior community; Pets not allowed
Exterior
- Parking: Driveway; 2-space carport
- Utilities: Public water; Public sewer; Cable available; High‑speed internet available; Electricity connected
- Home design: Manufactured double-wide home; One story; Facing southeast; On waterfront with canal, pond and river views; Water access to brackish/salt canals, Intracoastal/Gulf access; Concrete seawall
- Construction: Vinyl siding; Metal roof; Crawlspace foundation; Completed condition
- Exterior features: Rear screened porch; Exterior lighting; Trees and landscaping; Paved surfaces
Interior
- Kitchen: Dishwasher; Microwave; Range; Refrigerator
- Bedrooms: 2 bedrooms
- Flooring: Vinyl
- Bathrooms: 2 full bathrooms
- Heating & cooling: Central heating (electric); Central air
- Interior features: Ceiling fans; Crown molding; Eat-in kitchen; Living room/dining room combo; Open floorplan; Stone counters; Skylight(s)
- Laundry & utility: Laundry inside
Neighborhood map
What this means for you Summary
Snapshot
- This is a 2-bed/2.0-bath manufactured listed at $165k.
Deal economics
- At list price, monthly cash flow is $-231 ($-3k/yr) — negative.
- To cash-flow at today's rent, offer at most $124k (24.7% below list).
- Meets the 1% rule at list price ($2k rent vs $165k).
- Recommended offer: $124k (24.7% below list) — sets the bar for cash-flow.
- Cap rate 7.7% vs local median 4.8% in Cleveland — top-decile yield for the area; either an underpriced asset or a hidden risk that comps aren't pricing in. Stress-test before assuming the spread holds.
Location & tenants
- Location reads 67/100 on livability (#574 in FL) — a middle-class / working-renter tenant base. Strengths: crime A+, cost of living A+, housing A+; Watch: employment D, schools F, amenities F.
- Charlotte (suburban): math 54% / reading 54% proficiency, ranked #22 of 73 in FL (top 30%) — acceptable for families but not a draw, mixed tenant base, ~2y average lease.
- Market conditions: Rents rising fast (+4.1%/yr); 1037 active listings in the ZIP; 2 comparable units currently listed for rent nearby; 4,585 units permitted in Charlotte County in 2024 (703 in 5+ unit buildings).
- This rent runs 32% of the median local income ($72k/yr) — at the standard rent-burdened threshold; future hikes will face affordability resistance.
Forward outlook
- Local home prices are declining (-3.0%/yr); year-one equity from $1k of loan paydown is wiped out by about $5k of value loss. Plan a longer hold.
- Charlotte County population projected at +24% by 2050 — long-run rental-demand tailwind backs the buy-and-hold thesis.
Negotiation context
- It's been on market 180 days — a 12% lower offer ($145k) is reasonable based on typical stale-listing flexibility.
- 8 sale attempts since 21y ago with the ask held roughly flat each time — persistent listings suggest the price (not the market) is what's stuck; bring a comps-based counter.
- Current owner paid $24k; list at $165k implies a 588% gain — meaningful room to come down on a strong offer.
Risks & watch-outs
- Watch-outs: flood insurance adds $427/mo.
- Climate carrying-cost: in FEMA flood zone AE (mandatory federal flood insurance); severe wind risk, 99% chance of damaging wind over 30y; extreme-heat days projected 7→28/yr by 2055 (HVAC capex compounding) — expect insurance premiums to compound above CPI over the hold.
Questions for the listing agent
- What do current leases actually rent for vs. the listed asking? Can we see a recent rent roll and the last 12 months of T-12 income?
- It's been on market 180 days. Have you received any prior offers? Is the seller open to a 25% concession, seller financing, or rate buy-down credit?
- What's the actual annual flood-insurance premium (NFIP or private), and is the property in a SFHA with mandatory coverage?
- What does the HOA fee cover, when was the last increase, and are there any pending special assessments or reserve-fund shortfalls?
- Why hasn't it sold? Are there any deal-killer items the seller is aware of (foundation, flood, title, zoning, code violations)?
- Is there a deadline driving the sale (1031 exchange, divorce, estate, relocation)? That informs how much negotiation room exists.
- Schools are F-rated, which usually means shorter tenancies and higher turnover. Who's the typical renter profile here, and what's been the actual vacancy rate?
- What's the average days-on-market for RENTAL listings here right now (not sales)? A rising rental-DOM trend means longer vacancies and softer asking-rent achievability than the comps imply.
- What's the recent tenant-quality profile in this submarket — average credit score on applications, eviction rate, late-payment / NSF rate, and stable-employment percentage? A property-management company in the area should have these aggregated.
- How much new for-sale + rental construction is in the pipeline within 1–3 miles? Heavy new supply typically softens prices + rents 12–24 months out; constrained supply supports both.
Investment metrics
- 1% rule
- 1.17% ✓
- Cap rate
- 7.71%
- Cash-on-cash
- 5.08%
- DSCR
- 1.23
- GRM
- 7.1
CMA / ARV
No comps found within radius.
Projected returns pro-forma
-3.0% appreciation · 4.13% rent growth · sell at horizon
- IRR
- -24.2%
- Equity multiple
- 0.16×
- Total profit
- $-38,815
- Equity at exit
- $24,602
- IRR
- -14.5%
- Equity multiple
- 0.10×
- Total profit
- $-41,731
- Equity at exit
- $14,266
Cash invested: $46,200 (down + closing). Projections, not guarantees.
Landlord ↔ Tenant lean methodology
- Overall (STATE)
- 87 Strongly Landlord-Friendly
- State Florida
- 87 Strongly Landlord-Friendly · R+3
- County
- — inherits STATE
- City
- — inherits STATE
ZIP-level market 33982
- Home prices YoY
- -1.2%
- Rents YoY
- 4.1%
- Active inventory
- 1037
- Price-to-rent
- 7.1×
Monthly cashflow live
- Estimated rent
- $1,936 medium interval (Pro) →
- Mortgage (P&I)
- −$865
- Tax from tax record
- −$145 /mo · $1,742/yr
- Insurance
- −$69
- Flood insurance flood zone
- −$427 /mo · $5,118/yr
- HOA
- −$255
- Vacancy / Maint / Mgmt
- −$407
- Net cashflow
- $-231
Break-even live
UW: 25.0% down · 7.5% · 30yr · 1.5% tax · 5.0% vac · 8.0% maint · 8.0% mgmt
Financing live
Cash to close
- Down payment
- $41,250
- Closing costs
- $4,950
- Reserves months
- —
- Total cash needed
- —
Loan-product check · same deal, 3 products live
Conventional
25% down · 7.5% · 30yr
- Down + closing
- —
- Monthly P&I
- —
- Monthly cashflow
- —
- DSCR
- —
- Eligible?
- —
Personal DTI + credit; lowest rate.
DSCR
20% down · 8.5% · 30yr
- Down + closing
- —
- Monthly P&I
- —
- Monthly cashflow
- —
- DSCR
- —
- Eligible?
- —
No personal income docs; deal must DSCR.
Hard money
10% down · 12.0% · 12mo
- Down + closing
- —
- Monthly P&I
- —
- Monthly cashflow
- —
- DSCR
- —
- Eligible?
- —
Short-term bridge; refi at stabilization.
Rent comps 2 comps
| Address | Beds | Baths | Sqft | Rent | $/sqft | DOM | Units | Dist |
|---|---|---|---|---|---|---|---|---|
| 3615 Dawson Ln Punta Gorda, FL | 2.0 | 2.0 | 1014 | $1,450 | $1.43 | 21d | 1 | 0.50mi |
| 3111 Riverside Dr Unit A Punta Gorda, FL | 2.0 | 2.0 | 1112 | $1,595 | $1.43 | 13d | 1 | 0.84mi |
HOA detail
- Monthly dues
- $255 · $3,060/yr
- Likely covers
- water
Listing history 27 events
-
2026-06-16status $165,000 Pending 180 DOM
-
2026-06-16days on market $165,000 Active 180 DOM
-
2026-06-15days on market $165,000 Active 179 DOM
-
2026-06-14days on market $165,000 Active 177 DOM
-
2026-06-13days on market $165,000 Active 176 DOM
-
2026-06-10days on market $165,000 Active 174 DOM
-
2026-06-09days on market $165,000 Active 173 DOM
-
2026-06-08days on market $165,000 Active 172 DOM
-
2026-06-05days on market $165,000 Active 168 DOM
-
2026-06-03days on market $165,000 Active 167 DOM
-
2026-06-02days on market $165,000 Active 166 DOM
-
2026-06-01days on market $165,000 Active 165 DOM
-
2026-05-31days on market $165,000 Active 164 DOM
-
2026-05-30days on market $165,000 Active 163 DOM
-
2025-12-18$165,000 Active
-
2025-08-23historical
-
2024-11-23$199,000 Active
-
2024-08-27historical
-
2024-04-07price $215,000
-
2023-10-08$235,000 Active
-
2009-02-12historical
-
2008-09-29$79,900
-
2008-06-09$130,000
-
2008-02-02$130,000
-
2007-06-11$159,900
-
2005-07-14$250,000
-
2002-12-01soldstatus $24,000
ⓘ Source: listings_history table (triggers on properties + properties_extension) + one-shot
backfill from property_details.listing_events for pre-trigger history.
Tax reassessment forecast FL · Resets to sale price
- Current annual tax
- $1,742 · $145/mo
- Projected year-2 tax
- $1,742 · $145/mo
- Expected delta
- $0/yr ($0/mo · 0.0%)
ⓘ Screening estimate from a state-policy table — verify with the county assessor before closing.
Climate risk First Street
- Flood 10/10 Extreme FEMA zone AE · 99% chance over 30 yrs
- Wildfire 4/10 Moderate
- Heat 10/10 Extreme 7 d/yr ≥108°F today · 28 d/yr by 30 yrs out
- Wind 10/10 Extreme 99% chance of damaging wind over 30 yrs
- Air quality 2/10 Low 2 unhealthy d/yr today · 2 by 30 yrs out
Nearby sold comps map
Loading sold comps map…
Walkable amenities ~0.75 mi
Loading nearby amenities…
Taxation est. · year 1
- Rental income
- $23,236
- − Mortgage interest
- −$9,243
- − Property taxes
- −$1,742
- − Insurance
- −$5,944
- − Repairs & maintenance
- −$1,859
- − Management
- −$1,859
- − HOA
- −$3,060
- − Depreciation
- −$4,800
- Taxable loss
- −$5,270
- Est. tax savings @ 24.0%
- +$1,265
- After-tax cash flow
- $-1,508/yr
For passive investors: Depreciation is non-cash, so a rental often shows a tax loss while cash-flowing — sheltering income. Rental losses are passive: they offset passive income freely, and up to $25,000/yr can offset ordinary (W-2) income if you actively participate and your MAGI is under $100k (phasing out to $0 by $150k); unused losses carry forward. On sale, claimed depreciation is recaptured at up to 25%, and gains may owe capital-gains tax (a 1031 exchange can defer both). Figures are a year-1 estimate at your 24.0% rate — not tax advice; consult a CPA.
Schools (NCES district)
- District
- Charlotte
- NCES district ID
- 1200240
- Math proficiency
- 54% ▼ -6.00%
- Reading proficiency
- 54% ▼ -1.00%
- Median HH income
- $44,864
- Composite
- 45.62/100
- National rank
- #2586
- State rank
- #22 of 73 in FL
Livability — Cleveland
- Score
- 67/100
- State rank
- #574
- US rank
- #10905
Category grades
Schools grade is shown separately in the Schools card above.
Census & demographics
- Census place
- Cleveland, FL
- County
- Charlotte County · 196,994 people
- City population
- 68,831
- Metro
- Punta Gorda, FL
- Population (ZIP)
- 13,006
- Household income
- $72,443
- Rent vs Own
- Severe rent burden
- 43.0
Population outlook (Charlotte County) Hauer SSP2
- Today (2025)
- 198,646 people
- By 2030
- 210,507 · +6.0%
- By 2040
- 230,857 · +16.2%
- By 2050
- 247,148 · +24.4%
- By 2075
- 281,777 · +41.8%
- By 2100
- 293,609 · +47.8%
Race, ethnicity, and origin ACS 2023
- Neighborhood character
- Predominantly White (81%)
- Race & ethnicity
- White 81% Two or more races 8% Hispanic / Latino 7% Black 7%
- Hispanic origin (detail)
- Puerto Rican 2% Cuban 3%
- Common ancestry
- Lithuanian 3% Iranian 3% Slovak 3%
- Foreign-born
- 6% · Canada, Jamaica
- Languages at home
- 93% English-only · Spanish 5% German/W. Germanic 1% Arabic 1%
Political lean MEDSL · Charlotte
- 2024 margin
- Solid R (+34.0) · D 32.7% · R 66.7%
- 2008→2024 swing
- -26.7pp toward R · 2008: -7.2pp · 2024: -34.0pp
- All cycles
- 2024: R+34.0 2020: R+26.6 2016: R+27.8 2012: R+14.3 2008: R+7.2
Not yet ingested
- Civics
- —
Market trends
- HPI YoY
- ▼ -5.25%
- Current HPI
- 448.5895
- Rent YoY
- ▲ 4.13%
- Metro
- Punta Gorda, FL
- State GDP YoY
- ▲ 3.28%
- F500 in state
- 36
Industry mix (Fortune 500 HQ in FL)
| Industry | F500 HQs | Revenue |
|---|---|---|
| Industrial Technology | 2 | $29B |
|
||
| Insurance | 2 | $17B |
|
||
| Retail | 1 | $60B |
|
||
| Technology Distribution | 1 | $58B |
|
||
| Homebuilding | 1 | $35B |
|
||
| Technology Manufacturing | 1 | $35B |
|
||
Price history
+587.5% since first listed13 events — show timeline
- 2025-12-18 Listed $165,000 Stellar MLS as Distributed by MLS Grid
- 2025-08-23 Listing Removed — Stellar MLS as Distributed by MLS Grid
- 2024-11-23 Listed $199,000 Stellar MLS as Distributed by MLS Grid
- 2024-08-27 Listing Removed — Stellar MLS as Distributed by MLS Grid
- 2024-04-07 Price Changed $215,000 Stellar MLS as Distributed by MLS Grid
- 2023-10-08 Listed $235,000 Stellar MLS as Distributed by MLS Grid
- 2009-02-12 Listing Removed — Stellar MLS as Distributed by MLS Grid
- 2008-09-29 Listed $79,900 Stellar MLS as Distributed by MLS Grid
- 2008-06-09 Listed $130,000 Stellar MLS as Distributed by MLS Grid
- 2008-02-02 Listed $130,000 Stellar MLS as Distributed by MLS Grid
- 2007-06-11 Listed $159,900 Stellar MLS as Distributed by MLS Grid
- 2005-07-14 Listed $250,000 Stellar MLS as Distributed by MLS Grid
- 2002-12-01 Sold (Public Records) $24,000 Public Records
Property tax history
+1.2%/yrLatest (2025): $1,742 · -8.0% YoY. Source: county tax records.
Cash-flow waterfall
monthlySold comps — $/sqft
last 12 mo · ≤1 miLoading sold comps…