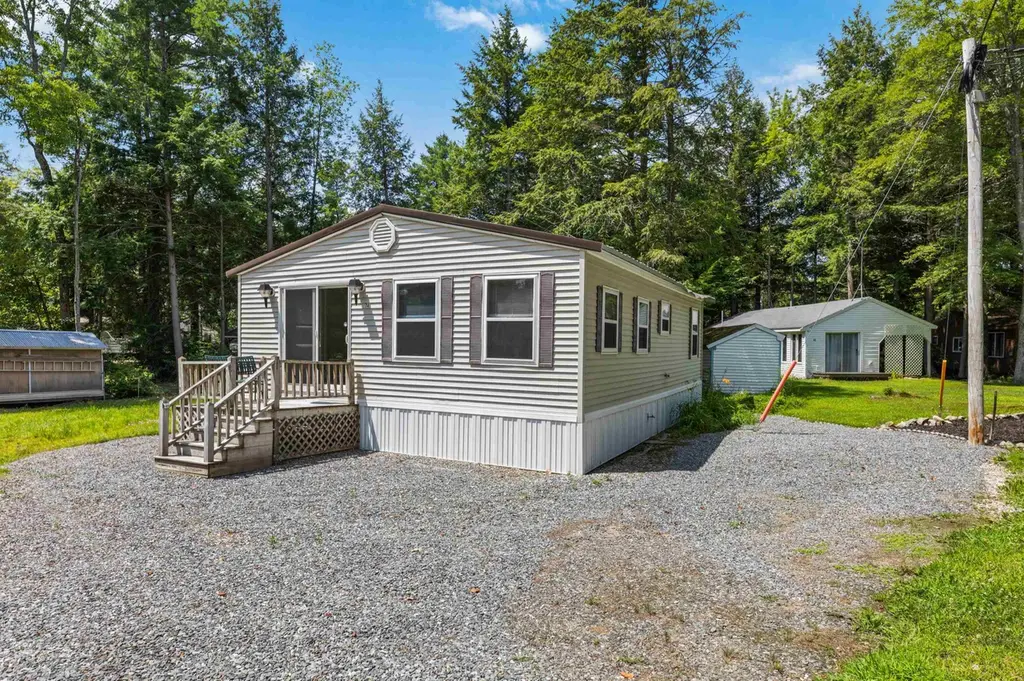
74 Fern Cir · Winchendon, MA
Flood risk 1/10 · Minimal
- FEMA flood zone
- X (unshaded)
- Chance of flooding over 30 yrs
- 0.0%
- Est. flood insurance / yr
- $507 – $1,088
Fire risk 1/10 · Minimal
- Est. fire insurance / yr
- $507 – $941
Heat risk 2/10 · Minimal
- Hot days now (above 91°F)
- 7 days/yr
- Hot days in 30 yrs
- 17 days/yr
Wind risk 4/10 · Minor
- Chance of severe wind over 30 yrs
- 17.0%
Air-quality risk 2/10 · Minimal
- Unhealthy air days now
- 1 days/yr
- Unhealthy air days in 30 yrs
- 1 days/yr
Risk factors via First Street. Map © Google.
Why this score? — see what drove the B+ grade
The composite is a weighted blend of 9 inputs, each scored 0–100. Each bar is that input's sub-score; the figure is the points it added to the 100-point composite (weight × sub-score).
- Cash flow +30.0/30.0
- 1% rule +10.0/10.0
- DSCR +10.0/10.0
- Appreciation +10.0/10.0
- ARV discount +7.5/15.0
- Livability +3.6/5.0
- Schools +2.7/10.0
- Rent growth +2.5/5.0
- Condition / age +2.5/5.0
$105,000
🖨 Deal sheet 📄 Offer letter ✓ Due diligence
Listing remarks
Hitting the market early in the season, this is a rare opportunity to complete renovations and still enjoy the summer ahead. Tucked along the shores of Sip Pond within the private, gated Woodbrook Camp & Tennis Club, where you own your home and the land, this seasonal community offers a peaceful, retreat-like setting. This 2-bedroom, 1-bath home is being sold as-is in its current unfinished condition—presenting the perfect chance to bring your vision to life and create your own getaway. Whether you’re envisioning a cozy camp, a stylish vacation escape, or an investment project, this property is ready for its next chapter. Woodbrook is a gated, family-friendly community des
Key facts
- $154 HOA
- Community pool
- Built 1991
Tags
Property features AI
Finance
- Other: Located in Woodbrook Camp and Tennis Club
- HOA & community: Condo association with annual fee; Annual fee approximately 1850; Association covers landscaping, plowing, recreation, sewer, trash, water, and park fees; Association amenities include recreation facility, beach access/rights, boat slip/dock, in-ground pool, pickleball, snow removal, and trash removal
Exterior
- Parking: Dirt and gravel driveway
- Utilities: Community and private water available; Community or shared septic; Circuit breaker electrical panel; Cable available; Fiber optic internet available; LP/Bottle gas available
- Home design: Cottage/Camp style; Manufactured home; Built in 1991; Metal roof
- Construction: Vinyl siding
- Exterior features: Beach access; Located in a condo development; Surveyed
Interior
- Kitchen: Gas stove
- Bathrooms: One full bathroom
- Heating & cooling: Forced air heating; Cooling: other
- Interior features: Six total rooms
Neighborhood map
What this means for you Summary
Snapshot
- This is a 2-bed/1.0-bath manufactured listed at $105k.
Deal economics
- At list price, monthly cash flow is $591 ($7k/yr) — positive.
- The deal already cash-flows at list — no discount required.
- Meets the 1% rule at list price ($2k rent vs $105k).
- Recommended offer: $102k (3.0% below list) — sets the bar for market timing.
- Cap rate 13.0% vs local median 4.2% in Winchendon — top-decile yield for the area; either an underpriced asset or a hidden risk that comps aren't pricing in. Stress-test before assuming the spread holds.
Location & tenants
- Location reads 71/100 on livability (#125 in MA) — a middle-class / working-renter tenant base. Strengths: housing A+, health & safety A+, crime A-; Watch: schools F, amenities F.
- Monadnock Regional School District (rural): math 25% / reading 36% proficiency, ranked #82 of 98 in NH (top 84%) — families likely to look elsewhere, expect single-tenant / working-renter base with shorter leases.
- Market conditions: 166 units permitted in Cheshire County in 2024 (0 in 5+ unit buildings).
Forward outlook
- In year one you build about $11k of equity ($726 loan paydown + $10k appreciation (10.0% local appreciation)).
- Cheshire County population projected at -18% by 2050 — secular population decline; favor cash flow + early exit over multi-decade hold.
- At projected returns (10.0% appreciation + 3.0% rent growth), your $29k cash investment doubles in ~2 years — after that, you're playing with house money.
- By year 4, paydown + projected appreciation supports a ~$40k cash-out refi (75% LTV) — recoverable capital for the next deal without selling this one.
Negotiation context
- It's been on market 46 days — a 3% lower offer ($102k) is reasonable based on typical stale-listing flexibility.
Questions for the listing agent
- It's been on market 46 days. Have you received any prior offers? Is the seller open to a 3% concession, seller financing, or rate buy-down credit?
- What does the HOA fee cover, when was the last increase, and are there any pending special assessments or reserve-fund shortfalls?
- Is there a deadline driving the sale (1031 exchange, divorce, estate, relocation)? That informs how much negotiation room exists.
- Schools are F-rated, which usually means shorter tenancies and higher turnover. Who's the typical renter profile here, and what's been the actual vacancy rate?
- What's the average days-on-market for RENTAL listings here right now (not sales)? A rising rental-DOM trend means longer vacancies and softer asking-rent achievability than the comps imply.
- What's the recent tenant-quality profile in this submarket — average credit score on applications, eviction rate, late-payment / NSF rate, and stable-employment percentage? A property-management company in the area should have these aggregated.
- How much new for-sale + rental construction is in the pipeline within 1–3 miles? Heavy new supply typically softens prices + rents 12–24 months out; constrained supply supports both.
Investment metrics
- 1% rule
- 1.86% ✓
- Cap rate
- 13.04%
- Cash-on-cash
- 24.11%
- DSCR
- 2.07
- GRM
- 4.5
CMA / ARV
- ARV (median comp)
- $227,839
- List price
- $105,000
- Delta
- -53.91%
- Verdict
- UNDERPRICED
- Comps
- 4 within 1.0 mi
Show comp detail 3 sales within ~0.75 mi
| Address | Dist | Beds/Ba | Sqft | Sold | Price | $/sf | Match |
|---|---|---|---|---|---|---|---|
| 76 Lakeside Dr | 0.08mi | 2/1.0 | 748 (-8%) | 11mo | $65,000 | $87 | 74 |
| 63 Brook Side Rd | 0.24mi | 2/1.0 | 760 (-7%) | 13mo | $135,000 | $178 | 67 |
| 94 Lakeside Dr | 0.07mi | 3/1.5 (+1) | 716 (-12%) | 24mo | $125,000 | $175 | 50 |
Match score weights: distance 35% · size 25% · config 20% · recency 20%. Top-matched comps best support the ARV.
Projected returns pro-forma
10.0% appreciation · 3.0% rent growth · sell at horizon
- IRR
- 42.5%
- Equity multiple
- 4.23×
- Total profit
- $94,974
- Equity at exit
- $94,592
- IRR
- 36.7%
- Equity multiple
- 9.52×
- Total profit
- $250,436
- Equity at exit
- $203,992
Cash invested: $29,400 (down + closing). Projections, not guarantees.
Landlord ↔ Tenant lean methodology
- Overall (STATE)
- 20 Strongly Tenant-Friendly
- State Massachusetts
- 20 Strongly Tenant-Friendly · D+15
- County
- — inherits STATE
- City
- — inherits STATE
ZIP-level market 03447
- Home prices YoY
- 24.0%
- Price-to-rent
- 4.5×
Monthly cashflow live
- Estimated rent
- $1,954 medium interval (Pro) →
- Mortgage (P&I)
- −$551
- Tax from tax record
- −$205 /mo · $2,457/yr
- Insurance
- −$44
- HOA
- −$154
- Vacancy / Maint / Mgmt
- −$410
- Net cashflow
- $591
Break-even live
UW: 25.0% down · 7.5% · 30yr · 1.5% tax · 5.0% vac · 8.0% maint · 8.0% mgmt
Financing live
Cash to close
- Down payment
- $26,250
- Closing costs
- $3,150
- Reserves months
- —
- Total cash needed
- —
Loan-product check · same deal, 3 products live
Conventional
25% down · 7.5% · 30yr
- Down + closing
- —
- Monthly P&I
- —
- Monthly cashflow
- —
- DSCR
- —
- Eligible?
- —
Personal DTI + credit; lowest rate.
DSCR
20% down · 8.5% · 30yr
- Down + closing
- —
- Monthly P&I
- —
- Monthly cashflow
- —
- DSCR
- —
- Eligible?
- —
No personal income docs; deal must DSCR.
Hard money
10% down · 12.0% · 12mo
- Down + closing
- —
- Monthly P&I
- —
- Monthly cashflow
- —
- DSCR
- —
- Eligible?
- —
Short-term bridge; refi at stabilization.
HOA detail
- Monthly dues
- $154 · $1,848/yr
- Likely covers
- security
Listing history 22 events
-
2026-06-19days on market $105,000 Active 46 DOM
-
2026-06-18days on market $105,000 Active 45 DOM
-
2026-06-17days on market $105,000 Active 44 DOM
-
2026-06-16days on market $105,000 Active 43 DOM
-
2026-06-15days on market $105,000 Active 42 DOM
-
2026-06-14days on market $105,000 Active 40 DOM
-
2026-06-12days on market $105,000 Active 39 DOM
-
2026-06-09days on market $105,000 Active 36 DOM
-
2026-06-08days on market $105,000 Active 35 DOM
-
2026-06-07days on market $105,000 Active 34 DOM
-
2026-06-07days on market $105,000 Active 33 DOM
-
2026-06-03days on market $105,000 Active 30 DOM
-
2026-06-02days on market $105,000 Active 29 DOM
-
2026-06-01days on market $105,000 Active 28 DOM
-
2026-05-31days on market $105,000 Active 27 DOM
-
2026-05-30days on market $105,000 Active 26 DOM
-
2026-05-04$105,000 Active 1386-char remark
-
2025-10-24price $94,900
-
2025-09-06price $99,900
-
2025-08-15price $106,000
-
2023-08-01price $125,000
-
2023-07-10price $130,000
ⓘ Source: listings_history table (triggers on properties + properties_extension) + one-shot
backfill from property_details.listing_events for pre-trigger history.
Tax reassessment forecast MA · Partial reset (capped growth)
- Current annual tax
- $2,457 · $205/mo
- Projected year-2 tax
- $2,457 · $205/mo
- Expected delta
- $0/yr ($0/mo · 0.0%)
ⓘ Screening estimate from a state-policy table — verify with the county assessor before closing.
Climate risk First Street
- Flood 1/10 Low FEMA zone X (unshaded) · 0% chance over 30 yrs
- Wildfire 1/10 Low
- Heat 2/10 Low 7 d/yr ≥91°F today · 17 d/yr by 30 yrs out
- Wind 4/10 Moderate 17% chance of damaging wind over 30 yrs
- Air quality 2/10 Low 1 unhealthy d/yr today · 1 by 30 yrs out
Nearby sold comps map
Loading sold comps map…
Walkable amenities ~0.75 mi
Loading nearby amenities…
Taxation est. · year 1
- Rental income
- $23,450
- − Mortgage interest
- −$5,882
- − Property taxes
- −$2,457
- − Insurance
- −$525
- − Repairs & maintenance
- −$1,876
- − Management
- −$1,876
- − HOA
- −$1,848
- − Depreciation
- −$3,055
- Taxable income
- $5,932
- Est. tax owed @ 24.0%
- −$1,424
- After-tax cash flow
- $5,664/yr
For passive investors: Depreciation is non-cash, so a rental often shows a tax loss while cash-flowing — sheltering income. Rental losses are passive: they offset passive income freely, and up to $25,000/yr can offset ordinary (W-2) income if you actively participate and your MAGI is under $100k (phasing out to $0 by $150k); unused losses carry forward. On sale, claimed depreciation is recaptured at up to 25%, and gains may owe capital-gains tax (a 1031 exchange can defer both). Figures are a year-1 estimate at your 24.0% rate — not tax advice; consult a CPA.
Schools (NCES district)
- District
- Monadnock Regional School District
- NCES district ID
- 3304890
- Math proficiency
- 25% ▼ -16.00%
- Reading proficiency
- 36% ▼ -6.00%
- Median HH income
- $56,314
- Composite
- 27.18/100
- National rank
- #7024
- State rank
- #82 of 98 in NH
Livability — Winchendon
- Score
- 71/100
- State rank
- #125
- US rank
- #6726
Category grades
Schools grade is shown separately in the Schools card above.
Census & demographics
- Population (ZIP)
- 2,317
Population outlook (Cheshire County) Hauer SSP2
- Today (2025)
- 74,613 people
- By 2030
- 72,495 · -2.8%
- By 2040
- 66,778 · -10.5%
- By 2050
- 60,963 · -18.3%
- By 2075
- 49,511 · -33.6%
- By 2100
- 39,687 · -46.8%
Race, ethnicity, and origin ACS 2023
- Neighborhood character
- Predominantly White (91%)
- Race & ethnicity
- White 91% Two or more races 8% Hispanic / Latino 7%
- Hispanic origin (detail)
- Puerto Rican 6%
- Common ancestry
- Lithuanian 11% Romanian 7% Slovene 4%
- Foreign-born
- 2% · Canada
- Languages at home
- 94% English-only · Spanish 5% French/Haitian/Cajun 1%
Political lean MEDSL · Cheshire
- 2024 margin
- Lean D (+9.8) · D 54.4% · R 44.6% · Other 1.1%
- 2008→2024 swing
- -17.8pp toward R · 2008: 27.6pp · 2024: 9.8pp
- All cycles
- 2024: D+9.8 2020: D+17.2 2016: D+12.6 2012: D+24.8 2008: D+27.6
Not yet ingested
- Civics
- —
Market trends
- HPI YoY
- ▲ 76.42%
- Current HPI
- 394.7824
- Rent YoY
- —
- Metro
- —
- State GDP YoY
- ▲ 2.28%
- F500 in state
- 38
Industry mix (Fortune 500 HQ in MA)
| Industry | F500 HQs | Revenue |
|---|---|---|
| Technology | 3 | $17B |
|
||
| Insurance | 2 | $84B |
|
||
| Retail | 2 | $76B |
|
||
| Life Sciences | 1 | $43B |
|
||
| Energy Technology | 1 | $31B |
|
||
| Aerospace / Defense | 1 | $18B |
|
||
Price history
-19.2% since first listed6 events — show timeline
- 2026-05-04 Listed $105,000 PrimeMLS
- 2025-10-24 Price Changed $94,900 PrimeMLS
- 2025-09-06 Price Changed $99,900 PrimeMLS
- 2025-08-15 Price Changed $106,000 PrimeMLS
- 2023-08-01 Price Changed $125,000 PrimeMLS
- 2023-07-10 Price Changed $130,000 PrimeMLS
Property tax history
+5.8%/yrLatest (2024): $2,457 · +8.0% YoY. Source: county tax records.
Cash-flow waterfall
monthlySold comps — $/sqft
last 12 mo · ≤1 miLoading sold comps…