11975 Creekview Ave · Bruce, MI
Flood risk No data
- FEMA flood zone
- —
- Chance of flooding over 30 yrs
- —
- Est. flood insurance / yr
- —
Fire risk No data
- Est. fire insurance / yr
- —
Heat risk No data
- Hot days now (above threshold)
- —
- Hot days in 30 yrs
- —
Wind risk No data
- Chance of severe wind over 30 yrs
- —
Air-quality risk No data
- Unhealthy air days now
- —
- Unhealthy air days in 30 yrs
- —
Risk factors via First Street. Map © Google.
Why this score? — see what drove the B- grade
The composite is a weighted blend of 9 inputs, each scored 0–100. Each bar is that input's sub-score; the figure is the points it added to the 100-point composite (weight × sub-score).
- Cash flow +30.0/30.0
- 1% rule +10.0/10.0
- DSCR +10.0/10.0
- ARV discount +7.5/15.0
- Schools +4.2/10.0
- Rent growth +2.5/5.0
- Livability +2.5/5.0
- Condition / age +2.5/5.0
- Appreciation +0.0/10.0
$41,900
🖨 Deal sheet 📄 Offer letter ✓ Due diligence
Listing remarks MLS
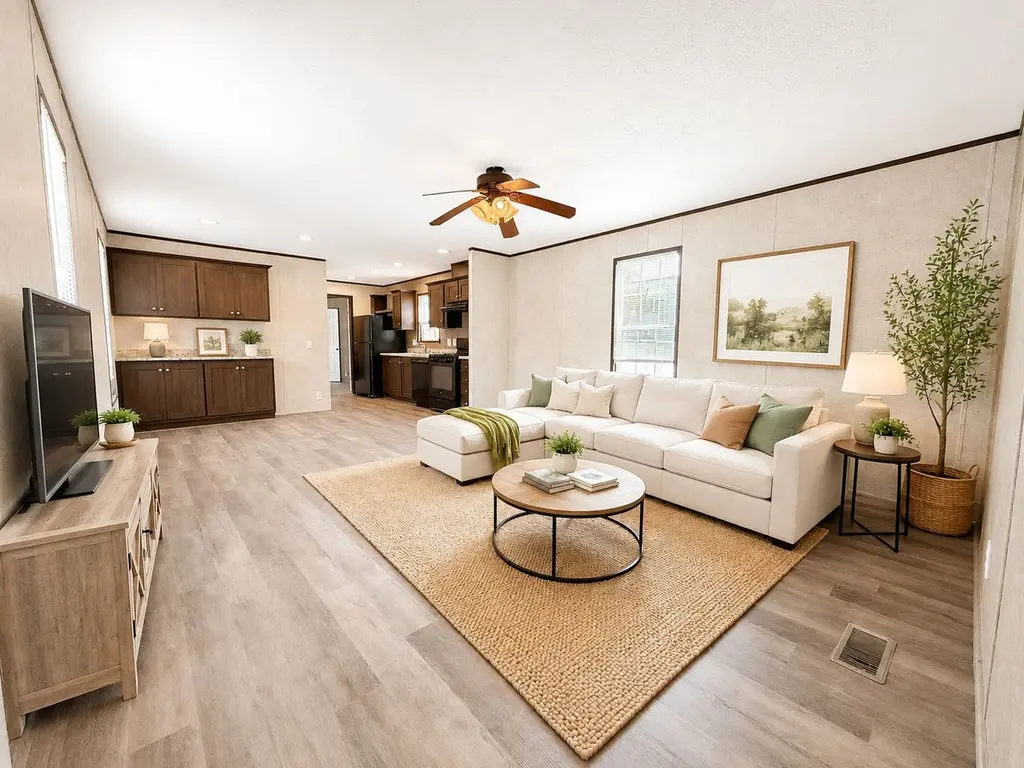
Summer is almost here and homes are going fast! Hurry in and make this charming and spacious 2-bedroom, 2-bathroom home yours! Enjoy a large corner site, with a large driveway on a private cul-de-sac! New flooring through out kitchen and living space! Tons of natural lighting, and modern recessed lighting in the cozy kitchen. The built in side bar and storage is perfect for all your appliances and gadgets. Both large sized bedrooms offer plenty of storage in the walk-in closets. Contact our office today to schedule a tour! "Photographs may be digitally stage for illustration purposes. Actual property may differ. Prospective residents should verify information to their own satisfaction. Contact our location for clarification and viewing arrangements. "
Key facts
- Walk-in closets
- Large corner site
- Private cul-de-sac
Tags
Neighborhood map
What this means for you Summary
Snapshot
- This is a 2-bed/2.0-bath other listed at $42k.
Deal economics
- At list price, monthly cash flow is $751 ($9k/yr) — positive.
- The deal already cash-flows at list — no discount required.
- Meets the 1% rule at list price ($1k rent vs $42k).
- Recommended offer: $38k (9.0% below list) — sets the bar for market timing.
Location & tenants
- Location reads: area grade B — affects rentability + tenant quality, not the cash-flow math above.
- Romeo Community Schools (suburban): math 43% / reading 51% proficiency, ranked #102 of 540 in MI (top 19%) — families likely to look elsewhere, expect single-tenant / working-renter base with shorter leases.
- Market conditions: 87 active listings in the ZIP; 7 comparable units currently listed for rent nearby; rentals lingering (median 44d on market — plan ~5-8 weeks vacancy on turnover, expect pricing pressure); 57% of comp listings sitting > 30 days — soft ceiling on asking rent; 1,321 units permitted in Macomb County in 2024 (86 in 5+ unit buildings).
Forward outlook
- Local home prices are declining (-3.0%/yr); year-one equity from $290 of loan paydown is wiped out by about $1k of value loss. Plan a longer hold.
- Macomb County population projected at +9% by 2050 — modest demand growth; plan on rents tracking national, not racing it.
- At projected returns (-3.0% appreciation + 3.0% rent growth), your $12k cash investment doubles in ~2 years — after that, you're playing with house money.
Negotiation context
- It's been on market 104 days — a 9% lower offer ($38k) is reasonable based on typical stale-listing flexibility.
Questions for the listing agent
- It's been on market 104 days. Have you received any prior offers? Is the seller open to a 9% concession, seller financing, or rate buy-down credit?
- Why hasn't it sold? Are there any deal-killer items the seller is aware of (foundation, flood, title, zoning, code violations)?
- Is there a deadline driving the sale (1031 exchange, divorce, estate, relocation)? That informs how much negotiation room exists.
- What's the average days-on-market for RENTAL listings here right now (not sales)? A rising rental-DOM trend means longer vacancies and softer asking-rent achievability than the comps imply.
- What's the recent tenant-quality profile in this submarket — average credit score on applications, eviction rate, late-payment / NSF rate, and stable-employment percentage? A property-management company in the area should have these aggregated.
- How much new for-sale + rental construction is in the pipeline within 1–3 miles? Heavy new supply typically softens prices + rents 12–24 months out; constrained supply supports both.
Investment metrics
- 1% rule
- 3.14% ✓
- Cap rate
- 27.81%
- Cash-on-cash
- 76.85%
- DSCR
- 4.42
- GRM
- 2.7
CMA / ARV
- ARV (median comp)
- $20,000
- List price
- $41,900
- Delta
- 109.50%
- Verdict
- OVERPRICED
- Comps
- 1 within 2.0 mi
Projected returns pro-forma
-3.0% appreciation · 3.0% rent growth · sell at horizon
- IRR
- 76.8%
- Equity multiple
- 4.50×
- Total profit
- $41,081
- Equity at exit
- $6,247
- IRR
- 80.5%
- Equity multiple
- 9.31×
- Total profit
- $97,469
- Equity at exit
- $3,623
Cash invested: $11,732 (down + closing). Projections, not guarantees.
Landlord ↔ Tenant lean methodology
- Overall (STATE)
- 62 Landlord-Friendly
- State Michigan
- 62 Landlord-Friendly · EVEN
- County
- — inherits STATE
- City
- — inherits STATE
ZIP-level market 48065
- Active inventory
- 87
- Price-to-rent
- 2.7×
Monthly cashflow live
- Estimated rent
- $1,318 high interval (Pro) →
- Mortgage (P&I)
- −$220
- Tax est. 1.5%
- −$52 /mo · $628/yr
- Insurance
- −$17
- HOA
- −$0
- Vacancy / Maint / Mgmt
- −$277
- Net cashflow
- $751
Break-even live
UW: 25.0% down · 7.5% · 30yr · 1.5% tax · 5.0% vac · 8.0% maint · 8.0% mgmt
Financing live
Cash to close
- Down payment
- $10,475
- Closing costs
- $1,257
- Reserves months
- —
- Total cash needed
- —
Loan-product check · same deal, 3 products live
Conventional
25% down · 7.5% · 30yr
- Down + closing
- —
- Monthly P&I
- —
- Monthly cashflow
- —
- DSCR
- —
- Eligible?
- —
Personal DTI + credit; lowest rate.
DSCR
20% down · 8.5% · 30yr
- Down + closing
- —
- Monthly P&I
- —
- Monthly cashflow
- —
- DSCR
- —
- Eligible?
- —
No personal income docs; deal must DSCR.
Hard money
10% down · 12.0% · 12mo
- Down + closing
- —
- Monthly P&I
- —
- Monthly cashflow
- —
- DSCR
- —
- Eligible?
- —
Short-term bridge; refi at stabilization.
Rent comps 7 comps
| Address | Beds | Baths | Sqft | Rent | $/sqft | DOM | Units | Dist |
|---|---|---|---|---|---|---|---|---|
| 11975 Creekview Ave Unit 218 Bruce Township, MI | 2.0 | 2.0 | 1120 | $1,299 | $1.16 | 43d | 1 | 0.03mi |
| 71580 Penny Ct Unit 253 Bruce Township, MI | 3.0 | 2.0 | 1216 | $1,219 | $1.00 | 14d | 1 | 0.10mi |
| 11981 Springbrook Ct Unit 10 Bruce Township, MI | 2.0 | 2.0 | 960 | $1,269 | $1.32 | 20d | 1 | 0.19mi |
| 11747 Cascade Cir Unit 92 Bruce Township, MI | 3.0 | 2.0 | 1152 | $1,379 | $1.20 | 43d | 1 | 0.22mi |
| 12556 Margaret Ct Unit 287 Bruce Township, MI | 3.0 | 2.0 | 1152 | $1,569 | $1.36 | 4d | 1 | 0.26mi |
| 11827 Cascade Cir Unit 4 Bruce Township, MI | 3.0 | 2.0 | 1056 | $1,299 | $1.23 | 43d | 1 | 0.31mi |
| 324 E Saint Clair St Romeo, MI | 2.0 | 1.5 | 1200 | $1,550 | $1.29 | 43d | 1 | 1.40mi |
Listing history 14 events
-
2026-06-18days on market $41,900 Active 104 DOM
-
2026-06-17days on market $41,900 Active 103 DOM
-
2026-06-16days on market $41,900 Active 102 DOM
-
2026-06-15days on market $41,900 Active 101 DOM
-
2026-06-13days on market $41,900 Active 99 DOM
-
2026-06-09days on market $41,900 Active 95 DOM
-
2026-06-08days on market $41,900 Active 94 DOM
-
2026-06-07days on market $41,900 Active 93 DOM
-
2026-06-04days on market $41,900 Active 90 DOM
-
2026-06-03days on market $41,900 Active 89 DOM
-
2026-06-02days on market $41,900 Active 88 DOM
-
2026-06-01days on market $41,900 Active 87 DOM
-
2026-05-31days on market $41,900 Active 86 DOM
-
2026-03-06$41,900 Active 771-char remark
Show marketing remark (771 chars)
Summer is almost here and homes are going fast! Hurry in and make this charming and spacious 2-bedroom, 2-bathroom home yours! Enjoy a large corner site, with a large driveway on a private cul-de-sac! New flooring through out kitchen and living space! Tons of natural lighting, and modern recessed lighting in the cozy kitchen. The built in side bar and storage is perfect for all your appliances and gadgets. Both large sized bedrooms offer plenty of storage in the walk-in closets. Contact our office today to schedule a tour! "Photographs may be digitally stage for illustration purposes. Actual property may differ. Prospective residents should verify information to their own satisfaction. Contact our location for clarification and viewing arrangements. "
ⓘ Source: listings_history table (triggers on properties + properties_extension) + one-shot
backfill from property_details.listing_events for pre-trigger history.
Nearby sold comps map
Loading sold comps map…
Walkable amenities ~0.75 mi
Loading nearby amenities…
Taxation est. · year 1
- Rental income
- $15,811
- − Mortgage interest
- −$2,347
- − Property taxes
- −$628
- − Insurance
- −$210
- − Repairs & maintenance
- −$1,265
- − Management
- −$1,265
- − Depreciation
- −$1,219
- Taxable income
- $8,877
- Est. tax owed @ 24.0%
- −$2,130
- After-tax cash flow
- $6,885/yr
For passive investors: Depreciation is non-cash, so a rental often shows a tax loss while cash-flowing — sheltering income. Rental losses are passive: they offset passive income freely, and up to $25,000/yr can offset ordinary (W-2) income if you actively participate and your MAGI is under $100k (phasing out to $0 by $150k); unused losses carry forward. On sale, claimed depreciation is recaptured at up to 25%, and gains may owe capital-gains tax (a 1031 exchange can defer both). Figures are a year-1 estimate at your 24.0% rate — not tax advice; consult a CPA.
Schools (NCES district)
- District
- Romeo Community Schools
- NCES district ID
- 2630090
- Math proficiency
- 43% ▼ -5.00%
- Reading proficiency
- 51% ▼ -8.00%
- Median HH income
- $73,121
- Composite
- 42.48/100
- National rank
- #3212
- State rank
- #102 of 540 in MI
Livability — Bruce
No livability data for this city. (Only ~50 U.S. cities are tracked.)
Census & demographics
- Population (ZIP)
- 11,344
Population outlook (Macomb County) Hauer SSP2
- Today (2025)
- 925,296 people
- By 2030
- 948,226 · +2.5%
- By 2040
- 983,961 · +6.3%
- By 2050
- 1,010,200 · +9.2%
- By 2075
- 1,076,222 · +16.3%
- By 2100
- 1,077,065 · +16.4%
Race, ethnicity, and origin ACS 2023
- Neighborhood character
- Predominantly White (91%)
- Race & ethnicity
- White 91% Hispanic / Latino 5% Two or more races 4%
- Common ancestry
- Romanian 14% Lithuanian 4% Slovak 4%
- Foreign-born
- 4% · Canada
- Languages at home
- 95% English-only · Spanish 3% Other Indo-European 1% German/W. Germanic 1%
Political lean MEDSL · Macomb
- 2024 margin
- R (+13.7) · D 42.2% · R 55.9% · Other 1.9%
- 2008→2024 swing
- -22.3pp toward R · 2008: 8.6pp · 2024: -13.7pp
- All cycles
- 2024: R+13.7 2020: R+8.1 2016: R+11.6 2012: D+4.0 2008: D+8.6
Not yet ingested
- Civics
- —
Market trends
- HPI YoY
- ▼ -252.70%
- Current HPI
- 214.524
- Rent YoY
- —
- Metro
- —
- State GDP YoY
- ▲ 1.37%
- F500 in state
- 28
Industry mix (Fortune 500 HQ in MI)
| Industry | F500 HQs | Revenue |
|---|---|---|
| Automotive Parts | 3 | $48B |
|
||
| Automotive | 2 | $372B |
|
||
| Chemicals | 1 | $45B |
|
||
| Automotive Retail | 1 | $29B |
|
||
| Healthcare / Medical Devices | 1 | $23B |
|
||
| Automotive Technology | 1 | $20B |
|
||
Price history
1 event — show timeline
- 2026-03-06 Listed $41,900 Zillow
Cash-flow waterfall
monthlySold comps — $/sqft
last 12 mo · ≤1 miLoading sold comps…