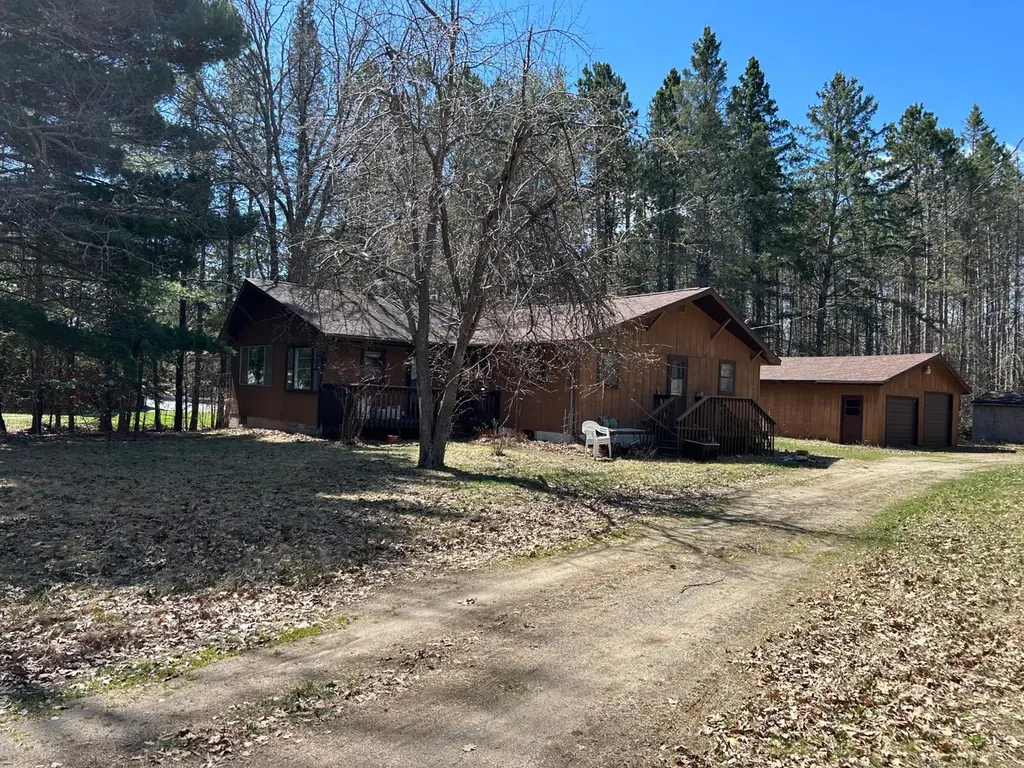
539 State 6 NE · Crooked Lake, MN
Flood risk 1/10 · Minimal
- FEMA flood zone
- —
- Chance of flooding over 30 yrs
- 0.0%
- Est. flood insurance / yr
- —
Fire risk 3/10 · Minor
- Est. fire insurance / yr
- $888 – $1,650
Heat risk 1/10 · Minimal
- Hot days now (above 93°F)
- 7 days/yr
- Hot days in 30 yrs
- 12 days/yr
Wind risk 1/10 · Minimal
- Chance of severe wind over 30 yrs
- —
Air-quality risk 1/10 · Minimal
- Unhealthy air days now
- 0 days/yr
- Unhealthy air days in 30 yrs
- 0 days/yr
Risk factors via First Street. Map © Google.
Why this score? — see what drove the D grade
The composite is a weighted blend of 9 inputs, each scored 0–100. Each bar is that input's sub-score; the figure is the points it added to the 100-point composite (weight × sub-score).
- Cash flow +11.7/30.0
- ARV discount +7.5/15.0
- Appreciation +7.3/10.0
- DSCR +3.4/10.0
- Schools +2.8/10.0
- Rent growth +2.5/5.0
- Livability +2.5/5.0
- Condition / age +2.5/5.0
- 1% rule +2.3/10.0
$175,000
🖨 Deal sheet (PDF) 📄 Offer letter ✓ Due diligence
Listing remarks
This is a great opportunity to fix up this home and make it your own while building Equity. A great private location close to numerous lakes and Prize ATV and snowmobile trails. This home is very spacious, and it is just waiting for your finishing touches. This Property is being sold "As Is". You really should see this property to appreciate the potential it has! Schedule your showing today!
Key facts
- 2 acre lot
- 2 garage spots
- Built 1970
Property features AI
Finance
- Other: Total living area listed as 1,534 square feet (main level finished area); Total building area approximately 3,068 square feet; Lot size approximately 2 acres
Exterior
- Parking: Attached or detached 2-car garage (26 x 24)
- Utilities: Well water; Private sewer with tank and drainage field; Electric service (Crow Wing Power)
- Home design: Residential property, one story; Entry/main living level is the main level
- Construction: Block foundation; Foundation dimensions approximately 26 x 41 x 44 x 26; Roof older than 8 years
- Exterior features: Wood exterior; Lot includes additional parcels; Road frontage on a state road; Publicly maintained road access; Lot dimensions approximately 200 x 470 x 200 x 475
Interior
- Kitchen: Kitchen on the main level (9 x 11)
- Bedrooms: Three bedrooms, all on the main level (sizes: 12 x 14; 12 x 11; 11 x 10)
- Bathrooms: Two three-quarter bathrooms
- Heating & cooling: Hot water heating; No central air
- Interior features: Den on the main level; Dining room on the main level; Living room on the main level; Partially finished basement with block foundation
- Laundry & utility: Basement utility space
Neighborhood map
What this means for you Summary
Snapshot
- This is a 3-bed/2.0-bath single-family listed at $175k.
Deal economics
- At list price, monthly cash flow is $-51 ($-607/yr) — negative.
- To cash-flow at today's rent, offer at most $166k (5.1% below list).
- To meet the 1% rule (rent ≥ 1% of price), the offer needs to be $129k (26.5% below list).
- Recommended offer: $129k (26.5% below list) — sets the bar for 1% rule.
Location & tenants
- Location reads: area grade D — affects rentability + tenant quality, not the cash-flow math above.
- Northland Community Schools (rural): math 25% / reading 35% proficiency, ranked #395 of 467 in MN (top 85%) — families likely to look elsewhere, expect single-tenant / working-renter base with shorter leases.
- Zoned schools: Northland Elementary (math 12% / reading 27%, grade F, #759 of 857 statewide, top 90%, 197 students, 81% FRL); Northland Secondary (math 15% / reading 27%, grade F, #416 of 471 statewide, top 88%, 157 students, 77% FRL) — zoned schools average 79% FRL vs 57% district-wide (23 pts higher); higher-poverty schools than district average — tighter screening recommended.
- Market conditions: 19 active listings in the ZIP; 285 units permitted in Cass County in 2024 (0 in 5+ unit buildings).
Forward outlook
- In year one you build about $9k of equity ($1k loan paydown + $8k appreciation (4.5% local appreciation)).
- Cass County population projected at -20% by 2050 — secular population decline; favor cash flow + early exit over multi-decade hold.
- At projected returns (4.5% appreciation + 3.0% rent growth), your $49k cash investment doubles in ~5 years — after that, you're playing with house money.
- By year 4, paydown + projected appreciation supports a ~$31k cash-out refi (75% LTV) — recoverable capital for the next deal without selling this one.
Negotiation context
- It's been on market 53 days — a 3% lower offer ($170k) is reasonable based on typical stale-listing flexibility.
- 3 sale attempts with the ask held roughly flat each time — persistent listings suggest the price (not the market) is what's stuck; bring a comps-based counter.
Questions for the listing agent
- What do current leases actually rent for vs. the listed asking? Can we see a recent rent roll and the last 12 months of T-12 income?
- It's been on market 53 days. Have you received any prior offers? Is the seller open to a 27% concession, seller financing, or rate buy-down credit?
- Built in 1970 — when were the roof, HVAC, electrical panel, plumbing, and water heater last replaced?
- Is there a deadline driving the sale (1031 exchange, divorce, estate, relocation)? That informs how much negotiation room exists.
- The area grade is low — what's the realistic commute time and amenity access for the typical tenant pool here? Any planned neighborhood developments (good or bad) we should know about?
- What's the average days-on-market for RENTAL listings here right now (not sales)? A rising rental-DOM trend means longer vacancies and softer asking-rent achievability than the comps imply.
- What's the recent tenant-quality profile in this submarket — average credit score on applications, eviction rate, late-payment / NSF rate, and stable-employment percentage? A property-management company in the area should have these aggregated.
- How much new for-sale + rental construction is in the pipeline within 1–3 miles? Heavy new supply typically softens prices + rents 12–24 months out; constrained supply supports both.
Investment metrics
- 1% rule
- 0.73% ✗
- Cap rate
- 5.95%
- Cash-on-cash
- -1.24%
- DSCR
- 0.94
- GRM
- 11.3
CMA / ARV
No comps found within radius.
Projected returns pro-forma
4.55% appreciation · 3.0% rent growth · sell at horizon
- IRR
- 10.6%
- Equity multiple
- 1.66×
- Total profit
- $32,531
- Equity at exit
- $94,371
- IRR
- 12.1%
- Equity multiple
- 3.11×
- Total profit
- $103,279
- Equity at exit
- $159,034
Cash invested: $49,000 (down + closing). Projections, not guarantees.
Landlord ↔ Tenant lean methodology
- Overall (STATE)
- 46 Balanced
- State Minnesota
- 46 Balanced · D+2
- County
- — inherits STATE
- City
- — inherits STATE
ZIP-level market 56662
- Home prices YoY
- 2.1%
- Active inventory
- 19
- Price-to-rent
- 11.3×
Monthly cashflow live
- Estimated rent
- $1,286 medium interval (Pro) →
- Mortgage (P&I)
- −$918
- Tax from tax record
- −$76 /mo · $912/yr
- Insurance
- −$73
- HOA
- −$0
- Vacancy / Maint / Mgmt
- −$270
- Net cashflow
- $-51
Break-even live
Sensitivity live
| Price | -10% $48 | -5% $-1 | +0% $-51 | +5% $-100 | +10% $-150 |
|---|---|---|---|---|---|
| Rent | -10% $-152 | -5% $-101 | +0% $-51 | +5% $0 | +10% $51 |
| Rate | -1.0pp $38 | -0.5pp $-6 | base $-51 | +0.5pp $-96 | +1.0pp $-142 |
UW: 25.0% down · 7.5% · 30yr · 1.5% tax · 5.0% vac · 8.0% maint · 8.0% mgmt
Financing live
Cash to close
- Down payment
- $43,750
- Closing costs
- $5,250
- Reserves months
- —
- Total cash needed
- —
Loan-product check · same deal, 3 products live
Conventional
25% down · 7.5% · 30yr
- Down + closing
- —
- Monthly P&I
- —
- Monthly cashflow
- —
- DSCR
- —
- Eligible?
- —
Personal DTI + credit; lowest rate.
DSCR
20% down · 8.5% · 30yr
- Down + closing
- —
- Monthly P&I
- —
- Monthly cashflow
- —
- DSCR
- —
- Eligible?
- —
No personal income docs; deal must DSCR.
Hard money
10% down · 12.0% · 12mo
- Down + closing
- —
- Monthly P&I
- —
- Monthly cashflow
- —
- DSCR
- —
- Eligible?
- —
Short-term bridge; refi at stabilization.
Listing history 23 events
-
2026-06-22days on market $175,000 Active 53 DOM
-
2026-06-21days on market $175,000 Active 52 DOM
-
2026-06-21days on market $175,000 Active 51 DOM
-
2026-06-18days on market $175,000 Active 49 DOM
-
2026-06-17days on market $175,000 Active 48 DOM
-
2026-06-16days on market $175,000 Active 47 DOM
-
2026-06-15days on market $175,000 Active 46 DOM
-
2026-06-13days on market $175,000 Active 44 DOM
-
2026-06-12days on market $175,000 Active 43 DOM
-
2026-06-09days on market $175,000 Active 40 DOM
-
2026-06-08days on market $175,000 Active 39 DOM
-
2026-06-07days on market $175,000 Active 38 DOM
-
2026-06-05days on market $175,000 Active 36 DOM
-
2026-06-04days on market $175,000 Active 34 DOM
-
2026-06-02days on market $175,000 Active 33 DOM
-
2026-06-01days on market $175,000 Active 32 DOM
-
2026-05-31days on market $175,000 Active 31 DOM
-
2026-05-31days on market $175,000 Active 30 DOM
-
2026-05-18status Active 407-char remark
-
2026-05-17historical Contingent - Inspection 407-char remark
-
2026-05-15status Active 407-char remark
-
2026-05-12historical Contingent - Inspection 407-char remark
-
2026-04-30$175,000 Active 407-char remark
ⓘ Source: listings_history table (triggers on properties + properties_extension) + one-shot
backfill from property_details.listing_events for pre-trigger history.
Tax reassessment forecast MN · Partial reset (capped growth)
- Current annual tax
- $912 · $76/mo
- Projected year-2 tax
- $1,436 · $120/mo
- Expected delta
- +$524/yr (+$44/mo · 57.5%)
ⓘ Screening estimate from a state-policy table — verify with the county assessor before closing.
Climate risk First Street
- Flood 1/10 Low 0% chance over 30 yrs
- Wildfire 3/10 Moderate
- Heat 1/10 Low 7 d/yr ≥93°F today · 12 d/yr by 30 yrs out
- Wind 1/10 Low
- Air quality 1/10 Low 0 unhealthy d/yr today · 0 by 30 yrs out
Nearby sold comps map
Loading sold comps map…
Walkable amenities ~0.75 mi
Loading nearby amenities…
Taxation est. · year 1
- Rental income
- $15,433
- − Mortgage interest
- −$9,803
- − Property taxes
- −$912
- − Insurance
- −$875
- − Repairs & maintenance
- −$1,235
- − Management
- −$1,235
- − Depreciation
- −$5,091
- Taxable loss
- −$3,717
- Est. tax savings @ 24.0%
- +$892
- After-tax cash flow
- $285/yr
For passive investors: Depreciation is non-cash, so a rental often shows a tax loss while cash-flowing — sheltering income. Rental losses are passive: they offset passive income freely, and up to $25,000/yr can offset ordinary (W-2) income if you actively participate and your MAGI is under $100k (phasing out to $0 by $150k); unused losses carry forward. On sale, claimed depreciation is recaptured at up to 25%, and gains may owe capital-gains tax (a 1031 exchange can defer both). Figures are a year-1 estimate at your 24.0% rate — not tax advice; consult a CPA.
Schools (NCES district)
- District
- Northland Community Schools
- NCES district ID
- 2730870
- Math proficiency
- 25% ▼ -5.00%
- Reading proficiency
- 35% ▼ -5.00%
- Median HH income
- $40,741
- Composite
- 28.13/100
- National rank
- #12208
- State rank
- #395 of 467 in MN
Livability — Crooked Lake
No livability data for this city. (Only ~50 U.S. cities are tracked.)
Census & demographics
- Population (ZIP)
- 574
Population outlook (Cass County) Hauer SSP2
- Today (2025)
- 27,371 people
- By 2030
- 26,311 · -3.9%
- By 2040
- 23,945 · -12.5%
- By 2050
- 21,889 · -20.0%
- By 2075
- 18,435 · -32.6%
- By 2100
- 14,478 · -47.1%
Race, ethnicity, and origin ACS 2023
- Neighborhood character
- Predominantly White (92%)
- Race & ethnicity
- White 92% Two or more races 4% Black 1% Asian 1%
- Common ancestry
- Portuguese 18% Romanian 6% Lithuanian 4%
- Foreign-born
- 2% · Canada
Political lean MEDSL · Cass
- 2024 margin
- Solid R (+33.4) · D 32.6% · R 66.0% · Other 1.3%
- 2008→2024 swing
- -24.9pp toward R · 2008: -8.5pp · 2024: -33.4pp
- All cycles
- 2024: R+33.4 2020: R+28.9 2016: R+31.7 2012: R+13.1 2008: R+8.5
Not yet ingested
- Civics
- —
Market trends
- HPI YoY
- ▲ 4.55%
- Current HPI
- 219.4699
- Rent YoY
- —
- Metro
- —
- State GDP YoY
- ▲ 2.41%
- F500 in state
- 34
Industry mix (Fortune 500 HQ in MN)
| Industry | F500 HQs | Revenue |
|---|---|---|
| Healthcare | 2 | $407B |
|
||
| Retail | 2 | $150B |
|
||
| Consumer Goods | 2 | $32B |
|
||
| Industrial Machinery | 2 | $6B |
|
||
| Agriculture | 1 | $40B |
|
||
| Healthcare / Medical Devices | 1 | $32B |
|
||
Price history
5 events — show timeline
- 2026-05-18 Relisted — NORTHSTARMLS as Distributed by MLS Grid
- 2026-05-17 Contingent — NORTHSTARMLS as Distributed by MLS Grid
- 2026-05-15 Relisted — NORTHSTARMLS as Distributed by MLS Grid
- 2026-05-12 Contingent — NORTHSTARMLS as Distributed by MLS Grid
- 2026-04-30 Listed $175,000 NORTHSTARMLS as Distributed by MLS Grid
Property tax history
+3.6%/yrLatest (2026): $912 · +0.7% YoY. Source: county tax records.
Cash-flow waterfall
monthlySold comps — $/sqft
last 12 mo · ≤1 miLoading sold comps…