 Duplex
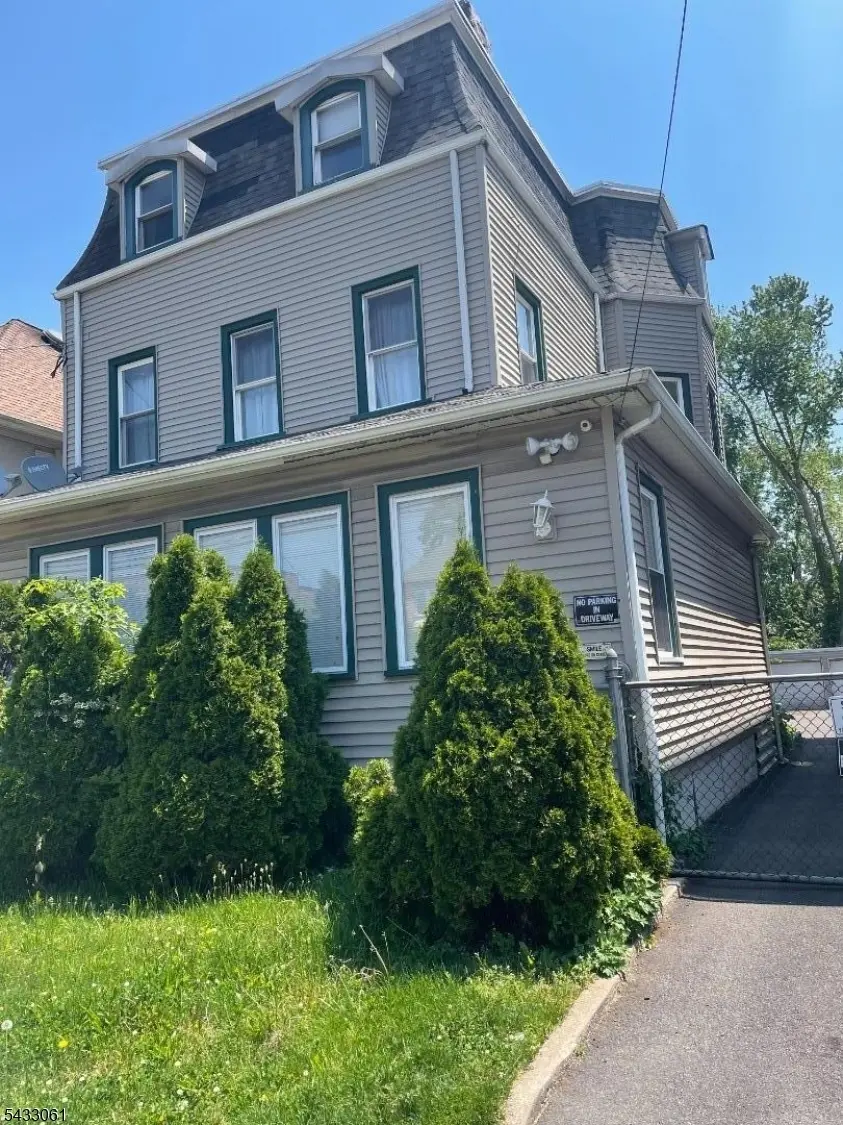
218 Orchard St · Elizabeth, NJ
Flood risk 1/10 · Minimal
- FEMA flood zone
- X (unshaded)
- Chance of flooding over 30 yrs
- 0.0%
- Est. flood insurance / yr
- $507 – $1,088
Fire risk 1/10 · Minimal
- Est. fire insurance / yr
- $526 – $976
Heat risk 7/10 · Major
- Hot days now (above 101°F)
- 7 days/yr
- Hot days in 30 yrs
- 15 days/yr
Wind risk 6/10 · Moderate
- Chance of severe wind over 30 yrs
- 27.0%
Air-quality risk 4/10 · Minor
- Unhealthy air days now
- 4 days/yr
- Unhealthy air days in 30 yrs
- 5 days/yr
Risk factors via First Street. Map © Google.
Why this score? — see what drove the D grade
The composite is a weighted blend of 9 inputs, each scored 0–100. Each bar is that input's sub-score; the figure is the points it added to the 100-point composite (weight × sub-score).
- Cash flow +11.2/30.0
- ARV discount +7.5/15.0
- Appreciation +5.0/10.0
- Livability +3.5/5.0
- 1% rule +3.3/10.0
- DSCR +3.3/10.0
- Rent growth +2.5/5.0
- Condition / age +2.2/5.0
- Schools +1.8/10.0
$729,900
🖨 Deal sheet 📄 Offer letter ✓ Due diligence
Multi-family units
County records classify this as Multi-Family (2-4 Unit). Listing-text estimate: 2 units. confirmed
Listing remarks
TWO FAMILY HOME WITH GARAGE AND DRIVEWAY, SECOND FLOOR HAS THE USE OF THE ATTIC EXTRA SPACE FOR STORAGE. A MUST TO SEE , NEAR KEAN UNIVERSITY, CLOSE TO TRAIN AND MAJOR ROUTES AND OTHER PUBLIC TRANSPORTATION. AN EXCELLENT OPPORTUNITY FOR BOTH AND OWNER OCCUPANTS. NEED
Key facts
- Near kean university
- Garage
- Driveway
Tags
Property features AI
Finance
- Other: Contact listing broker DEL CID REALTY LLC for more information
- Financial info: Property is a 2-unit building; Reported gross and net operating income and expenses are provided (detailed figures available in listing)
Exterior
- Parking: Six parking spaces total; Three-car garage (detached); Driveway with single-car width plus additional parking
- Utilities: Public water; Public sewer available; association sewer; Natural gas available in street
- Home design: Two-story unit style; Green exterior color
- Construction: Aluminum siding construction; Asphalt shingle roof
- Exterior features: Metal fence; Aluminum siding; Asphalt shingle roof
Interior
- Kitchen: Unit 1: Eat-in kitchen with gas range/oven; Unit 2: Eat-in kitchen with gas range/oven
- Bedrooms: Unit 1: 2 bedrooms; Unit 2: 1 bedroom; Attic listed as an additional room
- Bathrooms: Four full bathrooms total; Unit 1: 1 bathroom; Unit 2: 1 bathroom
- Heating & cooling: Two heating units with baseboard (cast iron) heat; Natural gas heating; Two cooling units with wall A/C
- Interior features: Carbon monoxide detector; Smoke detectors; Fire extinguisher; Gas water heater; Finished walkout basement
- Laundry & utility: Owner pays heat and gas for Unit 1; Owner pays electric for Unit 1; Owner pays water for Unit 1; Owner pays water for Unit 2; Tenant pays electric, gas, and heat for Unit 2
Neighborhood map
What this means for you Summary
Snapshot
- This is a 2 × 4-bed/2.0-bath units multifamily listed at $730k. Condition is rated fair.
Deal economics
- At list price, monthly cash flow is $-283 ($-3k/yr) — negative. Per door: $-141/mo.
- To cash-flow at today's rent, offer at most $689k (5.6% below list).
- To meet the 1% rule (rent ≥ 1% of price), the offer needs to be $603k (17.4% below list).
- Recommended offer: $603k (17.4% below list) — sets the bar for 1% rule.
- Cap rate 5.8% vs local median 2.4% in Elizabeth — top-decile yield for the area; either an underpriced asset or a hidden risk that comps aren't pricing in. Stress-test before assuming the spread holds.
Location & tenants
- Location reads 69/100 on livability (#277 in NJ) — a middle-class / working-renter tenant base. Strengths: commute A+, health & safety B+; Watch: amenities D+, schools D-, crime D-.
- Elizabeth Public Schools (suburban): math 9% / reading 33% proficiency, ranked #430 of 472 in NJ (top 91%) — low school quality limits family demand, transient renter base, plan for 1-2y turnover; 74% free/reduced lunch — lower-income household profile, screen leases tightly.
- Market conditions: 1 active listings in the ZIP; 1,749 units permitted in Union County in 2024 (1,421 in 5+ unit buildings).
Forward outlook
- In year one you build about $27k of equity ($5k loan paydown + $22k appreciation (3.0% local appreciation)).
- Union County population projected at +17% by 2050 — long-run rental-demand tailwind backs the buy-and-hold thesis.
- By year 2, paydown + projected appreciation supports a ~$44k cash-out refi (75% LTV) — recoverable capital for the next deal without selling this one.
Negotiation context
- It's been on market 26 days — a 2% lower offer ($719k) is reasonable based on typical stale-listing flexibility.
- 2 sale attempts since 9y ago with the ask held roughly flat each time — persistent listings suggest the price (not the market) is what's stuck; bring a comps-based counter.
- Current owner paid $271k; list at $730k implies a 169% gain — meaningful room to come down on a strong offer.
Risks & watch-outs
- Climate carrying-cost: major wind risk, 27% chance of damaging wind over 30y; extreme-heat days projected 7→15/yr by 2055 (HVAC capex compounding) — expect insurance premiums to compound above CPI over the hold.
Questions for the listing agent
- What do current leases actually rent for vs. the listed asking? Can we see a recent rent roll and the last 12 months of T-12 income?
- Can we see the unit-by-unit rent roll, current vacancy, and any below-market leases? What's the average tenancy length?
- What capital expenditures (roof, boiler, parking lot, exteriors) have been made in the last 5 years, and what's planned in the next 2?
- Have any recent inspections been done? Can we get a copy of the seller's disclosures and any deferred-maintenance estimates?
- Is there a deadline driving the sale (1031 exchange, divorce, estate, relocation)? That informs how much negotiation room exists.
- Schools are D-rated, which usually means shorter tenancies and higher turnover. Who's the typical renter profile here, and what's been the actual vacancy rate?
- Crime grade is D in this area — have there been break-ins, vandalism, or insurance claims at this property in the last 3 years? What carrier currently insures it and at what premium?
- The area grade is low — what's the realistic commute time and amenity access for the typical tenant pool here? Any planned neighborhood developments (good or bad) we should know about?
- What's the average days-on-market for RENTAL listings here right now (not sales)? A rising rental-DOM trend means longer vacancies and softer asking-rent achievability than the comps imply.
- What's the recent tenant-quality profile in this submarket — average credit score on applications, eviction rate, late-payment / NSF rate, and stable-employment percentage? A property-management company in the area should have these aggregated.
- How much new apartment / multifamily construction is in the pipeline within 1–3 miles? Heavy new supply (>2% of stock underway) typically softens rents 12–24 months out; light construction supports rent growth.
Investment metrics
- 1% rule
- 0.83% ✗
- Cap rate
- 5.83%
- Cash-on-cash
- -1.66%
- DSCR
- 0.93
- GRM
- 10.1
CMA / ARV
No comps found within radius.
Projected returns pro-forma
3.0% appreciation · 3.0% rent growth · sell at horizon
- IRR
- 6.0%
- Equity multiple
- 1.34×
- Total profit
- $70,004
- Equity at exit
- $328,195
- IRR
- 8.9%
- Equity multiple
- 2.34×
- Total profit
- $274,691
- Equity at exit
- $505,787
Cash invested: $204,372 (down + closing). Projections, not guarantees.
Landlord ↔ Tenant lean methodology
- Overall (STATE)
- 21 Tenant-Leaning
- State New Jersey
- 21 Tenant-Leaning · D+6
- County
- — inherits STATE
- City
- — inherits STATE
ZIP-level market 07208-1649
- Active inventory
- 1
- Price-to-rent
- 20.2×
Monthly cashflow live
- Estimated rent
- $6,027 medium interval (Pro) →
- Mortgage (P&I)
- −$3,828
- Tax est. 1.5%
- −$912 /mo · $10,948/yr
- Insurance
- −$304
- HOA
- −$0
- Vacancy / Maint / Mgmt
- −$1,266
- Net cashflow
- $-283
Break-even live
2-unit breakdown (identical units grouped — click to expand)
| Units | Beds | Baths | Est. rent |
|---|---|---|---|
| 2× units | 4 | 2 | $6,028 |
| #1 | 4 | 2 | $3,014 |
| #2 | 4 | 2 | $3,014 |
| Total (2 units) | $6,027 | ||
UW: 25.0% down · 7.5% · 30yr · 1.5% tax · 5.0% vac · 8.0% maint · 8.0% mgmt
Financing live
Cash to close
- Down payment
- $182,475
- Closing costs
- $21,897
- Reserves months
- —
- Total cash needed
- —
Loan-product check · same deal, 3 products live
Conventional
25% down · 7.5% · 30yr
- Down + closing
- —
- Monthly P&I
- —
- Monthly cashflow
- —
- DSCR
- —
- Eligible?
- —
Personal DTI + credit; lowest rate.
DSCR
20% down · 8.5% · 30yr
- Down + closing
- —
- Monthly P&I
- —
- Monthly cashflow
- —
- DSCR
- —
- Eligible?
- —
No personal income docs; deal must DSCR.
Hard money
10% down · 12.0% · 12mo
- Down + closing
- —
- Monthly P&I
- —
- Monthly cashflow
- —
- DSCR
- —
- Eligible?
- —
Short-term bridge; refi at stabilization.
Listing history 16 events
-
2026-06-15status $729,900 Under Contract 26 DOM
-
2026-06-15days on market $729,900 Active 26 DOM
-
2026-06-13days on market $729,900 Active 24 DOM
-
2026-06-13days on market $729,900 Active 23 DOM
-
2026-06-09days on market $729,900 Active 20 DOM
-
2026-06-08days on market $729,900 Active 19 DOM
-
2026-06-07days on market $729,900 Active 18 DOM
-
2026-06-04days on market $729,900 Active 15 DOM
-
2026-06-03days on market $729,900 Active 14 DOM
-
2026-06-02days on market $729,900 Active 13 DOM
-
2026-06-01days on market $729,900 Active 12 DOM
-
2026-05-31days on market $729,900 Active 11 DOM
-
2026-05-20$729,900 Active
-
2017-05-25soldstatus $271,000 Sold
-
2017-01-28historical
-
2017-01-12$264,900 Active
ⓘ Source: listings_history table (triggers on properties + properties_extension) + one-shot
backfill from property_details.listing_events for pre-trigger history.
Climate risk First Street
- Flood 1/10 Low FEMA zone X (unshaded) · 0% chance over 30 yrs
- Wildfire 1/10 Low
- Heat 7/10 Severe 7 d/yr ≥101°F today · 15 d/yr by 30 yrs out
- Wind 6/10 Major 27% chance of damaging wind over 30 yrs
- Air quality 4/10 Moderate 4 unhealthy d/yr today · 5 by 30 yrs out
Nearby sold comps map
Loading sold comps map…
Walkable amenities ~0.75 mi
Loading nearby amenities…
Taxation est. · year 1
- Rental income
- $72,324
- − Mortgage interest
- −$40,886
- − Property taxes
- −$10,948
- − Insurance
- −$3,650
- − Repairs & maintenance
- −$5,786
- − Management
- −$5,786
- − Depreciation
- −$21,233
- Taxable loss
- −$15,965
- Est. tax savings @ 24.0%
- +$3,832
- After-tax cash flow
- $437/yr
For passive investors: Depreciation is non-cash, so a rental often shows a tax loss while cash-flowing — sheltering income. Rental losses are passive: they offset passive income freely, and up to $25,000/yr can offset ordinary (W-2) income if you actively participate and your MAGI is under $100k (phasing out to $0 by $150k); unused losses carry forward. On sale, claimed depreciation is recaptured at up to 25%, and gains may owe capital-gains tax (a 1031 exchange can defer both). Figures are a year-1 estimate at your 24.0% rate — not tax advice; consult a CPA.
Condition & rehab AI · 4 photos
A moderate rehab project is needed to improve the exterior and increase the home's value.
Repairs flagged
- Moderate siding — Weathered and discolored
- Moderate exterior paint — Needs touch-up
Value-add opportunities
- Both Paint exterior and trim — Enhances curb appeal and value
- Both Landscaping — Improves curb appeal and value
- Both Replace siding — Significant improvement in appearance and value
Renovation cost estimate screening
| Repair item | Severity | Est. cost |
|---|---|---|
| siding · Weathered and discolored | Moderate | $3,000–15,000 |
| exterior paint · Needs touch-up | Moderate | $3,000–15,000 |
| Total estimated repair cost · 2 items | $6,000–30,000 |
Value-add ROI direction
- Both Paint exterior and trim — Enhances curb appeal and value ↑
- Both Landscaping — Improves curb appeal and value ↑
- Both Replace siding — Significant improvement in appearance and value ↑
ⓘ Cost ranges are severity-bucket heuristics (US national rule-of-thumb). Get contractor quotes + a written scope before underwriting a rehab budget.
Schools (NCES district)
- District
- Elizabeth Public Schools
- NCES district ID
- 3404590
- Math proficiency
- 9% ▼ -17.00%
- Reading proficiency
- 33% ▼ -19.00%
- Median HH income
- $43,785
- Composite
- 18.05/100
- National rank
- #8979
- State rank
- #430 of 472 in NJ
Livability — Elizabeth
- Score
- 69/100
- State rank
- #277
- US rank
- #8270
Category grades
Schools grade is shown separately in the Schools card above.
Census & demographics
- Census place
- Elizabeth, NJ
Population outlook (Union County) Hauer SSP2
- Today (2025)
- 596,450 people
- By 2030
- 616,880 · +3.4%
- By 2040
- 658,185 · +10.4%
- By 2050
- 696,707 · +16.8%
- By 2075
- 785,448 · +31.7%
- By 2100
- 836,583 · +40.3%
Not yet ingested
- Political lean
- —
- Race & ethnicity
- —
- Common origin
- —
- Civics
- —
Market trends
- HPI YoY
- —
- Current HPI
- —
- Rent YoY
- —
- Metro
- —
- State GDP YoY
- ▲ 2.05%
- F500 in state
- 34
Industry mix (Fortune 500 HQ in NJ)
| Industry | F500 HQs | Revenue |
|---|---|---|
| Consumer Goods | 3 | $31B |
|
||
| Pharmaceuticals | 2 | $153B |
|
||
| Technology | 2 | $21B |
|
||
| Insurance | 2 | $20B |
|
||
| Healthcare | 2 | $19B |
|
||
| Financial Services | 1 | $70B |
|
||
Price history
+175.5% since first listed4 events — show timeline
- 2026-05-20 Listed $729,900 GSMLS
- 2017-05-25 Sold (MLS) $271,000 GSMLS
- 2017-01-28 Delisted — GSMLS
- 2017-01-12 Listed $264,900 GSMLS
Cash-flow waterfall
monthlySold comps — $/sqft
last 12 mo · ≤1 miLoading sold comps…