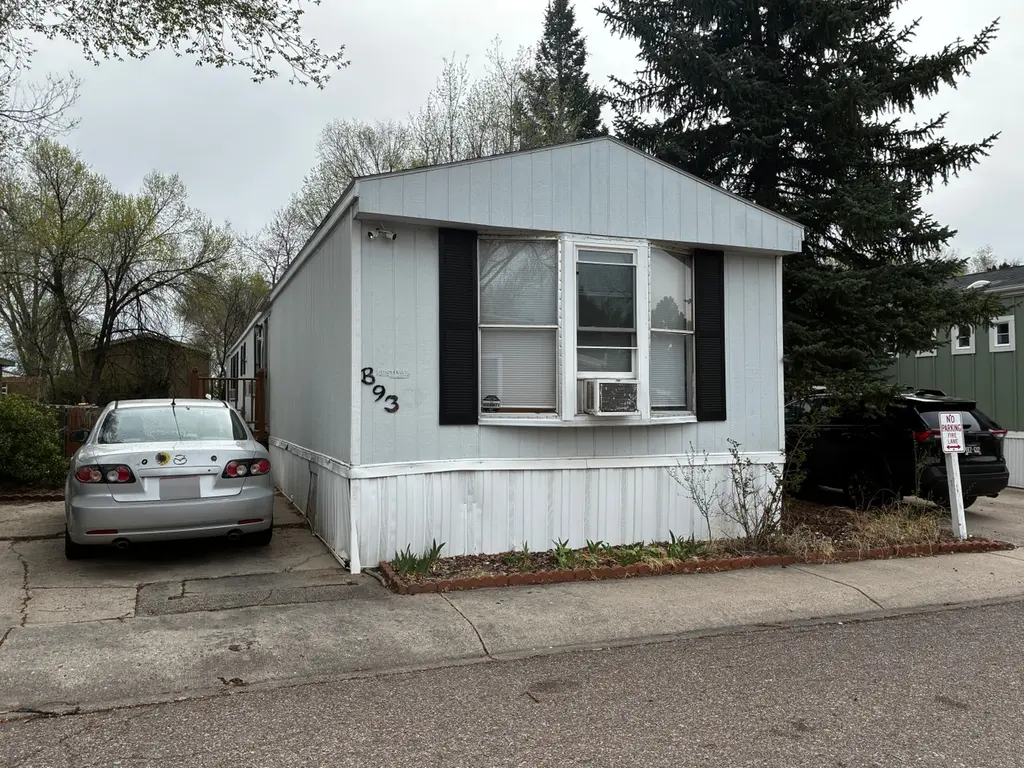
5150 Airport Rd Unit B93 · Colorado Springs, CO
Flood risk 1/10 · Minimal
- FEMA flood zone
- X (unshaded)
- Chance of flooding over 30 yrs
- 0.0%
- Est. flood insurance / yr
- $507 – $1,088
Fire risk 2/10 · Minimal
- Est. fire insurance / yr
- $939 – $1,743
Heat risk 2/10 · Minimal
- Hot days now (above 89°F)
- 6 days/yr
- Hot days in 30 yrs
- 15 days/yr
Wind risk 2/10 · Minimal
- Chance of severe wind over 30 yrs
- —
Air-quality risk 1/10 · Minimal
- Unhealthy air days now
- 0 days/yr
- Unhealthy air days in 30 yrs
- 0 days/yr
Risk factors via First Street. Map © Google.
Why this score? — see what drove the B- grade
The composite is a weighted blend of 9 inputs, each scored 0–100. Each bar is that input's sub-score; the figure is the points it added to the 100-point composite (weight × sub-score).
- Cash flow +30.0/30.0
- 1% rule +10.0/10.0
- DSCR +10.0/10.0
- ARV discount +7.5/15.0
- Livability +3.9/5.0
- Rent growth +3.1/5.0
- Schools +2.5/10.0
- Condition / age +2.5/5.0
- Appreciation +0.0/10.0
$64,000
🖨 Deal sheet 📄 Offer letter ✓ Due diligence
Listing remarks
* THIS IS A RESALE LISTING * This welcoming, well-maintained 3 bedroom, 2 bathroom home is a perfect place to raise your family. For your convenience, we have onsite community management to assist you when you need it. With our family-friendly community amenities such as a basketball court, a playground, and a swimming pool, your family will be excited to live here. This home won't be on the market long, so call us today for more information or to schedule a tour. Deposits & Fees are subject to change.
Key facts
- Swimming pool
- Basketball court
- Playground
Tags
Property features AI
Finance
- Financial info: List price $64,000
Exterior
- Utilities: Natural gas available
- Home design: Spec home, plan 93896
- Exterior features: Located at 5150 Airport Rd Unit B93, Colorado Springs, CO
Interior
- Bedrooms: 3 bedrooms
- Bathrooms: 2 bathrooms (both full)
- Heating & cooling: Natural gas heating
- Interior features: Active status listing
Neighborhood map
What this means for you Summary
Snapshot
- This is a 3-bed/2.0-bath manufactured listed at $64k.
Deal economics
- At list price, monthly cash flow is $1k ($12k/yr) — positive.
- The deal already cash-flows at list — no discount required.
- Meets the 1% rule at list price ($2k rent vs $64k).
- Recommended offer: $62k (3.0% below list) — sets the bar for market timing.
- Cap rate 25.3% vs local median 3.3% in Colorado Springs — top-decile yield for the area; either an underpriced asset or a hidden risk that comps aren't pricing in. Stress-test before assuming the spread holds.
Location & tenants
- Location reads 78/100 on livability (#23 in CO, #2,639 nationally) — a middle-class / working-renter tenant base. Strengths: amenities A+, housing A+, health & safety A+; Watch: cost of living C-, crime F.
- Colorado Springs School District No. 11 In The County Of E (urban): math 20% / reading 37% proficiency, ranked #56 of 86 in CO (top 65%) — low school quality limits family demand, transient renter base, plan for 1-2y turnover.
- Market conditions: Rents rising (+2.4%/yr); 183 active listings in the ZIP; 40 comparable units currently listed for rent nearby; rentals leasing fast (median 3d on market — plan ~1-2 weeks tenant-placement turnaround); 3,906 units permitted in El Paso County in 2024 (872 in 5+ unit buildings).
- This rent runs 33% of the median local income ($67k/yr) — at the standard rent-burdened threshold; future hikes will face affordability resistance.
Forward outlook
- Local home prices are declining (-3.0%/yr); year-one equity from $442 of loan paydown is wiped out by about $2k of value loss. Plan a longer hold.
- El Paso County population projected at +28% by 2050 — long-run rental-demand tailwind backs the buy-and-hold thesis.
- At projected returns (-3.0% appreciation + 2.4% rent growth), your $18k cash investment doubles in ~2 years — after that, you're playing with house money.
Negotiation context
- It's been on market 45 days — a 3% lower offer ($62k) is reasonable based on typical stale-listing flexibility.
Questions for the listing agent
- It's been on market 45 days. Have you received any prior offers? Is the seller open to a 3% concession, seller financing, or rate buy-down credit?
- Is there a deadline driving the sale (1031 exchange, divorce, estate, relocation)? That informs how much negotiation room exists.
- Schools are B-rated — typically a magnet for longer-tenancy family renters. What's the average tenant stay here, and is there a school-zone premium baked into asking?
- Crime grade is F in this area — have there been break-ins, vandalism, or insurance claims at this property in the last 3 years? What carrier currently insures it and at what premium?
- What's the average days-on-market for RENTAL listings here right now (not sales)? A rising rental-DOM trend means longer vacancies and softer asking-rent achievability than the comps imply.
- What's the recent tenant-quality profile in this submarket — average credit score on applications, eviction rate, late-payment / NSF rate, and stable-employment percentage? A property-management company in the area should have these aggregated.
- How much new for-sale + rental construction is in the pipeline within 1–3 miles? Heavy new supply typically softens prices + rents 12–24 months out; constrained supply supports both.
Investment metrics
- 1% rule
- 2.88% ✓
- Cap rate
- 25.35%
- Cash-on-cash
- 68.05%
- DSCR
- 4.03
- GRM
- 2.9
CMA / ARV
No comps found within radius.
Projected returns pro-forma
-3.0% appreciation · 2.36% rent growth · sell at horizon
- IRR
- 66.7%
- Equity multiple
- 3.97×
- Total profit
- $53,197
- Equity at exit
- $9,543
- IRR
- 70.8%
- Equity multiple
- 7.97×
- Total profit
- $124,989
- Equity at exit
- $5,534
Cash invested: $17,920 (down + closing). Projections, not guarantees.
Landlord ↔ Tenant lean methodology
- Overall (STATE)
- 38 Tenant-Leaning
- State Colorado
- 38 Tenant-Leaning · D+4
- County
- — inherits STATE
- City
- — inherits STATE
ZIP-level market 80916
- Home prices YoY
- -27.6%
- Rents YoY
- 2.4%
- Active inventory
- 183
- Price-to-rent
- 2.9×
Monthly cashflow live
- Estimated rent
- $1,846 high interval (Pro) →
- Mortgage (P&I)
- −$336
- Tax est. 1.5%
- −$80 /mo · $960/yr
- Insurance
- −$27
- HOA
- −$0
- Vacancy / Maint / Mgmt
- −$388
- Net cashflow
- $1,016
Break-even live
UW: 25.0% down · 7.5% · 30yr · 1.5% tax · 5.0% vac · 8.0% maint · 8.0% mgmt
Financing live
Cash to close
- Down payment
- $16,000
- Closing costs
- $1,920
- Reserves months
- —
- Total cash needed
- —
Loan-product check · same deal, 3 products live
Conventional
25% down · 7.5% · 30yr
- Down + closing
- —
- Monthly P&I
- —
- Monthly cashflow
- —
- DSCR
- —
- Eligible?
- —
Personal DTI + credit; lowest rate.
DSCR
20% down · 8.5% · 30yr
- Down + closing
- —
- Monthly P&I
- —
- Monthly cashflow
- —
- DSCR
- —
- Eligible?
- —
No personal income docs; deal must DSCR.
Hard money
10% down · 12.0% · 12mo
- Down + closing
- —
- Monthly P&I
- —
- Monthly cashflow
- —
- DSCR
- —
- Eligible?
- —
Short-term bridge; refi at stabilization.
Rent comps 40 comps
| Address | Beds | Baths | Sqft | Rent | $/sqft | DOM | Units | Dist |
|---|---|---|---|---|---|---|---|---|
| 315 Ellers Grv Colorado Springs, CO | 3.0 | 2.0 | 1357 | $1,869 | $1.38 | 23d | 1 | 0.23mi |
| 299 Ellers Grv Colorado Springs, CO | 2.0 | 2.0 | 1005 | $1,667 | $1.66 | 23d | 1 | 0.23mi |
| 4961 Leland Pt Colorado Springs, CO | 2.0 | 2.0 | 1177 | $1,495 | $1.27 | 14d | 1 | 0.28mi |
| 4919 Leland Pt Colorado Springs, CO | 3.0 | 2.0 | 1357 | $1,600 | $1.18 | 23d | 1 | 0.33mi |
| 4802 Checkerspot St Colorado Springs, CO | 3.0–5.0 | 2.0–3.0 | 1853 | $2,369 | $1.28 | 3d | 10 | 0.63mi |
| 991 Ibsen Vw Colorado Springs, CO | 2.0 | 1.0–2.0 | 630 | $1,599 | $2.54 | 2d | 13 | 0.67mi |
| 1046 Nolte Dr W Colorado Springs, CO | 3.0 | 2.0 | 1450 | $2,149 | $1.48 | 2d | 1 | 0.78mi |
| 351 Gahart Dr Apt D Colorado Springs, CO | 2.0 | 1.0 | 806 | $1,295 | $1.61 | 23d | 1 | 0.85mi |
| 349 Gahart Dr Colorado Springs, CO | 2.0 | 1.0 | 884 | $1,162 | $1.31 | 23d | 1 | 0.86mi |
| 4445 E Pikes Peak Ave Colorado Springs, CO | 2.0 | 1.0 | 950 | $1,214 | $1.28 | 3d | 1 | 0.92mi |
| 4457 E Pikes Peak Ave Colorado Springs, CO | 2.0 | 1.0 | 950 | $1,214 | $1.28 | 3d | 1 | 0.92mi |
| 175 N Murray Blvd Colorado Springs, CO | 1.0–2.0 | 1.0–2.0 | 773 | $1,539 | $1.99 | 3d | 7 | 0.94mi |
| 330 Vehr Dr Unit 1 Colorado Springs, CO | 2.0 | 1.0 | 850 | $1,500 | $1.76 | 23d | 1 | 0.97mi |
| 330 Vehr Dr Unit 2 Colorado Springs, CO | 2.0 | 1.0 | 709 | $1,000 | $1.41 | 23d | 1 | 0.97mi |
| 350 Vehr Dr Unit 3 Colorado Springs, CO | 2.0 | 1.0 | 787 | $955 | $1.21 | 3d | 1 | 0.97mi |
| 9520 Antora GRV Colorado Springs, CO | 1.0–3.0 | 1.0–2.5 | 1017 | $2,789 | $2.74 | 3d | 41 | 1.06mi |
| 4370 E Pikes Peak Ave Colorado Springs, CO | 1.0–2.0 | 1.0 | 625 | $1,536 | $2.46 | 3d | 12 | 1.09mi |
| 255 Lionstone Dr Colorado Springs, CO | 1.0–2.0 | 1.0–2.0 | 755 | $1,802 | $2.39 | 3d | 14 | 1.10mi |
| 705 Grissom Dr Colorado Springs, CO | 3.0 | 2.5 | 1360 | $2,139 | $1.57 | 23d | 1 | 1.12mi |
| 5550 Cernan Hts Colorado Springs, CO | 1.0–3.0 | 1.0–2.0 | 892 | $2,225 | $2.49 | 3d | 19 | 1.13mi |
| 240 N Murray Blvd Colorado Springs, CO | 1.0–2.0 | 1.0 | 777 | $1,196 | $1.54 | 14d | 17 | 1.13mi |
| 4255 Airport Rd Colorado Springs, CO | 1.0–2.0 | 1.0 | 785 | $1,050 | $1.34 | 2d | 15 | 1.15mi |
| 5704 Ella Vw Unit 1-428 Colorado Springs, CO | 2.0 | 2.0 | 1052 | $2,577 | $2.45 | 21d | 1 | 1.17mi |
| 5704 Ella Vw Unit 1-328 Colorado Springs, CO | 2.0 | 2.0 | 1052 | $2,512 | $2.39 | 21d | 1 | 1.17mi |
| 5704 Ella Vw Unit 1-426 Colorado Springs, CO | 2.0 | 2.0 | 1052 | $2,537 | $2.41 | 21d | 1 | 1.17mi |
| 4165 Lacy Ln Colorado Springs, CO | 1.0–2.0 | 1.0–2.0 | 750 | $1,480 | $1.97 | 2d | 10 | 1.18mi |
| 4710 Spacewalk Way Colorado Springs, CO | 2.0 | 2.0 | 1068 | $2,049 | $1.92 | 2d | 1 | 1.18mi |
| 4215 E Pikes Peak Ave Colorado Springs, CO | 2.0–3.0 | 1.0–1.5 | 1541 | $2,373 | $1.54 | 3d | 7 | 1.19mi |
| 4275 Sanders Vw Colorado Springs, CO | 1.0–3.0 | 1.0–2.0 | 932 | $3,006 | $3.23 | 2d | 27 | 1.21mi |
| 1210 Firefly Cir Colorado Springs, CO | 2.0 | 1.0 | 940 | $1,143 | $1.22 | 23d | 1 | 1.22mi |
| 1334 Firefly Cir Colorado Springs, CO | 2.0 | 2.5 | 1300 | $1,700 | $1.31 | 14d | 1 | 1.24mi |
| 4060 Airport Rd Unit 4 Colorado Springs, CO | 2.0 | 1.0 | 752 | $1,050 | $1.40 | 23d | 1 | 1.24mi |
| 5704 Ella VW Colorado Springs, CO | 2.0 | 2.0 | 1052 | $2,910 | $2.77 | 23d | 1 | 1.24mi |
| 5704 Ella VW Colorado Springs, CO | 1.0–3.0 | 1.0–3.0 | 1107 | $2,961 | $2.67 | 3d | 177 | 1.24mi |
| 4536 Samaritan Loop Colorado Springs, CO | 2.0 | 1.5 | 1108 | $2,200 | $1.99 | 23d | 1 | 1.25mi |
| 4202 E Pikes Peak Ave Colorado Springs, CO | 1.0–2.0 | 1.0 | 760 | $1,099 | $1.45 | 3d | 5 | 1.26mi |
| 4020 Ruskin Way Unit 2 Colorado Springs, CO | 2.0 | 1.0 | 750 | $925 | $1.23 | 3d | 1 | 1.30mi |
| 897 Grissom Dr Colorado Springs, CO | 2.0 | 2.5 | 1150 | $2,400 | $2.09 | 23d | 1 | 1.30mi |
| 830 Cana Grv Colorado Springs, CO | 2.0 | 1.0–2.0 | 605 | $1,599 | $2.64 | 2d | 16 | 1.31mi |
| 1432 Sandalwood Dr Colorado Springs, CO | 1.0–2.0 | 1.0–2.0 | 742 | $1,356 | $1.83 | 2d | 24 | 1.31mi |
Listing history 14 events
-
2026-06-18days on market $64,000 Active 45 DOM
-
2026-06-17days on market $64,000 Active 44 DOM
-
2026-06-16days on market $64,000 Active 43 DOM
-
2026-06-15days on market $64,000 Active 42 DOM
-
2026-06-14days on market $64,000 Active 40 DOM
-
2026-06-10days on market $64,000 Active 37 DOM
-
2026-06-09days on market $64,000 Active 36 DOM
-
2026-06-08days on market $64,000 Active 35 DOM
-
2026-06-07days on market $64,000 Active 34 DOM
-
2026-06-05days on market $64,000 Active 31 DOM
-
2026-06-03days on market $64,000 Active 30 DOM
-
2026-06-03days on market $64,000 Active 29 DOM
-
2026-06-01days on market $64,000 Active 28 DOM
-
2026-05-31days on market $64,000 Active 27 DOM
ⓘ Source: listings_history table (triggers on properties + properties_extension) + one-shot
backfill from property_details.listing_events for pre-trigger history.
Climate risk First Street
- Flood 1/10 Low FEMA zone X (unshaded) · 0% chance over 30 yrs
- Wildfire 2/10 Low
- Heat 2/10 Low 6 d/yr ≥89°F today · 15 d/yr by 30 yrs out
- Wind 2/10 Low
- Air quality 1/10 Low 0 unhealthy d/yr today · 0 by 30 yrs out
Nearby sold comps map
Loading sold comps map…
Walkable amenities ~0.75 mi
Loading nearby amenities…
Taxation est. · year 1
- Rental income
- $22,154
- − Mortgage interest
- −$3,585
- − Property taxes
- −$960
- − Insurance
- −$320
- − Repairs & maintenance
- −$1,772
- − Management
- −$1,772
- − Depreciation
- −$1,862
- Taxable income
- $11,882
- Est. tax owed @ 24.0%
- −$2,852
- After-tax cash flow
- $9,342/yr
For passive investors: Depreciation is non-cash, so a rental often shows a tax loss while cash-flowing — sheltering income. Rental losses are passive: they offset passive income freely, and up to $25,000/yr can offset ordinary (W-2) income if you actively participate and your MAGI is under $100k (phasing out to $0 by $150k); unused losses carry forward. On sale, claimed depreciation is recaptured at up to 25%, and gains may owe capital-gains tax (a 1031 exchange can defer both). Figures are a year-1 estimate at your 24.0% rate — not tax advice; consult a CPA.
Schools (NCES district)
- District
- Colorado Springs School District No. 11 In The County Of E
- NCES district ID
- 0803060
- Math proficiency
- 20% ▼ -8.00%
- Reading proficiency
- 37% ▼ -4.00%
- Median HH income
- $47,884
- Composite
- 24.69/100
- National rank
- #7613
- State rank
- #56 of 86 in CO
Livability — Colorado Springs
- Score
- 78/100
- State rank
- #23
- US rank
- #2639
Category grades
Schools grade is shown separately in the Schools card above.
Census & demographics
- Census place
- Colorado Springs, CO
- County
- El Paso County · 689,348 people
- City population
- 555,783
- Metro
- Colorado Springs, CO
- Population (ZIP)
- 41,104
- Household income
- $67,127
- Rent vs Own
- Severe rent burden
- 2041.0
Population outlook (El Paso County) Hauer SSP2
- Today (2025)
- 768,926 people
- By 2030
- 815,739 · +6.1%
- By 2040
- 903,489 · +17.5%
- By 2050
- 981,204 · +27.6%
- By 2075
- 1,155,542 · +50.3%
- By 2100
- 1,202,070 · +56.3%
Race, ethnicity, and origin ACS 2023
- Neighborhood character
- Diverse neighborhood (Simpson 0.70)
- Race & ethnicity
- Hispanic / Latino 38% White 37% Two or more races 18% Black 15% Asian 3% Native American 2%
- Hispanic origin (detail)
- Mexican 28% Puerto Rican 2%
- Common ancestry
- Lithuanian 1% Romanian 1% Slovak 1%
- Foreign-born
- 13% · Canada, South Korea
- Languages at home
- 73% English-only · Spanish 22% French/Haitian/Cajun 1% Tagalog/Filipino 1%
Political lean MEDSL · El Paso
- 2024 margin
- Lean R (+9.8) · D 43.8% · R 53.5% · Other 2.7%
- 2008→2024 swing
- +9.0pp toward D · 2008: -18.8pp · 2024: -9.8pp
- All cycles
- 2024: R+9.8 2020: R+10.8 2016: R+22.6 2012: R+21.4 2008: R+18.8
Not yet ingested
- Civics
- —
Market trends
- HPI YoY
- ▼ -114.77%
- Current HPI
- 301.5415
- Rent YoY
- ▲ 2.36%
- Metro
- Colorado Springs, CO
- State GDP YoY
- ▲ 1.95%
- F500 in state
- 14
Industry mix (Fortune 500 HQ in CO)
| Industry | F500 HQs | Revenue |
|---|---|---|
| Technology Distribution | 1 | $31B |
|
||
| Food / Agriculture | 1 | $18B |
|
||
| Packaging | 1 | $14B |
|
||
| Healthcare | 1 | $13B |
|
||
| Energy | 1 | $10B |
|
||
| Technology | 1 | $4B |
|
||
Cash-flow waterfall
monthlySold comps — $/sqft
last 12 mo · ≤1 miLoading sold comps…