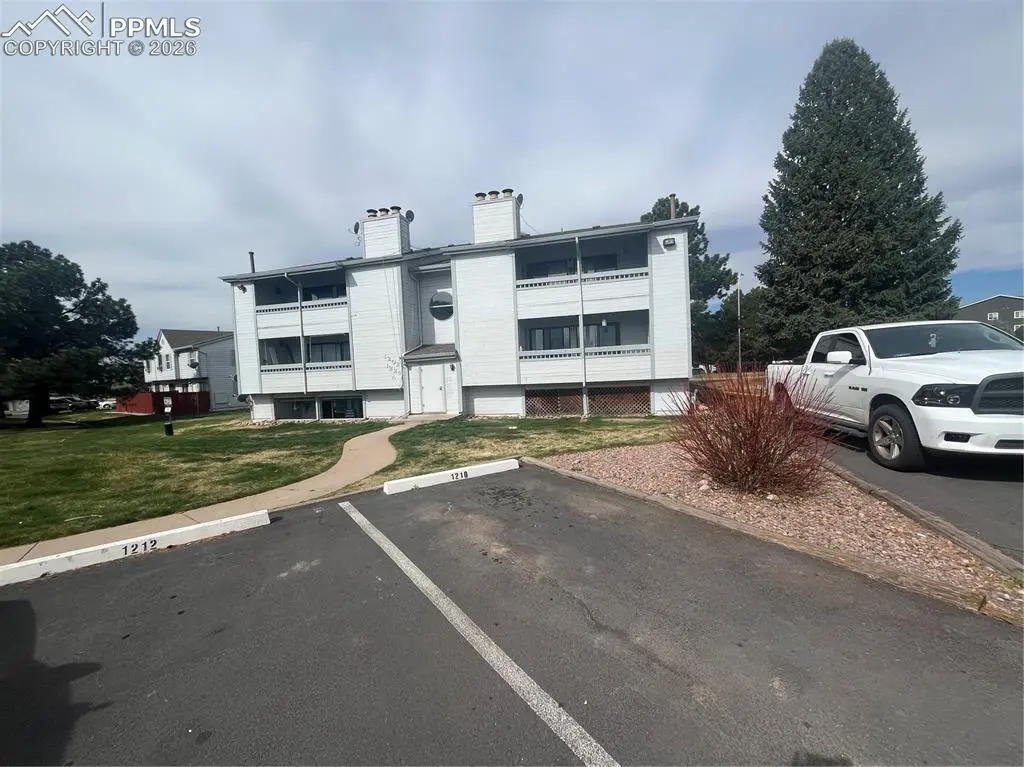
1206 Firefly Cir · Colorado Springs, CO
Flood risk 1/10 · Minimal
- FEMA flood zone
- X (unshaded)
- Chance of flooding over 30 yrs
- 0.0%
- Est. flood insurance / yr
- $507 – $1,088
Fire risk 3/10 · Minor
- Est. fire insurance / yr
- $939 – $1,743
Heat risk 3/10 · Minor
- Hot days now (above 90°F)
- 7 days/yr
- Hot days in 30 yrs
- 19 days/yr
Wind risk 2/10 · Minimal
- Chance of severe wind over 30 yrs
- —
Air-quality risk 1/10 · Minimal
- Unhealthy air days now
- 0 days/yr
- Unhealthy air days in 30 yrs
- 0 days/yr
Risk factors via First Street. Map © Google.
Why this score? — see what drove the D+ grade
The composite is a weighted blend of 9 inputs, each scored 0–100. Each bar is that input's sub-score; the figure is the points it added to the 100-point composite (weight × sub-score).
- Cash flow +16.7/30.0
- 1% rule +7.9/10.0
- ARV discount +7.5/15.0
- DSCR +5.2/10.0
- Livability +3.9/5.0
- Rent growth +3.1/5.0
- Condition / age +2.5/5.0
- Schools +2.1/10.0
- Appreciation +0.0/10.0
$114,900
🖨 Deal sheet 📄 Offer letter ✓ Due diligence
Listing remarks
new vinyl plank flooring in living room, hall and bedrooms - freshly painted - new sliding closet doors - new bi-fold doors at utility area and hall closet
Key facts
- Sliding closet doors
- Bi-fold doors
- Vinyl plank flooring
Tags
Property features AI
Finance
- Financial info: Financing available: Cash, Conventional, FHA, VA
- HOA & community: HOA required; Association fee $415 monthly; HOA covers covenant enforcement, insurance, lawn care, management, and trash removal
Exterior
- Parking: Assigned garage space (1)
- Utilities: Municipal water; Cable available; Electricity available
- Home design: Condominium; Ground-floor unit; Garden-level foundation
- Construction: Framed on lot; Masonite-type siding; Composite shingle roof; Existing construction
- Exterior features: Concrete patio; Community fence; Level lot; Paved driveway; No alley
Interior
- Kitchen: Dishwasher; Disposal; Oven; Range oven (gas/electric); Refrigerator
- Bedrooms: Main floor bedroom
- Flooring: Ceramic tile; Plank
- Bathrooms: 1 full bathroom
- Heating & cooling: Forced air heating (natural gas); No central cooling
- Interior features: Ceramic tile and plank flooring; Wood-burning fireplace (main level)
- Laundry & utility: Electric washer/dryer hookup on main level
Neighborhood map
What this means for you Summary
Snapshot
- This is a 2-bed/1.0-bath condo listed at $115k.
Deal economics
- At list price, monthly cash flow is $71 ($854/yr) — positive.
- The deal already cash-flows at list — no discount required.
- Meets the 1% rule at list price ($1k rent vs $115k).
- Recommended offer: $108k (6.0% below list) — sets the bar for market timing.
- Cap rate 7.0% vs local median 3.3% in Colorado Springs — top-decile yield for the area; either an underpriced asset or a hidden risk that comps aren't pricing in. Stress-test before assuming the spread holds.
Location & tenants
- Location reads 78/100 on livability (#23 in CO, #2,639 nationally) — a middle-class / working-renter tenant base. Strengths: amenities A+, housing A+, health & safety A+; Watch: cost of living C-, crime F.
- Harrison School District No. 2 In The County Of El Paso An (urban): math 16% / reading 35% proficiency, ranked #67 of 86 in CO (top 78%) — low school quality limits family demand, transient renter base, plan for 1-2y turnover; 62% free/reduced lunch — lower-income household profile, screen leases tightly.
- Market conditions: Rents rising (+2.4%/yr); 183 active listings in the ZIP; 40 comparable units currently listed for rent nearby; rentals leasing fast (median 3d on market — plan ~1-2 weeks tenant-placement turnaround); 3,906 units permitted in El Paso County in 2024 (872 in 5+ unit buildings).
Forward outlook
- Local home prices are declining (-3.0%/yr); year-one equity from $794 of loan paydown is wiped out by about $3k of value loss. Plan a longer hold.
- El Paso County population projected at +28% by 2050 — long-run rental-demand tailwind backs the buy-and-hold thesis.
Negotiation context
- It's been on market 79 days — a 6% lower offer ($108k) is reasonable based on typical stale-listing flexibility.
- Current owner paid $66k; list at $115k implies a 74% gain — meaningful room to come down on a strong offer.
Risks & watch-outs
- Watch-outs: HOA is 28% of rent.
Questions for the listing agent
- It's been on market 79 days. Have you received any prior offers? Is the seller open to a 6% concession, seller financing, or rate buy-down credit?
- What does the HOA fee cover, when was the last increase, and are there any pending special assessments or reserve-fund shortfalls?
- Any open or pending special assessments — roof, HVAC, plumbing, elevator, façade? What's the per-unit balance and payoff schedule, and is the seller paying it off at close or rolling it to the buyer?
- Why hasn't it sold? Are there any deal-killer items the seller is aware of (foundation, flood, title, zoning, code violations)?
- Is there a deadline driving the sale (1031 exchange, divorce, estate, relocation)? That informs how much negotiation room exists.
- Schools are B-rated — typically a magnet for longer-tenancy family renters. What's the average tenant stay here, and is there a school-zone premium baked into asking?
- Crime grade is F in this area — have there been break-ins, vandalism, or insurance claims at this property in the last 3 years? What carrier currently insures it and at what premium?
- The area grade is low — what's the realistic commute time and amenity access for the typical tenant pool here? Any planned neighborhood developments (good or bad) we should know about?
- What's the average days-on-market for RENTAL listings here right now (not sales)? A rising rental-DOM trend means longer vacancies and softer asking-rent achievability than the comps imply.
- What's the recent tenant-quality profile in this submarket — average credit score on applications, eviction rate, late-payment / NSF rate, and stable-employment percentage? A property-management company in the area should have these aggregated.
- How much new apartment / multifamily construction is in the pipeline within 1–3 miles? Heavy new supply (>2% of stock underway) typically softens rents 12–24 months out; light construction supports rent growth.
Investment metrics
- 1% rule
- 1.29% ✓
- Cap rate
- 7.04%
- Cash-on-cash
- 2.66%
- DSCR
- 1.12
- GRM
- 6.5
CMA / ARV
No comps found within radius.
Projected returns pro-forma
-3.0% appreciation · 2.36% rent growth · sell at horizon
- IRR
- -12.9%
- Equity multiple
- 0.54×
- Total profit
- $-14,822
- Equity at exit
- $17,132
- IRR
- -4.9%
- Equity multiple
- 0.69×
- Total profit
- $-10,056
- Equity at exit
- $9,934
Cash invested: $32,172 (down + closing). Projections, not guarantees.
Landlord ↔ Tenant lean methodology
- Overall (STATE)
- 38 Tenant-Leaning
- State Colorado
- 38 Tenant-Leaning · D+4
- County
- — inherits STATE
- City
- — inherits STATE
ZIP-level market 80916
- Home prices YoY
- -27.6%
- Rents YoY
- 2.4%
- Active inventory
- 183
- Price-to-rent
- 6.5×
Monthly cashflow live
- Estimated rent
- $1,481 high interval (Pro) →
- Mortgage (P&I)
- −$603
- Tax from tax record
- −$33 /mo · $401/yr
- Insurance
- −$48
- HOA
- −$415
- Vacancy / Maint / Mgmt
- −$311
- Net cashflow
- $71
Break-even live
UW: 25.0% down · 7.5% · 30yr · 1.5% tax · 5.0% vac · 8.0% maint · 8.0% mgmt
Financing live
Cash to close
- Down payment
- $28,725
- Closing costs
- $3,447
- Reserves months
- —
- Total cash needed
- —
Loan-product check · same deal, 3 products live
Conventional
25% down · 7.5% · 30yr
- Down + closing
- —
- Monthly P&I
- —
- Monthly cashflow
- —
- DSCR
- —
- Eligible?
- —
Personal DTI + credit; lowest rate.
DSCR
20% down · 8.5% · 30yr
- Down + closing
- —
- Monthly P&I
- —
- Monthly cashflow
- —
- DSCR
- —
- Eligible?
- —
No personal income docs; deal must DSCR.
Hard money
10% down · 12.0% · 12mo
- Down + closing
- —
- Monthly P&I
- —
- Monthly cashflow
- —
- DSCR
- —
- Eligible?
- —
Short-term bridge; refi at stabilization.
Rent comps 40 comps
| Address | Beds | Baths | Sqft | Rent | $/sqft | DOM | Units | Dist |
|---|---|---|---|---|---|---|---|---|
| 1210 Firefly Cir Colorado Springs, CO | 2.0 | 1.0 | 940 | $1,143 | $1.22 | 23d | 1 | 0.03mi |
| 1432 Sandalwood Dr Colorado Springs, CO | 1.0–2.0 | 1.0–2.0 | 742 | $1,356 | $1.83 | 2d | 24 | 0.12mi |
| 4275 Sanders Vw Colorado Springs, CO | 1.0–3.0 | 1.0–2.0 | 932 | $2,136 | $2.29 | 2d | 27 | 0.18mi |
| 830 Cana Grv Colorado Springs, CO | 2.0 | 1.0–2.0 | 605 | $1,599 | $2.64 | 2d | 16 | 0.31mi |
| 4536 Samaritan Loop Colorado Springs, CO | 2.0 | 1.5 | 1108 | $2,200 | $1.99 | 23d | 1 | 0.31mi |
| 4710 Spacewalk Way Colorado Springs, CO | 2.0 | 2.0 | 1068 | $2,049 | $1.92 | 2d | 1 | 0.34mi |
| 4325 Fountain Springs Grv Colorado Springs, CO | 1.0–3.0 | 1.0–2.0 | 920 | $1,328 | $1.44 | 2d | 5 | 0.41mi |
| 1340 Inverness Dr Colorado Springs, CO | 1.0–3.0 | 1.0–2.0 | 936 | $1,612 | $1.72 | 2d | 17 | 0.50mi |
| 4703 Goodwin Grv Colorado Springs, CO | 2.0 | 1.0–2.0 | 605 | $1,525 | $2.52 | 2d | 8 | 0.52mi |
| 720 Chapman Dr Colorado Springs, CO | 1.0–2.0 | 1.0–1.5 | 861 | $1,351 | $1.57 | 2d | 20 | 0.55mi |
| 4165 Lacy Ln Colorado Springs, CO | 1.0–2.0 | 1.0–2.0 | 750 | $1,480 | $1.97 | 2d | 10 | 0.60mi |
| 1810 Kaleidos Vw Colorado Springs, CO | 1.0–3.0 | 1.0–2.0 | 1023 | $1,998 | $1.95 | 2d | 6 | 0.62mi |
| 4255 Airport Rd Colorado Springs, CO | 1.0–2.0 | 1.0 | 785 | $1,050 | $1.34 | 2d | 15 | 0.71mi |
| 1737 Ramjet PT Colorado Springs, CO | 2.0 | 1.0–2.0 | 642 | $1,784 | $2.78 | 2d | 42 | 0.73mi |
| 4046 Mallette Hts Colorado Springs, CO | 1.0–2.0 | 1.0–2.0 | 737 | $1,659 | $2.25 | 2d | 6 | 0.74mi |
| 4960 Fountain Ford Vw Colorado Springs, CO | 1.0–3.0 | 1.0–2.0 | 973 | $1,872 | $1.92 | 2d | 28 | 0.75mi |
| 350 Vehr Dr Unit 3 Colorado Springs, CO | 2.0 | 1.0 | 787 | $955 | $1.21 | 3d | 1 | 0.76mi |
| 357 Gahart Dr Unit 4 Colorado Springs, CO | 2.0 | 1.0 | 630 | $950 | $1.51 | 3d | 1 | 0.76mi |
| 1609 Zebulon Dr Colorado Springs, CO | 2.0–3.0 | 2.0 | 1029 | $1,078 | $1.05 | 14d | 7 | 0.77mi |
| 349 Gahart Dr Colorado Springs, CO | 2.0 | 1.0 | 884 | $1,162 | $1.31 | 23d | 1 | 0.78mi |
| 330 Vehr Dr Unit 1 Colorado Springs, CO | 2.0 | 1.0 | 850 | $1,500 | $1.76 | 23d | 1 | 0.78mi |
| 330 Vehr Dr Unit 2 Colorado Springs, CO | 2.0 | 1.0 | 709 | $1,000 | $1.41 | 23d | 1 | 0.78mi |
| 934 Acapulco Ct Colorado Springs, CO | 2.0 | 1.0 | 858 | $1,343 | $1.57 | 23d | 1 | 0.79mi |
| 351 Gahart Dr Apt D Colorado Springs, CO | 2.0 | 1.0 | 806 | $1,295 | $1.61 | 23d | 1 | 0.79mi |
| 1074 Acapulco Ct Colorado Springs, CO | 2.0 | 1.0 | 858 | $1,295 | $1.51 | 23d | 1 | 0.79mi |
| 3684 Iguana Dr Colorado Springs, CO | 2.0 | 2.0 | 992 | $1,695 | $1.71 | 2d | 1 | 0.79mi |
| 952 Acapulco Ct Colorado Springs, CO | 2.0 | 1.0 | 858 | $1,285 | $1.50 | 2d | 1 | 0.80mi |
| 4060 Airport Rd Unit 4 Colorado Springs, CO | 2.0 | 1.0 | 752 | $1,050 | $1.40 | 23d | 1 | 0.82mi |
| 3624 Iguana Dr Unit 1 Colorado Springs, CO | 2.0 | 2.0 | 992 | $1,695 | $1.71 | 2d | 1 | 0.83mi |
| 3620 Verde Dr Unit 103 Colorado Springs, CO | 2.0 | 1.0 | 850 | $1,175 | $1.38 | 23d | 1 | 0.84mi |
| 1960 S Chelton Rd Colorado Springs, CO | 3.0 | 1.0–2.0 | 810 | $1,223 | $1.51 | 23d | 1 | 0.84mi |
| 321 Bonnie Ct Colorado Springs, CO | 2.0 | 1.0 | 600 | $1,004 | $1.67 | 14d | 1 | 0.85mi |
| 991 Ibsen Vw Colorado Springs, CO | 2.0 | 1.0–2.0 | 630 | $1,599 | $2.54 | 2d | 13 | 0.86mi |
| 335 Ruskin Dr Colorado Springs, CO | 2.0 | 1.0 | 760 | $925 | $1.22 | 14d | 1 | 0.86mi |
| 4020 Ruskin Way Unit 2 Colorado Springs, CO | 2.0 | 1.0 | 750 | $925 | $1.23 | 3d | 1 | 0.88mi |
| 411 Lakewood Cir Unit B1110 Colorado Springs, CO | 1.0 | 1.0 | 576 | $845 | $1.47 | 23d | 1 | 0.89mi |
| 1785 Zebulon Dr Unit D Colorado Springs, CO | 2.0 | 1.0 | 700 | $1,125 | $1.61 | 14d | 1 | 0.94mi |
| 2023 Murray Creek Ct Colorado Springs, CO | 1.0 | 1.0 | 569 | $1,394 | $2.45 | 2d | 4 | 0.94mi |
| 1825 Zebulon Dr Colorado Springs, CO | 2.0 | 1.0 | 851 | $1,066 | $1.25 | 23d | 1 | 0.96mi |
| 1041 Palacio Vw Colorado Springs, CO | 1.0–2.0 | 1.0–2.0 | 846 | $1,675 | $1.98 | 10d | 32 | 1.03mi |
HOA detail condo
- Monthly dues
- $415 · $4,980/yr
- Assessments
- None detected in remarks — confirm with the listing agent.
Listing history 22 events
-
2026-06-18days on market $114,900 Active 79 DOM
-
2026-06-17days on market $114,900 Active 78 DOM
-
2026-06-16days on market $114,900 Active 77 DOM
-
2026-06-15price $114,900 Active 76 DOM
-
2026-06-15days on market $124,999 Active 76 DOM
-
2026-06-14days on market $124,999 Active 74 DOM
-
2026-06-13days on market $124,999 Active 73 DOM
-
2026-06-10days on market $124,999 Active 71 DOM
-
2026-06-09days on market $124,999 Active 70 DOM
-
2026-06-08days on market $124,999 Active 69 DOM
-
2026-06-07days on market $124,999 Active 68 DOM
-
2026-06-05days on market $124,999 Active 65 DOM
-
2026-06-03days on market $124,999 Active 64 DOM
-
2026-06-03days on market $124,999 Active 63 DOM
-
2026-06-02price $124,999 Active 62 DOM
-
2026-06-01days on market $134,000 Active 62 DOM
-
2026-05-31days on market $134,000 Active 61 DOM
-
2026-05-08price $134,000
-
2026-03-31$139,000 Active
-
2001-12-10soldstatus $66,000
-
1995-11-07soldstatus $43,500
-
1985-02-01soldstatus $57,700
ⓘ Source: listings_history table (triggers on properties + properties_extension) + one-shot
backfill from property_details.listing_events for pre-trigger history.
Tax reassessment forecast CO · Resets to sale price
- Current annual tax
- $401 · $33/mo
- Projected year-2 tax
- $632 · $53/mo
- Expected delta
- +$231/yr (+$19/mo · 57.4%)
ⓘ Screening estimate from a state-policy table — verify with the county assessor before closing.
Climate risk First Street
- Flood 1/10 Low FEMA zone X (unshaded) · 0% chance over 30 yrs
- Wildfire 3/10 Moderate
- Heat 3/10 Moderate 7 d/yr ≥90°F today · 19 d/yr by 30 yrs out
- Wind 2/10 Low
- Air quality 1/10 Low 0 unhealthy d/yr today · 0 by 30 yrs out
Nearby sold comps map
Loading sold comps map…
Walkable amenities ~0.75 mi
Loading nearby amenities…
Taxation est. · year 1
- Rental income
- $17,773
- − Mortgage interest
- −$6,436
- − Property taxes
- −$401
- − Insurance
- −$574
- − Repairs & maintenance
- −$1,422
- − Management
- −$1,422
- − HOA
- −$4,980
- − Depreciation
- −$3,343
- Taxable loss
- −$805
- Est. tax savings @ 24.0%
- +$193
- After-tax cash flow
- $1,048/yr
For passive investors: Depreciation is non-cash, so a rental often shows a tax loss while cash-flowing — sheltering income. Rental losses are passive: they offset passive income freely, and up to $25,000/yr can offset ordinary (W-2) income if you actively participate and your MAGI is under $100k (phasing out to $0 by $150k); unused losses carry forward. On sale, claimed depreciation is recaptured at up to 25%, and gains may owe capital-gains tax (a 1031 exchange can defer both). Figures are a year-1 estimate at your 24.0% rate — not tax advice; consult a CPA.
Schools (NCES district)
- District
- Harrison School District No. 2 In The County Of El Paso An
- NCES district ID
- 0804530
- Math proficiency
- 16% ▼ -13.00%
- Reading proficiency
- 35% ▼ -7.00%
- Median HH income
- $40,242
- Composite
- 21.47/100
- National rank
- #8333
- State rank
- #67 of 86 in CO
Livability — Colorado Springs
- Score
- 78/100
- State rank
- #23
- US rank
- #2639
Category grades
Schools grade is shown separately in the Schools card above.
Census & demographics
- Census place
- Colorado Springs, CO
- County
- El Paso County · 689,348 people
- City population
- 555,783
- Metro
- Colorado Springs, CO
- Population (ZIP)
- 41,104
- Household income
- $67,127
- Rent vs Own
- Severe rent burden
- 2041.0
Population outlook (El Paso County) Hauer SSP2
- Today (2025)
- 768,926 people
- By 2030
- 815,739 · +6.1%
- By 2040
- 903,489 · +17.5%
- By 2050
- 981,204 · +27.6%
- By 2075
- 1,155,542 · +50.3%
- By 2100
- 1,202,070 · +56.3%
Race, ethnicity, and origin ACS 2023
- Neighborhood character
- Diverse neighborhood (Simpson 0.70)
- Race & ethnicity
- Hispanic / Latino 38% White 37% Two or more races 18% Black 15% Asian 3% Native American 2%
- Hispanic origin (detail)
- Mexican 28% Puerto Rican 2%
- Common ancestry
- Lithuanian 1% Romanian 1% Slovak 1%
- Foreign-born
- 13% · Canada, South Korea
- Languages at home
- 73% English-only · Spanish 22% French/Haitian/Cajun 1% Tagalog/Filipino 1%
Political lean MEDSL · El Paso
- 2024 margin
- Lean R (+9.8) · D 43.8% · R 53.5% · Other 2.7%
- 2008→2024 swing
- +9.0pp toward D · 2008: -18.8pp · 2024: -9.8pp
- All cycles
- 2024: R+9.8 2020: R+10.8 2016: R+22.6 2012: R+21.4 2008: R+18.8
Not yet ingested
- Civics
- —
Market trends
- HPI YoY
- ▼ -114.77%
- Current HPI
- 301.5415
- Rent YoY
- ▲ 2.36%
- Metro
- Colorado Springs, CO
- State GDP YoY
- ▲ 1.95%
- F500 in state
- 14
Industry mix (Fortune 500 HQ in CO)
| Industry | F500 HQs | Revenue |
|---|---|---|
| Technology Distribution | 1 | $31B |
|
||
| Food / Agriculture | 1 | $18B |
|
||
| Packaging | 1 | $14B |
|
||
| Healthcare | 1 | $13B |
|
||
| Energy | 1 | $10B |
|
||
| Technology | 1 | $4B |
|
||
Price history
+132.2% since first listed5 events — show timeline
- 2026-05-08 Price Changed $134,000 elevateMLS
- 2026-03-31 Listed $139,000 elevateMLS
- 2001-12-10 Sold (Public Records) $66,000 Public Records
- 1995-11-07 Sold (Public Records) $43,500 Public Records
- 1985-02-01 Sold (Public Records) $57,700 Public Records
Property tax history
+1.5%/yrLatest (2024): $401 · +65.4% YoY. Source: county tax records.
Cash-flow waterfall
monthlySold comps — $/sqft
last 12 mo · ≤1 miLoading sold comps…