8670 W Lynchburg Salem · Montvale, VA
Flood risk No data
- FEMA flood zone
- —
- Chance of flooding over 30 yrs
- —
- Est. flood insurance / yr
- —
Fire risk No data
- Est. fire insurance / yr
- —
Heat risk No data
- Hot days now (above threshold)
- —
- Hot days in 30 yrs
- —
Wind risk No data
- Chance of severe wind over 30 yrs
- —
Air-quality risk No data
- Unhealthy air days now
- —
- Unhealthy air days in 30 yrs
- —
Risk factors via First Street. Map © Google.
Why this score? — see what drove the A- grade
The composite is a weighted blend of 9 inputs, each scored 0–100. Each bar is that input's sub-score; the figure is the points it added to the 100-point composite (weight × sub-score).
- Cash flow +30.0/30.0
- 1% rule +10.0/10.0
- DSCR +10.0/10.0
- Appreciation +10.0/10.0
- ARV discount +7.5/15.0
- Schools +5.5/10.0
- Livability +3.5/5.0
- Rent growth +2.5/5.0
- Condition / age +2.2/5.0
$75,000
🖨 Deal sheet 📄 Offer letter ✓ Due diligence
Listing remarks
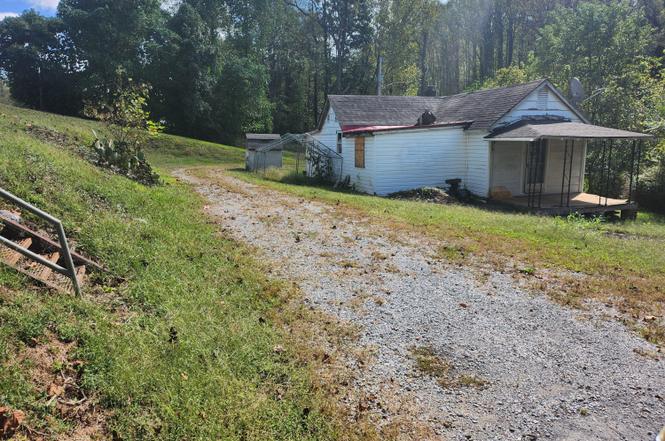
Discover several incredible opportunities with this charming property—whether you're a first-time homeowner, a fixer-upper enthusiast, or looking to build or add a trailer while still living onsite. Enjoy breathtaking mountain views and a prime location just off 460 for convenient access. While it just needs some TLC to personalize, it already features hardwood floors throughout, electricity connected, and internet available. Don't miss this fantastic chance to make it your own!
Key facts
- Prime location
- Internet available
- Hardwood floors
Tags
Property features AI
Finance
- Financial info: Listing price shown separately (financial details excluded)
Exterior
- Home design: Residential property; Built in 1940
- Construction: Built in 1940
- Exterior features: Front porch; Rear porch; 1.22-acre lot
Interior
- Bedrooms: 2 bedrooms (both on the main level)
- Flooring: Vinyl flooring; Wood flooring
- Bathrooms: 1 full bathroom (main level)
- Heating & cooling: Wood furnace heating
- Interior features: Wood doors; Vinyl and wood flooring; Crawl space basement; One fireplace
Neighborhood map
What this means for you Summary
Snapshot
- This is a 2-bed/1.0-bath single-family listed at $75k. Condition is rated fair.
Deal economics
- At list price, monthly cash flow is $1k ($13k/yr) — positive.
- The deal already cash-flows at list — no discount required.
- Meets the 1% rule at list price ($2k rent vs $75k).
- Recommended offer: $66k (12.0% below list) — sets the bar for market timing.
Location & tenants
- Location reads 70/100 on livability (#225 in VA) — a middle-class / working-renter tenant base. Strengths: cost of living A+, housing A+, health & safety A+; Watch: crime C-, employment D, amenities F.
- Bedford County Public School District (rural): math 55% / reading 73% proficiency, ranked #41 of 131 in VA (top 31%) — acceptable for families but not a draw, mixed tenant base, ~2y average lease.
- Zoned schools: Otter River Elementary (math 64% / reading 74%, grade A-, #313 of 1,108 statewide, top 32%, 198 students, 39% FRL); Liberty Middle (math 49% / reading 67%, grade B, #174 of 342 statewide, top 51%, 535 students, 86% FRL); Liberty High (math 41% / reading 68%, grade C-, #281 of 319 statewide, top 90%, 726 students, 69% FRL) — zoned schools average 65% FRL vs 30% district-wide (35 pts higher); higher-poverty schools than district average — tighter screening recommended.
- Market conditions: 19 active listings in the ZIP; 294 units permitted in Bedford County in 2024 (0 in 5+ unit buildings).
Forward outlook
- In year one you build about $8k of equity ($519 loan paydown + $8k appreciation (10.0% local appreciation)).
- Bedford County population projected at +8% by 2050 — modest demand growth; plan on rents tracking national, not racing it.
- At projected returns (10.0% appreciation + 3.0% rent growth), your $21k cash investment doubles in ~1 year — after that, you're playing with house money.
- By year 5, paydown + projected appreciation supports a ~$37k cash-out refi (75% LTV) — recoverable capital for the next deal without selling this one.
Negotiation context
- It's been on market 229 days — a 12% lower offer ($66k) is reasonable based on typical stale-listing flexibility.
- 2 sale attempts; this cycle's ask has dropped $25k (25%) from the opening price — seller is motivated, your offer sets the floor, not the list.
Risks & watch-outs
- Watch-outs: built in 1940 — expect roof / HVAC / electrical / plumbing capex.
Questions for the listing agent
- It's been on market 229 days. Have you received any prior offers? Is the seller open to a 12% concession, seller financing, or rate buy-down credit?
- Have any recent inspections been done? Can we get a copy of the seller's disclosures and any deferred-maintenance estimates?
- Built in 1940 — when were the roof, HVAC, electrical panel, plumbing, and water heater last replaced?
- Why hasn't it sold? Are there any deal-killer items the seller is aware of (foundation, flood, title, zoning, code violations)?
- Is there a deadline driving the sale (1031 exchange, divorce, estate, relocation)? That informs how much negotiation room exists.
- Schools are B-rated — typically a magnet for longer-tenancy family renters. What's the average tenant stay here, and is there a school-zone premium baked into asking?
- What's the average days-on-market for RENTAL listings here right now (not sales)? A rising rental-DOM trend means longer vacancies and softer asking-rent achievability than the comps imply.
- What's the recent tenant-quality profile in this submarket — average credit score on applications, eviction rate, late-payment / NSF rate, and stable-employment percentage? A property-management company in the area should have these aggregated.
- How much new for-sale + rental construction is in the pipeline within 1–3 miles? Heavy new supply typically softens prices + rents 12–24 months out; constrained supply supports both.
Investment metrics
- 1% rule
- 2.74% ✓
- Cap rate
- 23.97%
- Cash-on-cash
- 63.13%
- DSCR
- 3.81
- GRM
- 3.0
CMA / ARV
No comps found within radius.
Projected returns pro-forma
10.0% appreciation · 3.0% rent growth · sell at horizon
- IRR
- 74.9%
- Equity multiple
- 6.30×
- Total profit
- $111,242
- Equity at exit
- $67,566
- IRR
- 68.9%
- Equity multiple
- 13.97×
- Total profit
- $272,318
- Equity at exit
- $145,709
Cash invested: $21,000 (down + closing). Projections, not guarantees.
Landlord ↔ Tenant lean methodology
- Overall (STATE)
- 55 Moderately Landlord-Leaning
- State Virginia
- 55 Moderately Landlord-Leaning · D+2
- County
- — inherits STATE
- City
- — inherits STATE
ZIP-level market 24174
- Home prices YoY
- 24.9%
- Active inventory
- 19
- Price-to-rent
- 3.0×
Monthly cashflow live
- Estimated rent
- $2,055 medium interval (Pro) →
- Mortgage (P&I)
- −$393
- Tax est. 1.5%
- −$94 /mo · $1,125/yr
- Insurance
- −$31
- HOA
- −$0
- Vacancy / Maint / Mgmt
- −$431
- Net cashflow
- $1,105
Break-even live
UW: 25.0% down · 7.5% · 30yr · 1.5% tax · 5.0% vac · 8.0% maint · 8.0% mgmt
Financing live
Cash to close
- Down payment
- $18,750
- Closing costs
- $2,250
- Reserves months
- —
- Total cash needed
- —
Loan-product check · same deal, 3 products live
Conventional
25% down · 7.5% · 30yr
- Down + closing
- —
- Monthly P&I
- —
- Monthly cashflow
- —
- DSCR
- —
- Eligible?
- —
Personal DTI + credit; lowest rate.
DSCR
20% down · 8.5% · 30yr
- Down + closing
- —
- Monthly P&I
- —
- Monthly cashflow
- —
- DSCR
- —
- Eligible?
- —
No personal income docs; deal must DSCR.
Hard money
10% down · 12.0% · 12mo
- Down + closing
- —
- Monthly P&I
- —
- Monthly cashflow
- —
- DSCR
- —
- Eligible?
- —
Short-term bridge; refi at stabilization.
Listing history 15 events
-
2026-06-19days on market $75,000 Active 229 DOM
-
2026-06-18days on market $75,000 Active 228 DOM
-
2026-06-17days on market $75,000 Active 227 DOM
-
2026-06-16days on market $75,000 Active 226 DOM
-
2026-06-15days on market $75,000 Active 225 DOM
-
2026-06-14days on market $75,000 Active 223 DOM
-
2026-06-13days on market $75,000 Active 222 DOM
-
2026-06-10days on market $75,000 Active 220 DOM
-
2026-06-09days on market $75,000 Active 219 DOM
-
2026-06-09price $75,000 Active 218 DOM
-
2026-06-08days on market $80,000 Active 218 DOM
-
2026-06-07days on market $80,000 Active 217 DOM
-
2026-06-05days on market $80,000 Active 214 DOM
-
2026-06-03remarks 483-char remark
-
2026-06-03$80,000 Active 213 DOM
ⓘ Source: listings_history table (triggers on properties + properties_extension) + one-shot
backfill from property_details.listing_events for pre-trigger history.
Nearby sold comps map
Loading sold comps map…
Walkable amenities ~0.75 mi
Loading nearby amenities…
Taxation est. · year 1
- Rental income
- $24,655
- − Mortgage interest
- −$4,201
- − Property taxes
- −$1,125
- − Insurance
- −$375
- − Repairs & maintenance
- −$1,972
- − Management
- −$1,972
- − Depreciation
- −$2,182
- Taxable income
- $12,827
- Est. tax owed @ 24.0%
- −$3,078
- After-tax cash flow
- $10,179/yr
For passive investors: Depreciation is non-cash, so a rental often shows a tax loss while cash-flowing — sheltering income. Rental losses are passive: they offset passive income freely, and up to $25,000/yr can offset ordinary (W-2) income if you actively participate and your MAGI is under $100k (phasing out to $0 by $150k); unused losses carry forward. On sale, claimed depreciation is recaptured at up to 25%, and gains may owe capital-gains tax (a 1031 exchange can defer both). Figures are a year-1 estimate at your 24.0% rate — not tax advice; consult a CPA.
Condition & rehab AI · 6 photos
This property requires significant repairs and maintenance, including a new roof and exterior painting, to improve its condition and increase its value.
Repairs flagged
- Major roof — Significant wear and potential leaks.
- Major exterior siding — Peeling paint and discoloration.
- Major flooring — Visible wear and tear.
- Major interior walls — Signs of wear and potential water damage.
- Major HVAC system — Old and may need replacement or repair.
Value-add opportunities
- Resale New roof — A new roof will significantly improve the home's curb appeal and overall condition.
- Resale Exterior painting — Fresh paint will improve the home's appearance and increase its resale value.
- Both HVAC system replacement — A new HVAC system will improve comfort and energy efficiency, benefiting both resale and rental value.
Renovation cost estimate screening
| Repair item | Severity | Est. cost |
|---|---|---|
| roof · Significant wear and potential leaks. | Major | $15,000–50,000 |
| exterior siding · Peeling paint and discoloration. | Major | $15,000–50,000 |
| flooring · Visible wear and tear. | Major | $15,000–50,000 |
| interior walls · Signs of wear and potential water damage. | Major | $15,000–50,000 |
| HVAC system · Old and may need replacement or repair. | Major | $15,000–50,000 |
| Total estimated repair cost · 5 items | $75,000–250,000 |
Value-add ROI direction
- Resale New roof — A new roof will significantly improve the home's curb appeal and overall condition. ↑
- Resale Exterior painting — Fresh paint will improve the home's appearance and increase its resale value. ↑
- Both HVAC system replacement — A new HVAC system will improve comfort and energy efficiency, benefiting both resale and rental value. ↑
ⓘ Cost ranges are severity-bucket heuristics (US national rule-of-thumb). Get contractor quotes + a written scope before underwriting a rehab budget.
Schools (NCES district)
- District
- Bedford County Public School District
- NCES district ID
- 5100360
- Math proficiency
- 55% ▼ -29.00%
- Reading proficiency
- 73% ▼ -7.00%
- Median HH income
- $56,288
- Composite
- 54.92/100
- National rank
- #1310
- State rank
- #41 of 131 in VA
Livability — Montvale
- Score
- 70/100
- State rank
- #225
- US rank
- #7450
Category grades
Schools grade is shown separately in the Schools card above.
Census & demographics
- Population (ZIP)
- 2,335
Population outlook (Bedford County) Hauer SSP2
- Today (2025)
- 83,194 people
- By 2030
- 85,499 · +2.8%
- By 2040
- 88,834 · +6.8%
- By 2050
- 90,060 · +8.3%
- By 2075
- 94,131 · +13.1%
- By 2100
- 89,832 · +8.0%
Race, ethnicity, and origin ACS 2023
- Neighborhood character
- Predominantly White (93%)
- Race & ethnicity
- White 93% Asian 4% Two or more races 3%
- Common ancestry
- Italian 3% German 2% Romanian 1%
- Foreign-born
- 4% · Vietnam, Canada
- Languages at home
- 94% English-only · Vietnamese 2% Russian/Polish/Slavic 2% Spanish 2%
Political lean MEDSL · Bedford
- 2024 margin
- Solid R (+50.4) · D 24.4% · R 74.8%
- 2008→2024 swing
- -13.0pp toward R · 2008: -37.4pp · 2024: -50.4pp
- All cycles
- 2024: R+50.4 2020: R+48.1 2016: R+49.4 2012: R+45.0 2008: R+37.4
Not yet ingested
- Civics
- —
Market trends
- HPI YoY
- ▲ 61.56%
- Current HPI
- 308.8944
- Rent YoY
- —
- Metro
- —
- State GDP YoY
- ▲ 2.40%
- F500 in state
- 50
Industry mix (Fortune 500 HQ in VA)
| Industry | F500 HQs | Revenue |
|---|---|---|
| Aerospace / Defense | 4 | $236B |
|
||
| Technology / Defense | 3 | $32B |
|
||
| Financial Services | 2 | $176B |
|
||
| Utilities | 2 | $27B |
|
||
| Insurance | 2 | $25B |
|
||
| Technology | 2 | $15B |
|
||
Price history
-20.0% since first listed6 events — show timeline
- 2026-05-29 Relisted — MLSRV
- 2026-05-02 Pending — MLSRV
- 2026-04-28 Price Changed $80,000 MLSRV
- 2026-03-19 Price Changed $85,000 MLSRV
- 2025-11-18 Price Changed $95,000 MLSRV
- 2025-10-07 Listed $100,000 MLSRV
Cash-flow waterfall
monthlySold comps — $/sqft
last 12 mo · ≤1 miLoading sold comps…