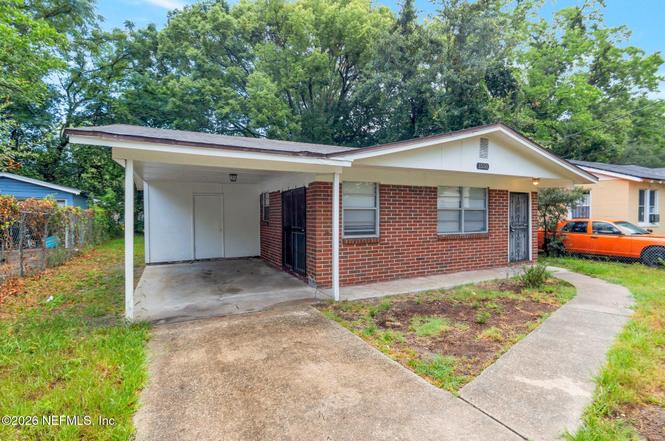
1551 W 31st St · Jacksonville, FL
Flood risk 1/10 · Minimal
- FEMA flood zone
- X (unshaded)
- Chance of flooding over 30 yrs
- 0.0%
- Est. flood insurance / yr
- $507 – $1,088
Fire risk 1/10 · Minimal
- Est. fire insurance / yr
- $947 – $1,759
Heat risk 9/10 · Severe
- Hot days now (above 107°F)
- 6 days/yr
- Hot days in 30 yrs
- 17 days/yr
Wind risk 9/10 · Severe
- Chance of severe wind over 30 yrs
- 99.0%
Air-quality risk 4/10 · Minor
- Unhealthy air days now
- 6 days/yr
- Unhealthy air days in 30 yrs
- 6 days/yr
Risk factors via First Street. Map © Google.
Why this score? — see what drove the F grade
The composite is a weighted blend of 9 inputs, each scored 0–100. Each bar is that input's sub-score; the figure is the points it added to the 100-point composite (weight × sub-score).
- Cash flow +12.0/30.0
- Livability +4.2/5.0
- 1% rule +3.9/10.0
- Schools +3.9/10.0
- DSCR +3.5/10.0
- Rent growth +3.0/5.0
- Condition / age +2.5/5.0
- ARV discount +0.0/15.0
- Appreciation +0.0/10.0
$125,000
🖨 Deal sheet (PDF) 📄 Offer letter ✓ Due diligence
Listing remarks MLS
Great Opportunity - 3 Bed / 2 Bath Home in Jacksonville. This well-maintained home offers a fantastic opportunity for investors or first-time homebuyers. Featuring a spacious layout, ceiling fans throughout, a carport, and a driveway, this property combines comfort and functionality. Located in a convenient Jacksonville area, it's perfect for those seeking a move-in ready home with strong potential. Don't miss your chance to own this charming and affordable property!
Key facts
- 5,227 sq ft lot
- Parking
- Built 1973
Property features AI
Finance
- HOA & community: Not a senior community
Exterior
- Parking: Assigned covered parking; 1-car carport
- Utilities: Public sewer; Cable available; Electricity available; Water available
- Home design: Single family residence; North-facing
- Construction: Shingle roof
- Exterior features: Front porch; Asphalt road access; Lot approximately 0.12 acres
Interior
- Kitchen: Electric range; Microwave; Refrigerator
- Bedrooms: 3 bedrooms (all on the first floor)
- Flooring: Tile flooring
- Bathrooms: 2 full bathrooms
- Heating & cooling: Central heating; Central air conditioning
- Interior features: Ceiling fans; Primary bathroom with tub/shower; Primary bedroom downstairs; Seven total rooms
- Laundry & utility: Laundry located in the carport
Neighborhood map
What this means for you Summary
Snapshot
- This is a 3-bed/2.0-bath single-family listed at $125k.
Deal economics
- At list price, monthly cash flow is $-30 ($-363/yr) — negative.
- To cash-flow at today's rent, offer at most $120k (4.3% below list).
- To meet the 1% rule (rent ≥ 1% of price), the offer needs to be $111k (10.9% below list).
- Recommended offer: $110k (12.0% below list) — sets the bar for market timing.
- Cap rate 6.0% vs local median 4.0% in Jacksonville — top-decile yield for the area; either an underpriced asset or a hidden risk that comps aren't pricing in. Stress-test before assuming the spread holds.
Location & tenants
- Location reads 83/100 on livability (#50 in FL, #911 nationally) — a professional / high-income tenant draw. Strengths: amenities A+, commute A+, housing A+.
- Duval (urban): math 46% / reading 45% proficiency, ranked #48 of 73 in FL (top 66%) — families likely to look elsewhere, expect single-tenant / working-renter base with shorter leases.
- Market conditions: Rents rising (+1.8%/yr); 394 active listings in the ZIP; 40 comparable units currently listed for rent nearby; rentals at typical pace (median 25d on market — plan ~3-4 weeks tenant-placement turnaround); lower-income renter base — watch delinquency; 6,503 units permitted in Duval County in 2024 (1,131 in 5+ unit buildings).
- This rent runs 44% of the median local income ($31k/yr) — at the standard rent-burdened threshold; future hikes will face affordability resistance.
Forward outlook
- Local home prices are declining (-3.0%/yr); year-one equity from $864 of loan paydown is wiped out by about $4k of value loss. Plan a longer hold.
- Duval County population projected at +19% by 2050 — long-run rental-demand tailwind backs the buy-and-hold thesis.
Negotiation context
- It's been on market 128 days — a 12% lower offer ($110k) is reasonable based on typical stale-listing flexibility.
- 8 sale attempts since 6y ago with the ask held roughly flat each time — persistent listings suggest the price (not the market) is what's stuck; bring a comps-based counter.
Risks & watch-outs
- Climate carrying-cost: severe wind risk, 99% chance of damaging wind over 30y; extreme-heat days projected 6→17/yr by 2055 (HVAC capex compounding) — expect insurance premiums to compound above CPI over the hold.
Questions for the listing agent
- What do current leases actually rent for vs. the listed asking? Can we see a recent rent roll and the last 12 months of T-12 income?
- It's been on market 128 days. Have you received any prior offers? Is the seller open to a 12% concession, seller financing, or rate buy-down credit?
- Built in 1973 — when were the roof, HVAC, electrical panel, plumbing, and water heater last replaced?
- Why hasn't it sold? Are there any deal-killer items the seller is aware of (foundation, flood, title, zoning, code violations)?
- Is there a deadline driving the sale (1031 exchange, divorce, estate, relocation)? That informs how much negotiation room exists.
- Schools are B-rated — typically a magnet for longer-tenancy family renters. What's the average tenant stay here, and is there a school-zone premium baked into asking?
- The area grade is low — what's the realistic commute time and amenity access for the typical tenant pool here? Any planned neighborhood developments (good or bad) we should know about?
- What's the average days-on-market for RENTAL listings here right now (not sales)? A rising rental-DOM trend means longer vacancies and softer asking-rent achievability than the comps imply.
- What's the recent tenant-quality profile in this submarket — average credit score on applications, eviction rate, late-payment / NSF rate, and stable-employment percentage? A property-management company in the area should have these aggregated.
- How much new for-sale + rental construction is in the pipeline within 1–3 miles? Heavy new supply typically softens prices + rents 12–24 months out; constrained supply supports both.
Investment metrics
- 1% rule
- 0.89% ✗
- Cap rate
- 6.00%
- Cash-on-cash
- -1.04%
- DSCR
- 0.95
- GRM
- 9.4
CMA / ARV
- ARV (on-the-fly)
- $87,360
- Comps found
- 12
Show comp detail 12 sales within ~0.75 mi
| Address | Dist | Beds/Ba | Sqft | Sold | Price | $/sf | Match |
|---|---|---|---|---|---|---|---|
| 1323 W 30th St | 0.31mi | 3/1.0 | 962 (+0%) | 1mo | $115,000 | $120 | 81 |
| 1596 W 30th St | 0.10mi | 3/2.0 | 1,052 (+10%) | 4mo | $180,017 | $171 | 76 |
| 1204 W 29th St | 0.50mi | 3/1.0 | 960 (0%) | 2mo | $50,000 | $52 | 70 |
| 1279 W 20th St | 0.65mi | 2/1.0 (-1) | 962 (+0%) | 2mo | $87,500 | $91 | 59 |
| 1901 Pullman Ct | 0.74mi | 2/1.0 (-1) | 969 (+1%) | 0mo | $98,000 | $101 | 54 |
| 4318 Bessie Cir W | 0.45mi | 3/1.0 | 864 (-10%) | 5mo | $117,200 | $136 | 54 |
| 5352 Dodge Rd | 0.60mi | 3/2.0 | 1,050 (+9%) | 3mo | $75,000 | $71 | 54 |
| 1751 W 20th St | 0.58mi | 2/1.0 (-1) | 880 (-8%) | 2mo | $27,500 | $31 | 49 |
| 1125 W 29th St | 0.60mi | 3/1.0 | 864 (-10%) | 4mo | $73,000 | $84 | 48 |
| 2715 Myrtle Ave N | 0.75mi | 2/1.0 (-1) | 900 (-6%) | 3mo | $98,000 | $109 | 43 |
| 1447 20th St W | 0.55mi | 2/1.0 (-1) | 1,094 (+14%) | 4mo | $80,000 | $73 | 39 |
| 1076 W 32nd St | 0.64mi | 2/1.0 (-1) | 825 (-14%) | 2mo | $48,000 | $58 | 36 |
Match score weights: distance 35% · size 25% · config 20% · recency 20%. Top-matched comps best support the ARV.
Projected returns pro-forma
-3.0% appreciation · 1.81% rent growth · sell at horizon
- IRR
- -19.4%
- Equity multiple
- 0.33×
- Total profit
- $-23,456
- Equity at exit
- $18,638
- IRR
- -14.8%
- Equity multiple
- 0.20×
- Total profit
- $-28,004
- Equity at exit
- $10,808
Cash invested: $35,000 (down + closing). Projections, not guarantees.
Landlord ↔ Tenant lean methodology
- Overall (STATE)
- 87 Strongly Landlord-Friendly
- State Florida
- 87 Strongly Landlord-Friendly · R+3
- County
- — inherits STATE
- City
- — inherits STATE
ZIP-level market 32209
- Home prices YoY
- -22.1%
- Rents YoY
- 1.8%
- Active inventory
- 394
- Price-to-rent
- 9.4×
Monthly cashflow live
- Estimated rent
- $1,114 high interval (Pro) →
- Mortgage (P&I)
- −$656
- Tax from tax record
- −$203 /mo · $2,432/yr
- Insurance
- −$52
- HOA
- −$0
- Vacancy / Maint / Mgmt
- −$234
- Net cashflow
- $-30
Break-even live
Sensitivity live
| Price | -10% $40 | -5% $5 | +0% $-30 | +5% $-66 | +10% $-101 |
|---|---|---|---|---|---|
| Rent | -10% $-118 | -5% $-74 | +0% $-30 | +5% $14 | +10% $58 |
| Rate | -1.0pp $33 | -0.5pp $2 | base $-30 | +0.5pp $-63 | +1.0pp $-96 |
UW: 25.0% down · 7.5% · 30yr · 1.5% tax · 5.0% vac · 8.0% maint · 8.0% mgmt
Financing live
Cash to close
- Down payment
- $31,250
- Closing costs
- $3,750
- Reserves months
- —
- Total cash needed
- —
Loan-product check · same deal, 3 products live
Conventional
25% down · 7.5% · 30yr
- Down + closing
- —
- Monthly P&I
- —
- Monthly cashflow
- —
- DSCR
- —
- Eligible?
- —
Personal DTI + credit; lowest rate.
DSCR
20% down · 8.5% · 30yr
- Down + closing
- —
- Monthly P&I
- —
- Monthly cashflow
- —
- DSCR
- —
- Eligible?
- —
No personal income docs; deal must DSCR.
Hard money
10% down · 12.0% · 12mo
- Down + closing
- —
- Monthly P&I
- —
- Monthly cashflow
- —
- DSCR
- —
- Eligible?
- —
Short-term bridge; refi at stabilization.
Rent comps 40 comps
| Address | Beds | Baths | Sqft | Rent | $/sqft | DOM | Units | Dist |
|---|---|---|---|---|---|---|---|---|
| 1584 W 31st St Unit 3 Jacksonville, FL | 2.0 | 1.0 | 832 | $900 | $1.08 | 24d | 1 | 0.06mi |
| 1551 W 33rd St #2 Jacksonville, FL | 2.0 | 1.0 | 842 | $795 | $0.94 | 21d | 1 | 0.07mi |
| 1599 W 30th St Unit B Jacksonville, FL | 2.0 | 1.0 | 780 | $1,150 | $1.47 | 15d | 1 | 0.09mi |
| 4114 Moncrief Rd Jacksonville, FL | 2.0 | 1.0 | 821 | $975 | $1.19 | 8d | 1 | 0.18mi |
| 4114 Moncrief Rd Unit 2 Jacksonville, FL | 2.0 | 1.0 | 821 | $1,050 | $1.28 | 24d | 1 | 0.18mi |
| 1556 W 28th St Jacksonville, FL | 2.0 | 1.0 | 682 | $875 | $1.28 | 11d | 1 | 0.19mi |
| 1653 W 35th St Jacksonville, FL | 2.0 | 1.0 | 800 | $825 | $1.03 | 24d | 1 | 0.22mi |
| 1636 W 28th St Jacksonville, FL | 3.0 | 2.0 | 912 | $1,375 | $1.51 | 24d | 1 | 0.22mi |
| 1417 W 31st St Jacksonville, FL | 3.0 | 1.0 | 880 | $1,100 | $1.25 | 2d | 1 | 0.23mi |
| 1625 W 26th St Jacksonville, FL | 2.0 | 1.0 | 750 | $800 | $1.07 | 2d | 1 | 0.27mi |
| 1625 W 26th St Unit 4 Jacksonville, FL | 2.0 | 1.0 | 750 | $900 | $1.20 | 24d | 1 | 0.27mi |
| 1625 W 26th St Unit 2 Jacksonville, FL | 2.0 | 1.0 | 750 | $800 | $1.07 | 24d | 1 | 0.27mi |
| 1737 W 28th St Jacksonville, FL | 3.0 | 1.0 | 1105 | $700 | $0.63 | 24d | 1 | 0.28mi |
| 1437 W 26th St Jacksonville, FL | 2.0 | 1.0 | 644 | $650 | $1.01 | 24d | 1 | 0.32mi |
| 1316 W 31st St Jacksonville, FL | 2.0 | 1.0 | 906 | $998 | $1.10 | 24d | 1 | 0.33mi |
| 1839 W 30th St Jacksonville, FL | 3.0 | 1.0 | 828 | $1,050 | $1.27 | 24d | 1 | 0.34mi |
| 4813 Moncrief Rd Jacksonville, FL | 2.0–3.0 | 1.0 | 755 | $920 | $1.22 | 3d | 8 | 0.38mi |
| 1863 W 29th St Jacksonville, FL | 3.0 | 2.0 | 956 | $1,190 | $1.24 | 22d | 1 | 0.38mi |
| 1830 W 27th St Jacksonville, FL | 3.0 | 2.0 | 952 | $1,375 | $1.44 | 24d | 1 | 0.40mi |
| 1645 W 23rd St Unit 2 Jacksonville, FL | 3.0 | 1.0 | 912 | $1,275 | $1.40 | 24d | 1 | 0.42mi |
| 1363 W 24th St Jacksonville, FL | 2.0 | 1.0 | 660 | $995 | $1.51 | 5d | 1 | 0.44mi |
| 1842 W 26th St Jacksonville, FL | 3.0 | 2.0 | 933 | $1,200 | $1.29 | 24d | 1 | 0.44mi |
| 1526 W 22nd St Jacksonville, FL | 2.0 | 1.0 | 624 | $900 | $1.44 | 17d | 1 | 0.47mi |
| 1593 W 21st St Jacksonville, FL | 2.0 | 1.0 | 805 | $922 | $1.15 | 24d | 1 | 0.49mi |
| 1220 W 28th St Jacksonville, FL | 3.0 | 1.0 | 1122 | $1,299 | $1.16 | 24d | 1 | 0.50mi |
| 1196 W 30th St Jacksonville, FL | 2.0 | 1.0 | 875 | $880 | $1.01 | 18d | 1 | 0.51mi |
| 1201 W 27th St Jacksonville, FL | 3.0 | 2.0 | 1120 | $1,145 | $1.02 | 24d | 1 | 0.54mi |
| 5350 Dodge Rd Jacksonville, FL | 3.0 | 1.0 | 1000 | $1,500 | $1.50 | 24d | 1 | 0.56mi |
| 5352 Dodge Rd Jacksonville, FL | 3.0 | 2.0 | 1050 | $1,261 | $1.20 | 24d | 1 | 0.58mi |
| 1173 W 27th St Jacksonville, FL | 3.0 | 1.0 | 1080 | $1,145 | $1.06 | 14d | 1 | 0.58mi |
| 1359 W 20th St Jacksonville, FL | 2.0 | 1.0 | 901 | $1,134 | $1.26 | 18d | 1 | 0.61mi |
| 1803 W 44th St Unit 1803 Jacksonville, FL | 2.0 | 1.0 | 750 | $950 | $1.27 | 8d | 1 | 0.61mi |
| 1823 W 44th St Jacksonville, FL | 3.0 | 2.0 | 1066 | $1,500 | $1.41 | 24d | 1 | 0.63mi |
| 1968 W 23rd St Unit Main Jacksonville, FL | 3.0 | 2.0 | 1106 | $1,400 | $1.27 | 22d | 1 | 0.63mi |
| 1104 W 29th St Unit 1104 Jacksonville, FL | 2.0 | 1.0 | 624 | $850 | $1.36 | 24d | 1 | 0.65mi |
| 1971 W 22nd St Jacksonville, FL | 3.0 | 1.0 | 1094 | $1,095 | $1.00 | 8d | 1 | 0.65mi |
| 1145 W 25th St Unit 1 Jacksonville, FL | 2.0 | 1.0 | 676 | $775 | $1.15 | 18d | 1 | 0.65mi |
| 3902 Stuart St Jacksonville, FL | 2.0 | 2.0 | 1114 | $1,050 | $0.94 | 24d | 1 | 0.67mi |
| 1185 W 22nd St Unit U Jacksonville, FL | 2.0 | 1.0 | 900 | $850 | $0.94 | 8d | 1 | 0.68mi |
| 1124 W 25th St #4 Jacksonville, FL | 2.0 | 1.0 | 676 | $1,000 | $1.48 | 24d | 1 | 0.69mi |
Listing history 8 events
-
2026-06-18days on market $125,000 Active 128 DOM
-
2026-06-17days on market $125,000 Active 127 DOM
-
2026-06-16days on market $125,000 Active 126 DOM
-
2026-06-15days on market $125,000 Active 125 DOM
-
2026-06-10days on market $125,000 Active 119 DOM
-
2026-06-08days on market $125,000 Active 118 DOM
-
2026-06-07remarks 512-char remark
-
2026-06-07$125,000 Active 117 DOM
ⓘ Source: listings_history table (triggers on properties + properties_extension) + one-shot
backfill from property_details.listing_events for pre-trigger history.
Tax reassessment forecast FL · Resets to sale price
- Current annual tax
- $2,432 · $203/mo
- Projected year-2 tax
- $2,432 · $203/mo
- Expected delta
- $0/yr ($0/mo · 0.0%)
ⓘ Screening estimate from a state-policy table — verify with the county assessor before closing.
Climate risk First Street
- Flood 1/10 Low FEMA zone X (unshaded) · 0% chance over 30 yrs
- Wildfire 1/10 Low
- Heat 9/10 Extreme 6 d/yr ≥107°F today · 17 d/yr by 30 yrs out
- Wind 9/10 Extreme 99% chance of damaging wind over 30 yrs
- Air quality 4/10 Moderate 6 unhealthy d/yr today · 6 by 30 yrs out
Nearby sold comps map
Loading sold comps map…
Walkable amenities ~0.75 mi
Loading nearby amenities…
Taxation est. · year 1
- Rental income
- $13,367
- − Mortgage interest
- −$7,002
- − Property taxes
- −$2,432
- − Insurance
- −$625
- − Repairs & maintenance
- −$1,069
- − Management
- −$1,069
- − Depreciation
- −$3,636
- Taxable loss
- −$2,467
- Est. tax savings @ 24.0%
- +$592
- After-tax cash flow
- $229/yr
For passive investors: Depreciation is non-cash, so a rental often shows a tax loss while cash-flowing — sheltering income. Rental losses are passive: they offset passive income freely, and up to $25,000/yr can offset ordinary (W-2) income if you actively participate and your MAGI is under $100k (phasing out to $0 by $150k); unused losses carry forward. On sale, claimed depreciation is recaptured at up to 25%, and gains may owe capital-gains tax (a 1031 exchange can defer both). Figures are a year-1 estimate at your 24.0% rate — not tax advice; consult a CPA.
Schools (NCES district)
- District
- Duval
- NCES district ID
- 1200480
- Math proficiency
- 46% ▼ -11.00%
- Reading proficiency
- 45% ▼ -4.00%
- Median HH income
- $48,987
- Composite
- 38.97/100
- National rank
- #4076
- State rank
- #48 of 73 in FL
Livability — Jacksonville
- Score
- 83/100
- State rank
- #50
- US rank
- #911
Category grades
Schools grade is shown separately in the Schools card above.
Census & demographics
- Census place
- Jacksonville, FL
- County
- Duval County · 1,015,274 people
- City population
- 979,034
- Metro
- Jacksonville, FL
- Population (ZIP)
- 34,657
- Household income
- $30,514
- Rent vs Own
- Severe rent burden
- 2921.0
Population outlook (Duval County) Hauer SSP2
- Today (2025)
- 1,013,010 people
- By 2030
- 1,059,228 · +4.6%
- By 2040
- 1,141,439 · +12.7%
- By 2050
- 1,205,258 · +19.0%
- By 2075
- 1,324,282 · +30.7%
- By 2100
- 1,319,620 · +30.3%
Race, ethnicity, and origin ACS 2023
- Neighborhood character
- Predominantly Black (88%)
- Race & ethnicity
- Black 88% White 5% Hispanic / Latino 5% Two or more races 2%
- Hispanic origin (detail)
- Puerto Rican 3%
- Common ancestry
- Hispanic 1% Romanian 1%
- Foreign-born
- 3% · Canada
- Languages at home
- 95% English-only · Spanish 4% French/Haitian/Cajun 1%
Political lean MEDSL · Duval
- 2024 margin
- Toss-up / Even · D 48.7% · R 50.1% · Other 1.2%
- 2008→2024 swing
- +0.4pp no change · 2008: -1.9pp · 2024: -1.5pp
- All cycles
- 2024: R+1.5 2020: D+3.8 2016: R+1.5 2012: R+3.6 2008: R+1.9
Not yet ingested
- Civics
- —
Market trends
- HPI YoY
- ▼ -53.92%
- Current HPI
- 189.5977
- Rent YoY
- ▲ 1.81%
- Metro
- Jacksonville, FL
- State GDP YoY
- ▲ 3.28%
- F500 in state
- 36
Industry mix (Fortune 500 HQ in FL)
| Industry | F500 HQs | Revenue |
|---|---|---|
| Industrial Technology | 2 | $29B |
|
||
| Insurance | 2 | $17B |
|
||
| Retail | 1 | $60B |
|
||
| Technology Distribution | 1 | $58B |
|
||
| Homebuilding | 1 | $35B |
|
||
| Technology Manufacturing | 1 | $35B |
|
||
Price history
+1107.7% since first listed23 events — show timeline
- 2026-06-03 Relisted — realMLS
- 2026-05-12 Listing Removed — realMLS
- 2026-01-19 Listed $125,000 realMLS
- 2026-01-09 Listing Removed — realMLS
- 2025-10-31 Price Changed $125,000 realMLS
- 2025-07-28 Price Changed $129,000 realMLS
- 2025-05-12 Listed $133,000 realMLS
- 2025-03-06 Rental Removed $1,200 BUILDIUM
- 2025-02-26 Listed for Rent $1,200 BUILDIUM
- 2024-06-20 Rental Removed $1,200 BUILDIUM
- 2024-06-13 Listed for Rent $1,200 BUILDIUM
- 2023-10-12 Rental Removed $1,150 BUILDIUM
- 2023-09-14 Listed for Rent $1,150 BUILDIUM
- 2022-07-18 Price Changed $1,100 BUILDIUM
- 2020-10-21 Sold (MLS) $112,000 realMLS
- 2020-09-15 Pending — realMLS
- 2020-09-15 Price Changed $119,000 realMLS
- 2020-09-14 Listed $114,000 realMLS
- 2020-07-22 Sold (Public Records) $54,000 Public Records
- 2020-06-22 Sold (MLS) $54,000 realMLS
- 2020-06-12 Pending — realMLS
- 2020-05-13 Listed $60,000 realMLS
- 1980-10-21 Sold (Public Records) $10,350 Public Records
Property tax history
+10.9%/yrLatest (2025): $2,432 · +16.1% YoY. Source: county tax records.
Cash-flow waterfall
monthlySold comps — $/sqft
last 12 mo · ≤1 miLoading sold comps…