 🏷️ Likely Rental
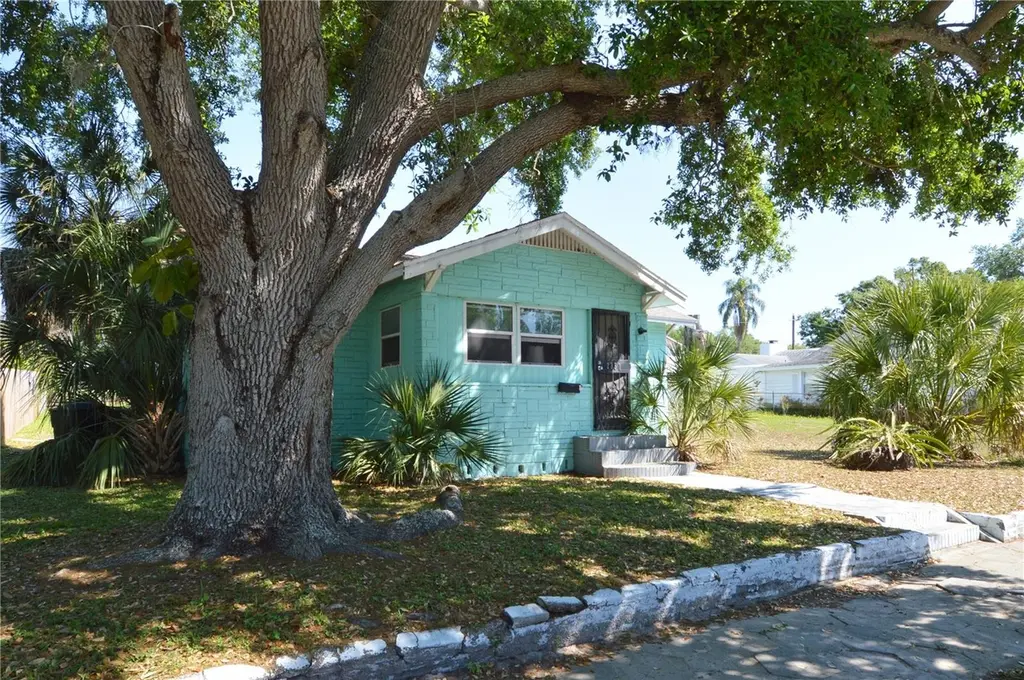
2351 25th Ave S · St. Petersburg, FL
Flood risk 1/10 · Minimal
- FEMA flood zone
- X (unshaded)
- Chance of flooding over 30 yrs
- 0.0%
- Est. flood insurance / yr
- $507 – $1,088
Fire risk 1/10 · Minimal
- Est. fire insurance / yr
- $947 – $1,759
Heat risk 10/10 · Severe
- Hot days now (above 106°F)
- 7 days/yr
- Hot days in 30 yrs
- 25 days/yr
Wind risk 10/10 · Severe
- Chance of severe wind over 30 yrs
- 99.0%
Air-quality risk 3/10 · Minor
- Unhealthy air days now
- 3 days/yr
- Unhealthy air days in 30 yrs
- 3 days/yr
Risk factors via First Street. Map © Google.
Why this score? — see what drove the D+ grade
The composite is a weighted blend of 9 inputs, each scored 0–100. Each bar is that input's sub-score; the figure is the points it added to the 100-point composite (weight × sub-score).
- ARV discount +15.0/15.0
- Cash flow +14.2/30.0
- DSCR +4.3/10.0
- Schools +4.3/10.0
- 1% rule +3.6/10.0
- Livability +2.5/5.0
- Condition / age +2.5/5.0
- Rent growth +2.3/5.0
- Appreciation +0.0/10.0
$255,000
🖨 Deal sheet 📄 Offer letter ✓ Due diligence
Listing remarks
Welciome to St Petersburg! This home will make a great primary residence or excellent investment opportunity! Currently tenant-occupied, the home offers immediate rental income, making it a strong addition to any portfolio. Situated in a developing area with continued growth, the property features solid bones and long-term upside potential. Ideal for investors seeking cash flow from day one, with the option to update or reposition in the future. Conveniently located near downtown St. Pete, shopping, dining, and major roadways. Don’t miss this opportunity to secure a performing asset in a rapidly improving neighborhood!
Key facts
- Solid bones
- Cash flow
- Developing area
Tags
Property features AI
Finance
- Other: Unfurnished; No lease restrictions indicated
- HOA & community: No association (HOA) indicated
Exterior
- Parking: 2-car garage
- Utilities: Public water; Public sewer; Electricity available; Cable available
- Home design: Single family residence; One story; Faces south; Residential property
- Construction: Frame construction with wood siding; Shingle roof; Crawlspace foundation; Built on a lot of about 0.13 acres
- Exterior features: Awning(s); Sidewalk; Asphalt road frontage; Lot dimensions approximately 50 x 108
Interior
- Kitchen: Range; Refrigerator
- Bedrooms: 3 bedrooms
- Flooring: Ceramic tile; Wood
- Bathrooms: 1 full bathroom
- Heating & cooling: Central heating (electric); Central air conditioning
- Interior features: Eat-in kitchen; Kitchen/family room combo; Living room/dining room combo
- Laundry & utility: Laundry inside
Neighborhood map
What this means for you Summary
Snapshot
- This is a 3-bed/1.0-bath single-family listed at $255k.
Deal economics
- At list price, monthly cash flow is $43 ($518/yr) — positive.
- The deal already cash-flows at list — no discount required.
- To meet the 1% rule (rent ≥ 1% of price), the offer needs to be $219k (14.1% below list).
- Recommended offer: $219k (14.1% below list) — sets the bar for 1% rule.
- Cap rate 6.5% vs local median 2.6% in St. Petersburg — top-decile yield for the area; either an underpriced asset or a hidden risk that comps aren't pricing in. Stress-test before assuming the spread holds.
Location & tenants
- Location reads: area grade D — affects rentability + tenant quality, not the cash-flow math above.
- Pinellas (suburban): math 51% / reading 51% proficiency, ranked #31 of 73 in FL (top 42%) — acceptable for families but not a draw, mixed tenant base, ~2y average lease.
- Market conditions: Rents soft (-0.8%/yr); 204 active listings in the ZIP; 40 comparable units currently listed for rent nearby; rentals leasing fast (median 5d on market — plan ~1-2 weeks tenant-placement turnaround); 2,676 units permitted in Pinellas County in 2024 (1,422 in 5+ unit buildings).
- This rent runs 43% of the median local income ($60k/yr) — at the standard rent-burdened threshold; future hikes will face affordability resistance.
Forward outlook
- Local home prices are declining (-3.0%/yr); year-one equity from $2k of loan paydown is wiped out by about $8k of value loss. Plan a longer hold.
- Pinellas County population projected at +14% by 2050 — modest demand growth; plan on rents tracking national, not racing it.
Negotiation context
- It's been on market 76 days — a 6% lower offer ($240k) is reasonable based on typical stale-listing flexibility.
- 5 sale attempts since 19y ago with the ask held roughly flat each time — persistent listings suggest the price (not the market) is what's stuck; bring a comps-based counter.
- Current owner paid $25k; list at $255k implies a 924% gain — meaningful room to come down on a strong offer.
Risks & watch-outs
- Watch-outs: built in 1928 — expect roof / HVAC / electrical / plumbing capex.
- Climate carrying-cost: severe wind risk, 99% chance of damaging wind over 30y; extreme-heat days projected 7→25/yr by 2055 (HVAC capex compounding) — expect insurance premiums to compound above CPI over the hold.
Questions for the listing agent
- It's been on market 76 days. Have you received any prior offers? Is the seller open to a 14% concession, seller financing, or rate buy-down credit?
- Built in 1928 — when were the roof, HVAC, electrical panel, plumbing, and water heater last replaced?
- Why hasn't it sold? Are there any deal-killer items the seller is aware of (foundation, flood, title, zoning, code violations)?
- Is there a deadline driving the sale (1031 exchange, divorce, estate, relocation)? That informs how much negotiation room exists.
- The area grade is low — what's the realistic commute time and amenity access for the typical tenant pool here? Any planned neighborhood developments (good or bad) we should know about?
- What's the average days-on-market for RENTAL listings here right now (not sales)? A rising rental-DOM trend means longer vacancies and softer asking-rent achievability than the comps imply.
- What's the recent tenant-quality profile in this submarket — average credit score on applications, eviction rate, late-payment / NSF rate, and stable-employment percentage? A property-management company in the area should have these aggregated.
- How much new for-sale + rental construction is in the pipeline within 1–3 miles? Heavy new supply typically softens prices + rents 12–24 months out; constrained supply supports both.
Investment metrics
- 1% rule
- 0.86% ✗
- Cap rate
- 6.50%
- Cash-on-cash
- 0.73%
- DSCR
- 1.03
- GRM
- 9.7
CMA / ARV
- ARV (on-the-fly)
- $318,784
- Comps found
- 12
Show comp detail 12 sales within ~0.75 mi
| Address | Dist | Beds/Ba | Sqft | Sold | Price | $/sf | Match |
|---|---|---|---|---|---|---|---|
| 2534 22nd St S | 0.19mi | 3/2.0 | 1,156 (+6%) | 5mo | $366,000 | $317 | 72 |
| 1931 24th St S | 0.33mi | 3/1.0 | 1,038 (-5%) | 10mo | $215,000 | $207 | 69 |
| 2534 19th St S | 0.41mi | 3/2.0 | 1,160 (+7%) | 2mo | $205,000 | $177 | 64 |
| 2410 26th St S | 0.17mi | 3/2.0 | 1,200 (+10%) | 12mo | $360,000 | $300 | 61 |
| 2226 Union St S | 0.28mi | 2/1.0 (-1) | 959 (-12%) | 4mo | $98,000 | $102 | 60 |
| 1710 26th Ave S | 0.57mi | 3/2.0 | 1,154 (+6%) | 2mo | $389,800 | $338 | 58 |
| 1735 26th Ave S | 0.54mi | 3/2.0 | 1,153 (+6%) | 8mo | $300,000 | $260 | 54 |
| 2703 18th St S | 0.46mi | 3/2.0 | 1,221 (+12%) | 0mo | $329,900 | $270 | 54 |
| 2487 15th Ave S | 0.69mi | 3/2.0 | 1,125 (+3%) | 6mo | $285,000 | $253 | 53 |
| 2333 22nd St S | 0.16mi | 2/2.5 (-1) | 947 (-13%) | 12mo | $320,000 | $338 | 50 |
| 2551 17th Ave S | 0.61mi | 3/2.0 | 1,176 (+8%) | 8mo | $345,000 | $293 | 47 |
| 2500 Miranda Way S | 0.67mi | 3/2.0 | 1,206 (+11%) | 5mo | $455,000 | $377 | 42 |
Match score weights: distance 35% · size 25% · config 20% · recency 20%. Top-matched comps best support the ARV.
Projected returns pro-forma
-3.0% appreciation · 0.0% rent growth · sell at horizon
- IRR
- -18.4%
- Equity multiple
- 0.37×
- Total profit
- $-45,004
- Equity at exit
- $38,021
- IRR
- -17.9%
- Equity multiple
- 0.15×
- Total profit
- $-60,508
- Equity at exit
- $22,048
Cash invested: $71,400 (down + closing). Projections, not guarantees.
Landlord ↔ Tenant lean methodology
- Overall (STATE)
- 87 Strongly Landlord-Friendly
- State Florida
- 87 Strongly Landlord-Friendly · R+3
- County
- — inherits STATE
- City
- — inherits STATE
ZIP-level market 33712
- Rents YoY
- -0.8%
- Active inventory
- 204
- Price-to-rent
- 9.7×
Monthly cashflow live
- Estimated rent
- $2,190 high interval (Pro) →
- Mortgage (P&I)
- −$1,337
- Tax from tax record
- −$244 /mo · $2,924/yr
- Insurance
- −$106
- HOA
- −$0
- Vacancy / Maint / Mgmt
- −$460
- Net cashflow
- $43
Break-even live
UW: 25.0% down · 7.5% · 30yr · 1.5% tax · 5.0% vac · 8.0% maint · 8.0% mgmt
Financing live
Cash to close
- Down payment
- $63,750
- Closing costs
- $7,650
- Reserves months
- —
- Total cash needed
- —
Loan-product check · same deal, 3 products live
Conventional
25% down · 7.5% · 30yr
- Down + closing
- —
- Monthly P&I
- —
- Monthly cashflow
- —
- DSCR
- —
- Eligible?
- —
Personal DTI + credit; lowest rate.
DSCR
20% down · 8.5% · 30yr
- Down + closing
- —
- Monthly P&I
- —
- Monthly cashflow
- —
- DSCR
- —
- Eligible?
- —
No personal income docs; deal must DSCR.
Hard money
10% down · 12.0% · 12mo
- Down + closing
- —
- Monthly P&I
- —
- Monthly cashflow
- —
- DSCR
- —
- Eligible?
- —
Short-term bridge; refi at stabilization.
Rent comps 40 comps
| Address | Beds | Baths | Sqft | Rent | $/sqft | DOM | Units | Dist |
|---|---|---|---|---|---|---|---|---|
| 2551 26th Ave S Saint Petersburg, FL | 4.0 | 2.0 | 1248 | $2,395 | $1.92 | 4d | 1 | 0.15mi |
| 2425 Auburn St S Saint Petersburg, FL | 3.0 | 2.0 | 1092 | $2,195 | $2.01 | 4d | 1 | 0.23mi |
| 2423 Auburn St S Saint Petersburg, FL | 3.0 | 2.0 | 1057 | $1,650 | $1.56 | 24d | 1 | 0.23mi |
| 2244 21st Ave S Saint Petersburg, FL | 3.0 | 1.0 | 1229 | $2,250 | $1.83 | 4d | 1 | 0.26mi |
| 1930 Walton St S Saint Petersburg, FL | 3.0 | 1.0 | 814 | $2,000 | $2.46 | 4d | 1 | 0.32mi |
| 2710 22nd Ave S Saint Petersburg, FL | 3.0 | 1.0 | 1083 | $2,450 | $2.26 | 4d | 1 | 0.32mi |
| 2435 20th St S Unit 1 St. Petersburg, FL | 4.0 | 2.0 | 1230 | $2,650 | $2.15 | 24d | 1 | 0.34mi |
| 2010 22nd St S Saint Petersburg, FL | 3.0 | 1.0 | 1036 | $1,695 | $1.64 | 4d | 1 | 0.36mi |
| 2410 18th Ave S Saint Petersburg, FL | 4.0 | 1.0 | 927 | $1,895 | $2.04 | 4d | 1 | 0.40mi |
| 2524 19th St S Saint Petersburg, FL | 4.0 | 2.0 | 1230 | $2,495 | $2.03 | 24d | 1 | 0.43mi |
| 1827 Auburn St S Saint Petersburg, FL | 3.0 | 1.0 | 1056 | $1,855 | $1.76 | 4d | 1 | 0.44mi |
| 1911 22nd Ave S St Petersburg, FL | 4.0 | 2.0 | 1424 | $3,000 | $2.11 | 2d | 1 | 0.45mi |
| 2505 18th St S Saint Petersburg, FL | 3.0 | 2.0 | 1198 | $2,350 | $1.96 | 4d | 1 | 0.46mi |
| 2621 18th St S Saint Petersburg, FL | 3.0 | 1.0 | 1114 | $2,200 | $1.97 | 24d | 1 | 0.47mi |
| 1828 20th Ave S Saint Petersburg, FL | 3.0 | 1.0 | 1015 | $1,650 | $1.63 | 24d | 1 | 0.53mi |
| 1847 19th St S Saint Petersburg, FL | 3.0 | 2.0 | 1203 | $2,295 | $1.91 | 4d | 1 | 0.54mi |
| 2245 17th Ave S Saint Petersburg, FL | 4.0 | 2.0 | 1058 | $2,400 | $2.27 | 4d | 1 | 0.60mi |
| 1901 31st St S Unit 1/2 St. Petersburg, FL | 2.0 | 1.0 | 721 | $1,950 | $2.70 | 3d | 1 | 0.67mi |
| 2231 15th Ave S Saint Petersburg, FL | 2.0 | 1.0 | 768 | $1,900 | $2.47 | 4d | 1 | 0.69mi |
| 1760 Queen St S Saint Petersburg, FL | 3.0 | 1.0 | 1004 | $2,000 | $1.99 | 4d | 1 | 0.71mi |
| 2684 Fairway Ave S Saint Petersburg, FL | 3.0 | 2.0 | 1357 | $1,900 | $1.40 | 4d | 1 | 0.74mi |
| 2547 14th Ave S Saint Petersburg, FL | 2.0 | 1.0 | 726 | $2,800 | $3.86 | 4d | 1 | 0.75mi |
| 1763 Preston St S Saint Petersburg, FL | 3.0 | 1.0 | 1158 | $2,350 | $2.03 | 24d | 1 | 0.75mi |
| 1400 21st St S Saint Petersburg, FL | 4.0 | 2.0 | 1487 | $2,970 | $2.00 | 7d | 1 | 0.77mi |
| 2728 14th Ave S St. Petersburg, FL | 3.0 | 2.0 | 1257 | $2,100 | $1.67 | 7d | 1 | 0.77mi |
| 2020 14th Ave S Unit A St. Petersburg, FL | 2.0 | 2.0 | 1000 | $1,920 | $1.92 | 7d | 1 | 0.78mi |
| 2028 14th Ave S Unit A St. Petersburg, FL | 2.0 | 2.0 | 1000 | $1,920 | $1.92 | 24d | 1 | 0.78mi |
| 3246 20th Ave S Saint Petersburg, FL | 2.0 | 1.0 | 864 | $1,795 | $2.08 | 24d | 1 | 0.80mi |
| 1920 14th Ave S Saint Petersburg, FL | 3.0 | 2.0 | 1073 | $1,865 | $1.74 | 24d | 1 | 0.81mi |
| 3301 32nd Ave S Saint Petersburg, FL | 1.0–2.0 | 1.0–2.0 | 914 | $2,750 | $3.01 | 3d | 10 | 0.81mi |
| 1361 29th St S Saint Petersburg, FL | 3.0 | 1.0 | 819 | $2,400 | $2.93 | 24d | 1 | 0.82mi |
| 1650 Prescott St S Saint Petersburg, FL | 3.0 | 1.0 | 960 | $2,100 | $2.19 | 4d | 1 | 0.85mi |
| 1771 15th Ave S Saint Petersburg, FL | 2.0 | 1.0 | 800 | $1,195 | $1.49 | 4d | 1 | 0.85mi |
| 3091 15th Ave S St. Petersburg, FL | 3.0 | 2.0 | 1000 | $2,195 | $2.19 | 24d | 1 | 0.87mi |
| 3089 15th Ave S Saint Petersburg, FL | 3.0 | 2.0 | 1000 | $2,195 | $2.19 | 4d | 1 | 0.88mi |
| 1715 14th St S St. Petersburg, FL | 2.0 | 1.0 | 1000 | $1,850 | $1.85 | 24d | 1 | 0.89mi |
| 1701 14th St S Unit A St. Petersburg, FL | 2.0 | 1.0 | 1100 | $1,950 | $1.77 | 24d | 1 | 0.90mi |
| 1320 18th Ave S Saint Petersburg, FL | 2.0 | 1.0 | 750 | $1,550 | $2.07 | 17d | 1 | 0.90mi |
| 1465 15th St S Saint Petersburg, FL | 3.0 | 1.5 | 1405 | $2,400 | $1.71 | 4d | 1 | 0.97mi |
| 1427 15th St S Saint Petersburg, FL | 3.0 | 1.0 | 1030 | $2,095 | $2.03 | 4d | 1 | 1.00mi |
Listing history 27 events
-
2026-06-18days on market $255,000 Active 76 DOM
-
2026-06-17days on market $255,000 Active 75 DOM
-
2026-06-16days on market $255,000 Active 74 DOM
-
2026-06-15days on market $255,000 Active 73 DOM
-
2026-06-13days on market $255,000 Active 71 DOM
-
2026-06-09days on market $255,000 Active 67 DOM
-
2026-06-08days on market $255,000 Active 66 DOM
-
2026-06-07days on market $255,000 Active 65 DOM
-
2026-06-04days on market $255,000 Active 62 DOM
-
2026-06-03days on market $255,000 Active 61 DOM
-
2026-06-01days on market $255,000 Active 59 DOM
-
2026-05-31days on market $255,000 Active 58 DOM
-
2026-05-09price $255,000
-
2026-04-03$265,000 Active
-
2024-12-13status Pending
-
2024-12-13historical
-
2024-09-28price $299,000
-
2024-05-21price $269,000
-
2024-03-15price $279,000
-
2023-12-18price $289,000
-
2023-10-17price $279,000
-
2023-09-01$289,000 Active
-
2010-04-30$59,000
-
2009-10-07soldstatus $24,900
-
2009-08-31$24,900
-
2008-06-13historical
-
2007-12-18$49,900
ⓘ Source: listings_history table (triggers on properties + properties_extension) + one-shot
backfill from property_details.listing_events for pre-trigger history.
Tax reassessment forecast FL · Resets to sale price
- Current annual tax
- $2,924 · $244/mo
- Projected year-2 tax
- $2,924 · $244/mo
- Expected delta
- $0/yr ($0/mo · 0.0%)
ⓘ Screening estimate from a state-policy table — verify with the county assessor before closing.
Climate risk First Street
- Flood 1/10 Low FEMA zone X (unshaded) · 0% chance over 30 yrs
- Wildfire 1/10 Low
- Heat 10/10 Extreme 7 d/yr ≥106°F today · 25 d/yr by 30 yrs out
- Wind 10/10 Extreme 99% chance of damaging wind over 30 yrs
- Air quality 3/10 Moderate 3 unhealthy d/yr today · 3 by 30 yrs out
Nearby sold comps map
Loading sold comps map…
Walkable amenities ~0.75 mi
Loading nearby amenities…
Taxation est. · year 1
- Rental income
- $26,283
- − Mortgage interest
- −$14,284
- − Property taxes
- −$2,924
- − Insurance
- −$1,275
- − Repairs & maintenance
- −$2,103
- − Management
- −$2,103
- − Depreciation
- −$7,418
- Taxable loss
- −$3,823
- Est. tax savings @ 24.0%
- +$918
- After-tax cash flow
- $1,436/yr
For passive investors: Depreciation is non-cash, so a rental often shows a tax loss while cash-flowing — sheltering income. Rental losses are passive: they offset passive income freely, and up to $25,000/yr can offset ordinary (W-2) income if you actively participate and your MAGI is under $100k (phasing out to $0 by $150k); unused losses carry forward. On sale, claimed depreciation is recaptured at up to 25%, and gains may owe capital-gains tax (a 1031 exchange can defer both). Figures are a year-1 estimate at your 24.0% rate — not tax advice; consult a CPA.
Schools (NCES district)
- District
- Pinellas
- NCES district ID
- 1201560
- Math proficiency
- 51% ▼ -5.00%
- Reading proficiency
- 51% ▼ -3.00%
- Median HH income
- $46,270
- Composite
- 43.27/100
- National rank
- #3046
- State rank
- #31 of 73 in FL
Livability — St. Petersburg
No livability data for this city. (Only ~50 U.S. cities are tracked.)
Census & demographics
- Census place
- St. Petersburg, FL
- County
- Pinellas County · 939,478 people
- City population
- 249,151
- Metro
- Tampa-St. Petersburg-Clearwater, FL
- Population (ZIP)
- 27,142
- Household income
- $60,450
- Rent vs Own
- Severe rent burden
- 1928.0
Population outlook (Pinellas County) Hauer SSP2
- Today (2025)
- 1,027,532 people
- By 2030
- 1,063,586 · +3.5%
- By 2040
- 1,125,020 · +9.5%
- By 2050
- 1,168,637 · +13.7%
- By 2075
- 1,265,188 · +23.1%
- By 2100
- 1,260,357 · +22.7%
Race, ethnicity, and origin ACS 2023
- Neighborhood character
- Predominantly Black (68%)
- Race & ethnicity
- Black 68% White 23% Two or more races 6% Hispanic / Latino 4%
- Common ancestry
- Lithuanian 1% Slovak 1% Estonian 1%
- Foreign-born
- 7% · Canada, Jamaica
- Languages at home
- 92% English-only · French/Haitian/Cajun 3% Spanish 3% Other Indo-European 1%
Political lean MEDSL · Pinellas
- 2024 margin
- Lean R (+5.2) · D 46.9% · R 52.1%
- 2008→2024 swing
- -13.5pp toward R · 2008: 8.3pp · 2024: -5.2pp
- All cycles
- 2024: R+5.2 2020: D+0.2 2016: R+1.1 2012: D+5.6 2008: D+8.3
Not yet ingested
- Civics
- —
Market trends
- HPI YoY
- ▼ -275.45%
- Current HPI
- 412.7251
- Rent YoY
- ▼ -0.77%
- Metro
- Tampa-St. Petersburg-Clearwater, FL
- State GDP YoY
- ▲ 3.28%
- F500 in state
- 36
Industry mix (Fortune 500 HQ in FL)
| Industry | F500 HQs | Revenue |
|---|---|---|
| Industrial Technology | 2 | $29B |
|
||
| Insurance | 2 | $17B |
|
||
| Retail | 1 | $60B |
|
||
| Technology Distribution | 1 | $58B |
|
||
| Homebuilding | 1 | $35B |
|
||
| Technology Manufacturing | 1 | $35B |
|
||
Price history
+411.0% since first listed15 events — show timeline
- 2026-05-09 Price Changed $255,000 Stellar MLS as Distributed by MLS Grid
- 2026-04-03 Listed $265,000 Stellar MLS as Distributed by MLS Grid
- 2024-12-13 Pending — Stellar MLS as Distributed by MLS Grid
- 2024-12-13 Listing Removed — Stellar MLS as Distributed by MLS Grid
- 2024-09-28 Price Changed $299,000 Stellar MLS as Distributed by MLS Grid
- 2024-05-21 Price Changed $269,000 Stellar MLS as Distributed by MLS Grid
- 2024-03-15 Price Changed $279,000 Stellar MLS as Distributed by MLS Grid
- 2023-12-18 Price Changed $289,000 Stellar MLS as Distributed by MLS Grid
- 2023-10-17 Price Changed $279,000 Stellar MLS as Distributed by MLS Grid
- 2023-09-01 Listed $289,000 Stellar MLS as Distributed by MLS Grid
- 2010-04-30 Listed $59,000 Stellar MLS as Distributed by MLS Grid
- 2009-10-07 Sold (MLS) $24,900 Stellar MLS as Distributed by MLS Grid
- 2009-08-31 Listed $24,900 Stellar MLS as Distributed by MLS Grid
- 2008-06-13 Listing Removed — Stellar MLS as Distributed by MLS Grid
- 2007-12-18 Listed $49,900 Stellar MLS as Distributed by MLS Grid
Property tax history
+15.0%/yrLatest (2025): $2,924 · +11.3% YoY. Source: county tax records.
Cash-flow waterfall
monthlySold comps — $/sqft
last 12 mo · ≤1 miLoading sold comps…