 5-Plex
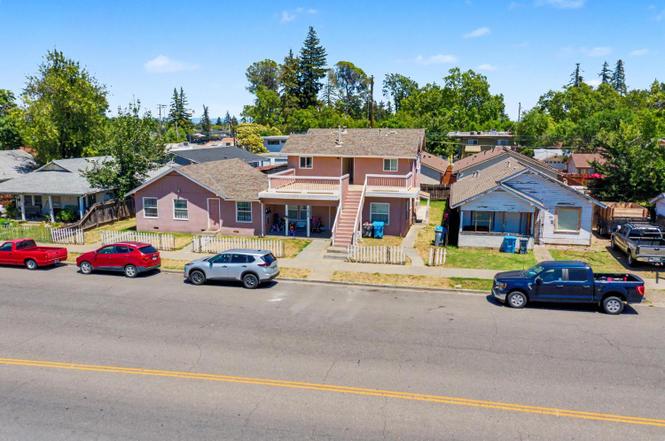
1315 E St · Marysville, CA
Flood risk 1/10 · Minimal
- FEMA flood zone
- X
- Chance of flooding over 30 yrs
- 0.0%
- Est. flood insurance / yr
- $507 – $1,088
Fire risk 8/10 · Major
- Est. fire insurance / yr
- $659 – $1,223
Heat risk 7/10 · Major
- Hot days now (above 105°F)
- 7 days/yr
- Hot days in 30 yrs
- 16 days/yr
Wind risk 1/10 · Minimal
- Chance of severe wind over 30 yrs
- —
Air-quality risk 10/10 · Severe
- Unhealthy air days now
- 26 days/yr
- Unhealthy air days in 30 yrs
- 30 days/yr
Risk factors via First Street. Map © Google.
Why this score? — see what drove the C- grade
The composite is a weighted blend of 9 inputs, each scored 0–100. Each bar is that input's sub-score; the figure is the points it added to the 100-point composite (weight × sub-score).
- Cash flow +26.0/30.0
- DSCR +8.7/10.0
- 1% rule +5.6/10.0
- Livability +3.4/5.0
- Rent growth +3.0/5.0
- Condition / age +2.5/5.0
- Schools +1.8/10.0
- ARV discount +1.1/15.0
- Appreciation +0.0/10.0
$625,000
🖨 Deal sheet 📄 Offer letter ✓ Due diligence
Multi-family units
County records classify this as Multi-Family (5+ Unit). Listing-text estimate: 5 units. confirmed
5+ unit building — per-unit beds/baths from public records are typically unavailable; the breakdown below (if shown) is an estimate from the listing text.
Listing remarks
Excellent opportunity to acquire a fully occupied 5-unit multifamily property in Marysville. The property consists of three 2-bedroom, 1-bath units and two 1-bedroom, 1-bath units, providing a desirable mix of unit types for a broad tenant base. Current gross scheduled rental income is $5,275 per month or $63,300 annually. The property features separate gas and electric meters, helping minimize owner-paid utility expenses. Recent capital improvements include a newer composition roof and dual-pane windows, reducing future maintenance concerns and improving overall efficiency. Situated on a generous 0.23-acre lot, the property offers ample outdoor space along with a detached garage/storage bu
Key facts
- Dual-pane windows
- 0.23-acre lot
- 0.23 acre lot
Tags
Property features AI
Finance
- HOA & community: No homeowners association
Exterior
- Utilities: Natural gas connected; Public water; Public sewer; Separate meters for common area, electricity, and gas
- Home design: Residential income property (apartments); Five-or-more unit building; Built in 1925; Two stories
- Construction: Composition roof; Originally built in 1925
- Exterior features: Composition roof; Regular-shaped lot
Interior
- Kitchen: Free-standing gas range; Free-standing refrigerator
- Bedrooms: Five total units: three 2-bedroom units and two 1-bedroom units; Unit breakdown — Unit 1: 2 bedrooms; Unit 2: 1 bedroom; Unit 3: 2 bedrooms; Unit 4: 1 bedroom (other unit included in totals)
- Flooring: Laminate flooring; Vinyl flooring
- Bathrooms: Each listed unit includes one full bathroom
- Heating & cooling: Wall furnace heating; Window cooling units
- Interior features: Dual-pane full windows; Balcony/Deck; Varies by unit for some features
- Laundry & utility: Laundry arrangements vary by unit
Neighborhood map
What this means for you Summary
Snapshot
- This is a 3×2bd/1.0ba + 2×1bd/1.0ba units multifamily listed at $625k.
Deal economics
- At list price, monthly cash flow is $2k ($19k/yr) — positive. Per door: $311/mo.
- The deal already cash-flows at list — no discount required.
- Meets the 1% rule at list price ($7k rent vs $625k).
- Cap rate 9.3% vs local median 3.7% in Marysville — top-decile yield for the area; either an underpriced asset or a hidden risk that comps aren't pricing in. Stress-test before assuming the spread holds.
Location & tenants
- Location reads 68/100 on livability (#293 in CA) — a middle-class / working-renter tenant base. Strengths: commute A+, housing A+; Watch: schools C-, crime F, amenities F.
- Marysville Joint Unified (suburban): math 14% / reading 28% proficiency, ranked #455 of 517 in CA (top 88%) — low school quality limits family demand, transient renter base, plan for 1-2y turnover; 68% free/reduced lunch — lower-income household profile, screen leases tightly.
- Market conditions: Rents rising (+1.9%/yr); 254 active listings in the ZIP; 750 units permitted in Yuba County in 2024 (41 in 5+ unit buildings).
- At $6,642/mo this rent would consume 114% of the median local household income ($70k/yr) (locally 1190% of renters already pay >50% of income on rent) — very limited rent-growth headroom before tenants either downsize or default.
Forward outlook
- Local home prices are declining (-3.0%/yr); year-one equity from $4k of loan paydown is wiped out by about $19k of value loss. Plan a longer hold.
- Yuba County population projected to shrink 3% by 2050 — rents likely to lag national; underwrite the cash flow, not the appreciation.
Negotiation context
- Only 9 days on market — expect competitive offers; lowballing is unlikely to land.
Risks & watch-outs
- Watch-outs: built in 1925 — expect roof / HVAC / electrical / plumbing capex.
- Climate carrying-cost: severe wildfire risk; extreme-heat days projected 7→16/yr by 2055 (HVAC capex compounding) — expect insurance premiums to compound above CPI over the hold.
Questions for the listing agent
- Can we see the unit-by-unit rent roll, current vacancy, and any below-market leases? What's the average tenancy length?
- What capital expenditures (roof, boiler, parking lot, exteriors) have been made in the last 5 years, and what's planned in the next 2?
- Built in 1925 — when were the roof, HVAC, electrical panel, plumbing, and water heater last replaced?
- Is there a deadline driving the sale (1031 exchange, divorce, estate, relocation)? That informs how much negotiation room exists.
- Crime grade is F in this area — have there been break-ins, vandalism, or insurance claims at this property in the last 3 years? What carrier currently insures it and at what premium?
- What's the average days-on-market for RENTAL listings here right now (not sales)? A rising rental-DOM trend means longer vacancies and softer asking-rent achievability than the comps imply.
- What's the recent tenant-quality profile in this submarket — average credit score on applications, eviction rate, late-payment / NSF rate, and stable-employment percentage? A property-management company in the area should have these aggregated.
- How much new apartment / multifamily construction is in the pipeline within 1–3 miles? Heavy new supply (>2% of stock underway) typically softens rents 12–24 months out; light construction supports rent growth.
Investment metrics
- 1% rule
- 1.06% ✓
- Cap rate
- 9.28%
- Cash-on-cash
- 10.65%
- DSCR
- 1.47
- GRM
- 7.8
CMA / ARV
- ARV (on-the-fly)
- $547,092
- Comps found
- 1
Show comp detail 1 sale within ~0.75 mi
| Address | Dist | Beds/Ba | Sqft | Sold | Price | $/sf | Match |
|---|---|---|---|---|---|---|---|
| 804 H St | 0.49mi | 6/5.0 | 3,068 (-12%) | 2mo | $480,000 | $156 | 54 |
Match score weights: distance 35% · size 25% · config 20% · recency 20%. Top-matched comps best support the ARV.
Projected returns pro-forma
-3.0% appreciation · 1.87% rent growth · sell at horizon
- IRR
- -1.5%
- Equity multiple
- 0.94×
- Total profit
- $-10,095
- Equity at exit
- $93,190
- IRR
- 7.0%
- Equity multiple
- 1.50×
- Total profit
- $87,494
- Equity at exit
- $54,039
Cash invested: $175,000 (down + closing). Projections, not guarantees.
Landlord ↔ Tenant lean methodology
- Overall (STATE)
- 18 Strongly Tenant-Friendly
- State California
- 18 Strongly Tenant-Friendly · D+13
- County
- — inherits STATE
- City
- — inherits STATE
ZIP-level market 95901
- Rents YoY
- 1.9%
- Active inventory
- 254
- Price-to-rent
- 38.1×
Monthly cashflow live
- Estimated rent
- $6,642 high interval (Pro) →
- Mortgage (P&I)
- −$3,278
- Tax from tax record
- −$156 /mo · $1,870/yr
- Insurance
- −$260
- HOA
- −$0
- Vacancy / Maint / Mgmt
- −$1,395
- Net cashflow
- $1,553
Break-even live
5-unit breakdown (identical units grouped — click to expand)
| Units | Beds | Baths | Est. rent |
|---|---|---|---|
| 3× units | 2 | 1 | $4,101 |
| #1 | 2 | 1 | $1,367 |
| #2 | 2 | 1 | $1,367 |
| #3 | 2 | 1 | $1,367 |
| 2× units | 1 | 1 | $2,542 |
| #4 | 1 | 1 | $1,271 |
| #5 | 1 | 1 | $1,271 |
| Total (5 units) | $6,642 | ||
UW: 25.0% down · 7.5% · 30yr · 1.5% tax · 5.0% vac · 8.0% maint · 8.0% mgmt
Financing live
Cash to close
- Down payment
- $156,250
- Closing costs
- $18,750
- Reserves months
- —
- Total cash needed
- —
Loan-product check · same deal, 3 products live
Conventional
25% down · 7.5% · 30yr
- Down + closing
- —
- Monthly P&I
- —
- Monthly cashflow
- —
- DSCR
- —
- Eligible?
- —
Personal DTI + credit; lowest rate.
DSCR
20% down · 8.5% · 30yr
- Down + closing
- —
- Monthly P&I
- —
- Monthly cashflow
- —
- DSCR
- —
- Eligible?
- —
No personal income docs; deal must DSCR.
Hard money
10% down · 12.0% · 12mo
- Down + closing
- —
- Monthly P&I
- —
- Monthly cashflow
- —
- DSCR
- —
- Eligible?
- —
Short-term bridge; refi at stabilization.
Listing history 8 events
-
2026-06-19days on market $625,000 Active 9 DOM
-
2026-06-18days on market $625,000 Active 8 DOM
-
2026-06-17days on market $625,000 Active 7 DOM
-
2026-06-16days on market $625,000 Active 6 DOM
-
2026-06-15days on market $625,000 Active 5 DOM
-
2026-06-14days on market $625,000 Active 3 DOM
-
2026-06-13remarks 699-char remark
-
2026-06-13$625,000 Active 2 DOM
ⓘ Source: listings_history table (triggers on properties + properties_extension) + one-shot
backfill from property_details.listing_events for pre-trigger history.
Tax reassessment forecast CA · Resets to sale price
- Current annual tax
- $1,870 · $156/mo
- Projected year-2 tax
- $4,750 · $396/mo
- Expected delta
- +$2,880/yr (+$240/mo · 154.0%)
ⓘ Screening estimate from a state-policy table — verify with the county assessor before closing.
Climate risk First Street
- Flood 1/10 Low FEMA zone X · 0% chance over 30 yrs
- Wildfire 8/10 Severe
- Heat 7/10 Severe 7 d/yr ≥105°F today · 16 d/yr by 30 yrs out
- Wind 1/10 Low
- Air quality 10/10 Extreme 26 unhealthy d/yr today · 30 by 30 yrs out
Nearby sold comps map
Loading sold comps map…
Walkable amenities ~0.75 mi
Loading nearby amenities…
Taxation est. · year 1
- Rental income
- $79,704
- − Mortgage interest
- −$35,010
- − Property taxes
- −$1,870
- − Insurance
- −$3,125
- − Repairs & maintenance
- −$6,376
- − Management
- −$6,376
- − Depreciation
- −$18,182
- Taxable income
- $8,765
- Est. tax owed @ 24.0%
- −$2,104
- After-tax cash flow
- $16,537/yr
For passive investors: Depreciation is non-cash, so a rental often shows a tax loss while cash-flowing — sheltering income. Rental losses are passive: they offset passive income freely, and up to $25,000/yr can offset ordinary (W-2) income if you actively participate and your MAGI is under $100k (phasing out to $0 by $150k); unused losses carry forward. On sale, claimed depreciation is recaptured at up to 25%, and gains may owe capital-gains tax (a 1031 exchange can defer both). Figures are a year-1 estimate at your 24.0% rate — not tax advice; consult a CPA.
Schools (NCES district)
- District
- Marysville Joint Unified
- NCES district ID
- 0624090
- Math proficiency
- 14% ▼ -13.00%
- Reading proficiency
- 28% ▼ -10.00%
- Median HH income
- $44,598
- Composite
- 18.18/100
- National rank
- #8961
- State rank
- #455 of 517 in CA
Livability — Marysville
- Score
- 68/100
- State rank
- #293
- US rank
- #9846
Category grades
Schools grade is shown separately in the Schools card above.
Census & demographics
- Census place
- Marysville, CA
- County
- Yuba County · 71,731 people
- City population
- 37,732
- Metro
- Yuba City, CA
- Population (ZIP)
- 37,732
- Household income
- $69,776
- Rent vs Own
- Severe rent burden
- 1190.0
Population outlook (Yuba County) Hauer SSP2
- Today (2025)
- 75,432 people
- By 2030
- 75,358 · -0.1%
- By 2040
- 74,643 · -1.0%
- By 2050
- 72,937 · -3.3%
- By 2075
- 66,368 · -12.0%
- By 2100
- 54,524 · -27.7%
Race, ethnicity, and origin ACS 2023
- Neighborhood character
- Diverse neighborhood (Simpson 0.65)
- Race & ethnicity
- White 51% Hispanic / Latino 28% Two or more races 17% Asian 9% Black 3% Native American 2%
- Hispanic origin (detail)
- Mexican 25%
- Common ancestry
- Italian 2% Lithuanian 1% Russian 1%
- Foreign-born
- 12% · Canada, China
- Languages at home
- 75% English-only · Spanish 16% Other Asian/Pacific 5% Other Indo-European 1%
Political lean MEDSL · Yuba
- 2024 margin
- Strong R (+25.8) · D 35.7% · R 61.5% · Other 2.8%
- 2008→2024 swing
- -11.2pp toward R · 2008: -14.7pp · 2024: -25.8pp
- All cycles
- 2024: R+25.8 2020: R+21.6 2016: R+24.1 2012: R+19.5 2008: R+14.7
Not yet ingested
- Civics
- —
Market trends
- HPI YoY
- ▼ -268.01%
- Current HPI
- 203.7684
- Rent YoY
- ▲ 1.87%
- Metro
- Yuba City, CA
- State GDP YoY
- ▲ 3.21%
- F500 in state
- 116
Industry mix (Fortune 500 HQ in CA)
| Industry | F500 HQs | Revenue |
|---|---|---|
| Technology | 27 | $1,492B |
|
||
| Financial Services | 3 | $174B |
|
||
| Retail | 3 | $44B |
|
||
| Insurance | 3 | $26B |
|
||
| Media / Entertainment | 2 | $115B |
|
||
| Pharmaceuticals / Biotech | 2 | $62B |
|
||
Property tax history
+1.6%/yrLatest (2025): $1,870 · +1.7% YoY. Source: county tax records.
Cash-flow waterfall
monthlySold comps — $/sqft
last 12 mo · ≤1 miLoading sold comps…