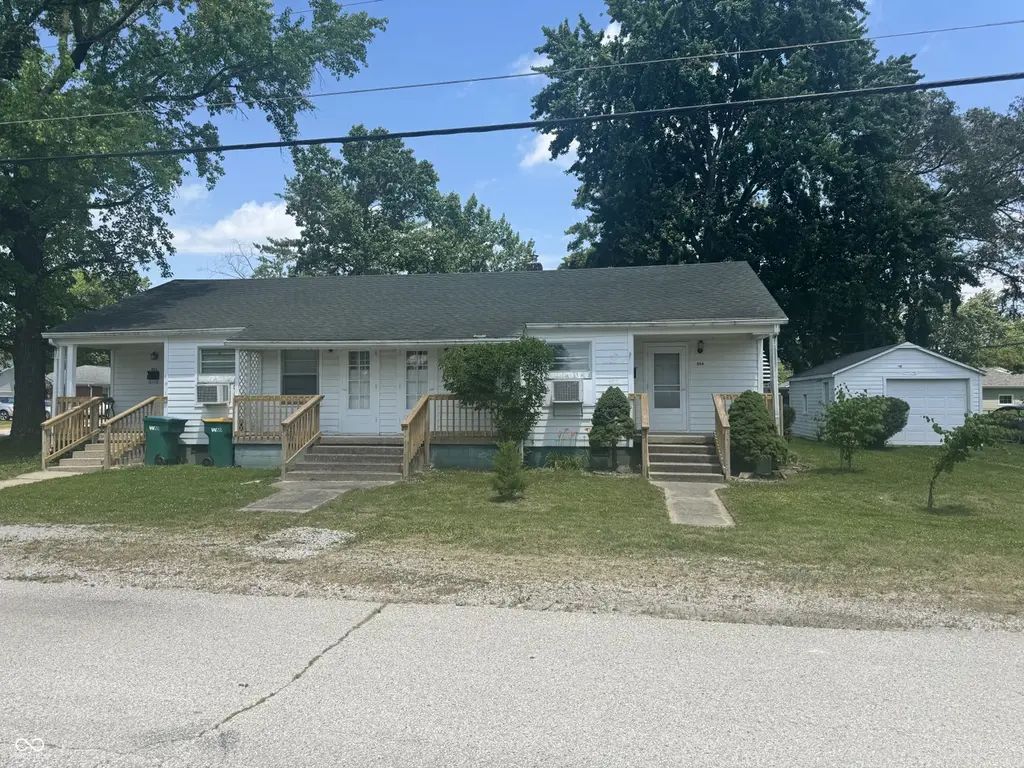
 Duplex
802/804 Tucker Ave · Plainfield, IN
Flood risk 1/10 · Minimal
- FEMA flood zone
- X (unshaded)
- Chance of flooding over 30 yrs
- 0.0%
- Est. flood insurance / yr
- $507 – $1,088
Fire risk 1/10 · Minimal
- Est. fire insurance / yr
- $717 – $1,331
Heat risk 3/10 · Minor
- Hot days now (above 101°F)
- 7 days/yr
- Hot days in 30 yrs
- 19 days/yr
Wind risk 2/10 · Minimal
- Chance of severe wind over 30 yrs
- 1.0%
Air-quality risk 3/10 · Minor
- Unhealthy air days now
- 2 days/yr
- Unhealthy air days in 30 yrs
- 3 days/yr
Risk factors via First Street. Map © Google.
Why this score? — see what drove the C grade
The composite is a weighted blend of 9 inputs, each scored 0–100. Each bar is that input's sub-score; the figure is the points it added to the 100-point composite (weight × sub-score).
- Cash flow +24.1/30.0
- DSCR +7.8/10.0
- ARV discount +6.5/15.0
- 1% rule +6.3/10.0
- Schools +5.5/10.0
- Livability +3.7/5.0
- Rent growth +3.4/5.0
- Condition / age +2.2/5.0
- Appreciation +0.0/10.0
$250,000
🖨 Deal sheet 📄 Offer letter ✓ Due diligence
Multi-family units
County records classify this as Multi-Family (2-4 Unit). Listing-text estimate: 2 units. confirmed
Listing remarks
Nicely kept duplex with rental history, one side comes with a 1 car garage to increase rent. Current tenant is MTM pays 850/mo(under market value) last tenant paid 940 w garage(under market value)
Key facts
- 8,276 sq ft lot
- Built 1970
Property features AI
Finance
- Other: Lot size approximately 0.19 acres; Frontage road access; Low maintenance lifestyle: No
- Financial info: Two-unit building; Reported gross income: $22,000; Reported expenses: $0; Unit rents: one unit $850/month, other unit $940/month
Exterior
- Parking: On-street parking
- Utilities: Public water; Public sewer; No solid waste service listed
- Home design: Duplex (residential income property); One story
- Construction: Wood siding construction
- Exterior features: Shingle roof; Asphalt road frontage on a city street; Property currently used as apartments (under 20 units)
Interior
- Kitchen: Each unit has a kitchen
- Bedrooms: Two 1-bedroom units (each on a single level)
- Heating & cooling: Electric heating; Window unit(s) for cooling
- Interior features: Wood siding interior construction
- Laundry & utility: Units use electric hot water and forced heat; Window air conditioning units
Neighborhood map
What this means for you Summary
Snapshot
- This is a 2 × 2.0-bed/2.0-bath units multifamily listed at $250k. Condition is rated fair.
Deal economics
- At list price, monthly cash flow is $496 ($6k/yr) — positive. Per door: $248/mo.
- The deal already cash-flows at list — no discount required.
- Meets the 1% rule at list price ($3k rent vs $250k).
- Cap rate 8.7% vs local median 3.7% in Plainfield — top-decile yield for the area; either an underpriced asset or a hidden risk that comps aren't pricing in. Stress-test before assuming the spread holds.
Location & tenants
- Location reads 74/100 on livability (#69 in IN, #4,418 nationally) — a middle-class / working-renter tenant base. Strengths: cost of living A+, housing A+, schools A; Watch: health & safety C-, amenities F, commute F.
- Plainfield Community School Corporation (suburban): math 62% / reading 65% proficiency, ranked #11 of 301 in IN (top 4%) — acceptable for families but not a draw, mixed tenant base, ~2y average lease.
- Market conditions: Rents rising (+3.6%/yr); 284 active listings in the ZIP; 6 comparable units currently listed for rent nearby; rentals at typical pace (median 24d on market — plan ~3-4 weeks tenant-placement turnaround); solid renter incomes; 1,294 units permitted in Hendricks County in 2024 (18 in 5+ unit buildings).
- This rent runs 38% of the median local income ($90k/yr) — at the standard rent-burdened threshold; future hikes will face affordability resistance.
Forward outlook
- Local home prices are declining (-3.0%/yr); year-one equity from $2k of loan paydown is wiped out by about $8k of value loss. Plan a longer hold.
- Hendricks County population projected at +35% by 2050 — long-run rental-demand tailwind backs the buy-and-hold thesis.
Negotiation context
- Only 1 days on market — expect competitive offers; lowballing is unlikely to land.
Questions for the listing agent
- Can we see the unit-by-unit rent roll, current vacancy, and any below-market leases? What's the average tenancy length?
- What capital expenditures (roof, boiler, parking lot, exteriors) have been made in the last 5 years, and what's planned in the next 2?
- Have any recent inspections been done? Can we get a copy of the seller's disclosures and any deferred-maintenance estimates?
- Built in 1970 — when were the roof, HVAC, electrical panel, plumbing, and water heater last replaced?
- Is there a deadline driving the sale (1031 exchange, divorce, estate, relocation)? That informs how much negotiation room exists.
- Schools are A-rated — typically a magnet for longer-tenancy family renters. What's the average tenant stay here, and is there a school-zone premium baked into asking?
- What's the average days-on-market for RENTAL listings here right now (not sales)? A rising rental-DOM trend means longer vacancies and softer asking-rent achievability than the comps imply.
- What's the recent tenant-quality profile in this submarket — average credit score on applications, eviction rate, late-payment / NSF rate, and stable-employment percentage? A property-management company in the area should have these aggregated.
- How much new apartment / multifamily construction is in the pipeline within 1–3 miles? Heavy new supply (>2% of stock underway) typically softens rents 12–24 months out; light construction supports rent growth.
Investment metrics
- 1% rule
- 1.13% ✓
- Cap rate
- 8.67%
- Cash-on-cash
- 8.51%
- DSCR
- 1.38
- GRM
- 7.4
CMA / ARV
- ARV (on-the-fly)
- $244,776
- Comps found
- 1
Show comp detail 1 sale within ~0.75 mi
| Address | Dist | Beds/Ba | Sqft | Sold | Price | $/sf | Match |
|---|---|---|---|---|---|---|---|
| 1020 Raymond St | 0.65mi | 4/2.0 | 1,560 (-10%) | 22mo | $220,000 | $141 | 27 |
Match score weights: distance 35% · size 25% · config 20% · recency 20%. Top-matched comps best support the ARV.
Projected returns pro-forma
-3.0% appreciation · 3.65% rent growth · sell at horizon
- IRR
- -2.6%
- Equity multiple
- 0.90×
- Total profit
- $-7,015
- Equity at exit
- $37,276
- IRR
- 7.8%
- Equity multiple
- 1.61×
- Total profit
- $42,459
- Equity at exit
- $21,615
Cash invested: $70,000 (down + closing). Projections, not guarantees.
Landlord ↔ Tenant lean methodology
- Overall (STATE)
- 90 Strongly Landlord-Friendly
- State Indiana
- 90 Strongly Landlord-Friendly · R+11
- County
- — inherits STATE
- City
- — inherits STATE
ZIP-level market 46168
- Rents YoY
- 3.6%
- Active inventory
- 284
- Price-to-rent
- 14.8×
Monthly cashflow live
- Estimated rent
- $2,815 high interval (Pro) →
- Mortgage (P&I)
- −$1,311
- Tax est. 1.5%
- −$312 /mo · $3,750/yr
- Insurance
- −$104
- HOA
- −$0
- Vacancy / Maint / Mgmt
- −$591
- Net cashflow
- $496
Break-even live
2-unit breakdown (identical units grouped — click to expand)
| Units | Beds | Baths | Est. rent |
|---|---|---|---|
| 2× units | 2.0 | 2 | $2,814 |
| #1 | 2.0 | 2 | $1,407 |
| #2 | 2.0 | 2 | $1,407 |
| Total (2 units) | $2,815 | ||
UW: 25.0% down · 7.5% · 30yr · 1.5% tax · 5.0% vac · 8.0% maint · 8.0% mgmt
Financing live
Cash to close
- Down payment
- $62,500
- Closing costs
- $7,500
- Reserves months
- —
- Total cash needed
- —
Loan-product check · same deal, 3 products live
Conventional
25% down · 7.5% · 30yr
- Down + closing
- —
- Monthly P&I
- —
- Monthly cashflow
- —
- DSCR
- —
- Eligible?
- —
Personal DTI + credit; lowest rate.
DSCR
20% down · 8.5% · 30yr
- Down + closing
- —
- Monthly P&I
- —
- Monthly cashflow
- —
- DSCR
- —
- Eligible?
- —
No personal income docs; deal must DSCR.
Hard money
10% down · 12.0% · 12mo
- Down + closing
- —
- Monthly P&I
- —
- Monthly cashflow
- —
- DSCR
- —
- Eligible?
- —
Short-term bridge; refi at stabilization.
Rent comps 6 comps
| Address | Beds | Baths | Sqft | Rent | $/sqft | DOM | Units | Dist |
|---|---|---|---|---|---|---|---|---|
| 282 N East St Plainfield, IN | 3.0 | 2.5 | 1480 | $1,950 | $1.32 | 23d | 1 | 0.58mi |
| 451 N Vine St Plainfield, IN | 2.0–3.0 | 1.0–2.0 | 996 | $1,400 | $1.41 | 1d | 5 | 0.58mi |
| 269 N Vine St Plainfield, IN | 4.0 | 1.0 | 1794 | $1,625 | $0.91 | 43d | 1 | 0.61mi |
| 429 Brookside Ln Plainfield, IN | 3.0 | 1.5 | 1236 | $1,731 | $1.40 | 12d | 1 | 0.71mi |
| 8151 Lupine Dr Plainfield, IN | 3.0 | 2.5 | 2003 | $2,450 | $1.22 | 43d | 1 | 1.32mi |
| 1995 Crown Plaza Blvd Plainfield, IN | 1.0–3.0 | 1.0–2.0 | 924 | $1,700 | $1.84 | 1d | 5 | 1.37mi |
Listing history 2 events
-
2026-06-18remarks 196-char remark
-
2026-06-18$250,000 Active 1 DOM
ⓘ Source: listings_history table (triggers on properties + properties_extension) + one-shot
backfill from property_details.listing_events for pre-trigger history.
Climate risk First Street
- Flood 1/10 Low FEMA zone X (unshaded) · 0% chance over 30 yrs
- Wildfire 1/10 Low
- Heat 3/10 Moderate 7 d/yr ≥101°F today · 19 d/yr by 30 yrs out
- Wind 2/10 Low 100% chance of damaging wind over 30 yrs
- Air quality 3/10 Moderate 2 unhealthy d/yr today · 3 by 30 yrs out
Nearby sold comps map
Loading sold comps map…
Walkable amenities ~0.75 mi
Loading nearby amenities…
Taxation est. · year 1
- Rental income
- $33,780
- − Mortgage interest
- −$14,004
- − Property taxes
- −$3,750
- − Insurance
- −$1,250
- − Repairs & maintenance
- −$2,702
- − Management
- −$2,702
- − Depreciation
- −$7,273
- Taxable income
- $2,099
- Est. tax owed @ 24.0%
- −$504
- After-tax cash flow
- $5,450/yr
For passive investors: Depreciation is non-cash, so a rental often shows a tax loss while cash-flowing — sheltering income. Rental losses are passive: they offset passive income freely, and up to $25,000/yr can offset ordinary (W-2) income if you actively participate and your MAGI is under $100k (phasing out to $0 by $150k); unused losses carry forward. On sale, claimed depreciation is recaptured at up to 25%, and gains may owe capital-gains tax (a 1031 exchange can defer both). Figures are a year-1 estimate at your 24.0% rate — not tax advice; consult a CPA.
Condition & rehab AI · 1 photo
A moderate rehab is needed to address exterior siding and landscaping, which can significantly boost both resale and rental value.
Repairs flagged
- Minor exterior siding — Slight discoloration
- Minor landscaping — Overgrown vegetation
Value-add opportunities
- Both paint exterior — Enhances curb appeal and resale value
- Both landscaping — Improves curb appeal and rental value
Renovation cost estimate screening
| Repair item | Severity | Est. cost |
|---|---|---|
| exterior siding · Slight discoloration | Minor | $500–3,000 |
| landscaping · Overgrown vegetation | Minor | $500–3,000 |
| Total estimated repair cost · 2 items | $1,000–6,000 |
Value-add ROI direction
- Both paint exterior — Enhances curb appeal and resale value ↑
- Both landscaping — Improves curb appeal and rental value ↑
ⓘ Cost ranges are severity-bucket heuristics (US national rule-of-thumb). Get contractor quotes + a written scope before underwriting a rehab budget.
Schools (NCES district)
- District
- Plainfield Community School Corporation
- NCES district ID
- 1808970
- Math proficiency
- 62% ▼ -8.00%
- Reading proficiency
- 65% ▼ -8.00%
- Median HH income
- $58,531
- Composite
- 54.79/100
- National rank
- #1315
- State rank
- #11 of 301 in IN
Livability — Plainfield
- Score
- 74/100
- State rank
- #69
- US rank
- #4418
Category grades
Schools grade is shown separately in the Schools card above.
Census & demographics
- Census place
- Plainfield, IN
- County
- Hendricks County · 143,373 people
- City population
- 38,826
- Metro
- Indianapolis-Carmel-Anderson, IN
- Population (ZIP)
- 38,826
- Household income
- $90,000
- Rent vs Own
- Severe rent burden
- 1029.0
Population outlook (Hendricks County) Hauer SSP2
- Today (2025)
- 187,418 people
- By 2030
- 201,494 · +7.5%
- By 2040
- 228,487 · +21.9%
- By 2050
- 253,068 · +35.0%
- By 2075
- 308,920 · +64.8%
- By 2100
- 336,510 · +79.6%
Race, ethnicity, and origin ACS 2023
- Neighborhood character
- Predominantly White (76%)
- Race & ethnicity
- White 76% Black 9% Two or more races 8% Hispanic / Latino 6% Asian 4%
- Hispanic origin (detail)
- Mexican 3%
- Common ancestry
- Italian 2% Lithuanian 1% Romanian 1%
- Foreign-born
- 7% · Canada, China
- Languages at home
- 90% English-only · Spanish 4% Other Indo-European 3% French/Haitian/Cajun 1%
Political lean MEDSL · Hendricks
- 2024 margin
- Strong R (+21.5) · D 38.4% · R 59.9% · Other 1.7%
- 2008→2024 swing
- +1.9pp toward D · 2008: -23.4pp · 2024: -21.5pp
- All cycles
- 2024: R+21.5 2020: R+23.9 2016: R+34.2 2012: R+34.9 2008: R+23.4
Not yet ingested
- Civics
- —
Market trends
- HPI YoY
- ▼ -136.23%
- Current HPI
- 205.5963
- Rent YoY
- ▲ 3.65%
- Metro
- Indianapolis-Carmel-Anderson, IN
- State GDP YoY
- ▲ 2.90%
- F500 in state
- 18
Industry mix (Fortune 500 HQ in IN)
| Industry | F500 HQs | Revenue |
|---|---|---|
| Industrial Machinery | 2 | $37B |
|
||
| Healthcare | 1 | $177B |
|
||
| Pharmaceuticals | 1 | $45B |
|
||
| Metals / Steel | 1 | $18B |
|
||
| Agriculture | 1 | $17B |
|
||
| Packaging | 1 | $12B |
|
||
Price history
1 event — show timeline
- 2026-06-09 Listed $250,000 MIBOR as Distributed by MLS Grid
Cash-flow waterfall
monthlySold comps — $/sqft
last 12 mo · ≤1 miLoading sold comps…