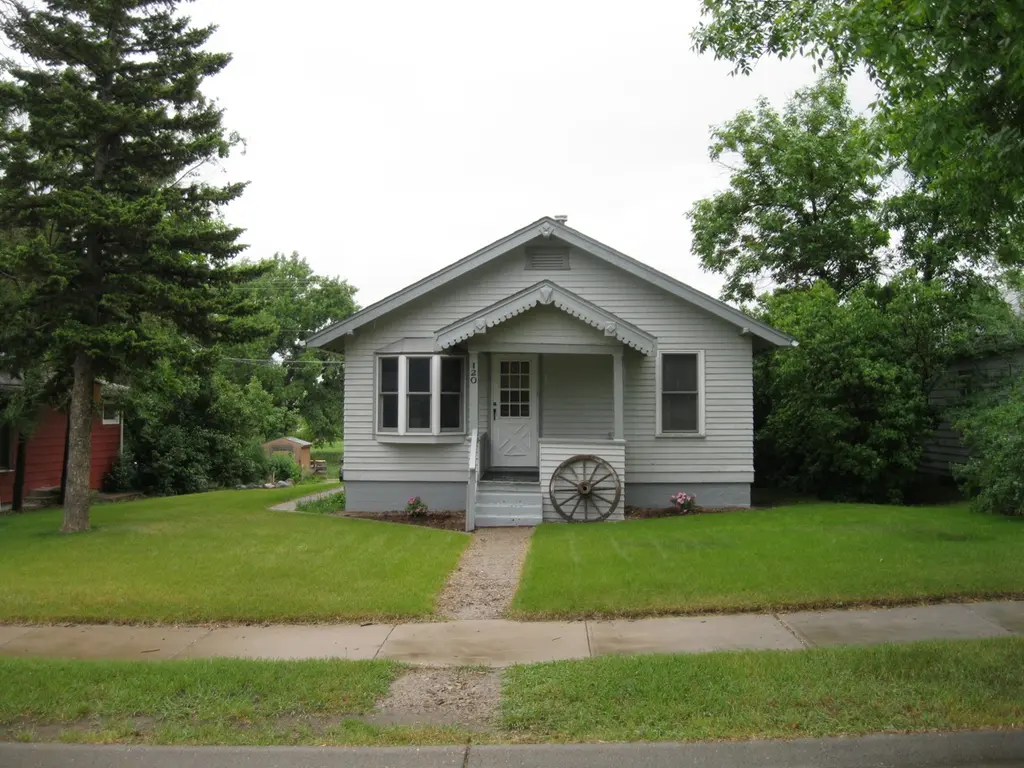
120 Illinois St · Chinook, MT
Flood risk 1/10 · Minimal
- FEMA flood zone
- X (unshaded)
- Chance of flooding over 30 yrs
- 0.0%
- Est. flood insurance / yr
- $473 – $860
Fire risk 3/10 · Minor
- Est. fire insurance / yr
- $918 – $1,706
Heat risk 2/10 · Minimal
- Hot days now (above 94°F)
- 7 days/yr
- Hot days in 30 yrs
- 14 days/yr
Wind risk 1/10 · Minimal
- Chance of severe wind over 30 yrs
- —
Air-quality risk 5/10 · Moderate
- Unhealthy air days now
- 5 days/yr
- Unhealthy air days in 30 yrs
- 7 days/yr
Risk factors via First Street. Map © Google.
Why this score? — see what drove the B- grade
The composite is a weighted blend of 9 inputs, each scored 0–100. Each bar is that input's sub-score; the figure is the points it added to the 100-point composite (weight × sub-score).
- Cash flow +27.7/30.0
- DSCR +9.8/10.0
- 1% rule +9.1/10.0
- ARV discount +7.5/15.0
- Appreciation +4.1/10.0
- Livability +3.7/5.0
- Rent growth +2.5/5.0
- Condition / age +2.5/5.0
- Schools +1.3/10.0
$76,500
🖨 Deal sheet (PDF) 📄 Offer letter ✓ Due diligence
Key facts
- 8,400 sq ft lot
- 3 garage spots
- Built 1935
Neighborhood map
What this means for you Summary
Snapshot
- This is a 3-bed/1.0-bath single-family listed at $76k.
Deal economics
- At list price, monthly cash flow is $232 ($3k/yr) — positive.
- The deal already cash-flows at list — no discount required.
- Meets the 1% rule at list price ($1k rent vs $76k).
Location & tenants
- Location reads 73/100 on livability (#44 in MT) — a middle-class / working-renter tenant base. Strengths: cost of living A+, housing A+, health & safety A+; Watch: crime C-, employment D+, amenities F.
- Chinook H S (rural): math 0% / reading 21% proficiency, ranked #278 of 339 in MT (top 82%) — low school quality limits family demand, transient renter base, plan for 1-2y turnover.
- Zoned schools: Meadowlark School (math 22% / reading 27%, grade F, #237 of 293 statewide, top 86%, 167 students, 0% FRL); Chinook 7-8 (math 15% / reading 34%, grade F, #118 of 146 statewide, top 81%, 57 students, 0% FRL); Chinook High School (math 10% / reading 30%, grade F, #111 of 132 statewide, top 88%, 114 students, 0% FRL).
- Zoned-school proficiency averages 23% at this address vs 10% district-wide (+13 pts) — the actual schools serving this property are materially stronger than the Chinook H S average implies; a family-tenant draw the district grade alone would hide.
- Market conditions: 22 active listings in the ZIP.
Forward outlook
- Local home prices are declining (-1.8%/yr); year-one equity from $529 of loan paydown is wiped out by about $1k of value loss. Plan a longer hold.
- Blaine County population projected at +10% by 2050 — modest demand growth; plan on rents tracking national, not racing it.
- At projected returns (-1.8% appreciation + 3.0% rent growth), your $21k cash investment doubles in ~8 years — after that, you're playing with house money.
Negotiation context
- Only 0 days on market — expect competitive offers; lowballing is unlikely to land.
Risks & watch-outs
- Watch-outs: property tax is 2.9% of price; built in 1935 — expect roof / HVAC / electrical / plumbing capex.
Questions for the listing agent
- Built in 1935 — when were the roof, HVAC, electrical panel, plumbing, and water heater last replaced?
- Property tax is high relative to price — has the assessment been appealed recently, and will the sale trigger a re-assessment?
- Is there a deadline driving the sale (1031 exchange, divorce, estate, relocation)? That informs how much negotiation room exists.
- What's the average days-on-market for RENTAL listings here right now (not sales)? A rising rental-DOM trend means longer vacancies and softer asking-rent achievability than the comps imply.
- What's the recent tenant-quality profile in this submarket — average credit score on applications, eviction rate, late-payment / NSF rate, and stable-employment percentage? A property-management company in the area should have these aggregated.
- How much new for-sale + rental construction is in the pipeline within 1–3 miles? Heavy new supply typically softens prices + rents 12–24 months out; constrained supply supports both.
Investment metrics
- 1% rule
- 1.41% ✓
- Cap rate
- 9.93%
- Cash-on-cash
- 12.99%
- DSCR
- 1.58
- GRM
- 5.9
CMA / ARV
No comps found within radius.
Projected returns pro-forma
-1.84% appreciation · 3.0% rent growth · sell at horizon
- IRR
- 6.9%
- Equity multiple
- 1.29×
- Total profit
- $6,214
- Equity at exit
- $15,417
- IRR
- 14.4%
- Equity multiple
- 2.31×
- Total profit
- $28,106
- Equity at exit
- $13,713
Cash invested: $21,420 (down + closing). Projections, not guarantees.
Landlord ↔ Tenant lean methodology
- Overall (STATE)
- 82 Strongly Landlord-Friendly
- State Montana
- 82 Strongly Landlord-Friendly · R+11
- County
- — inherits STATE
- City
- — inherits STATE
ZIP-level market 59523
- Home prices YoY
- -0.9%
- Active inventory
- 22
- Price-to-rent
- 5.9×
Monthly cashflow live
- Estimated rent
- $1,075 medium interval (Pro) →
- Mortgage (P&I)
- −$401
- Tax from tax record
- −$184 /mo · $2,213/yr
- Insurance
- −$32
- HOA
- −$0
- Vacancy / Maint / Mgmt
- −$226
- Net cashflow
- $232
Break-even live
Sensitivity live
| Price | -10% $275 | -5% $254 | +0% $232 | +5% $210 | +10% $189 |
|---|---|---|---|---|---|
| Rent | -10% $147 | -5% $189 | +0% $232 | +5% $274 | +10% $317 |
| Rate | -1.0pp $270 | -0.5pp $251 | base $232 | +0.5pp $212 | +1.0pp $192 |
UW: 25.0% down · 7.5% · 30yr · 1.5% tax · 5.0% vac · 8.0% maint · 8.0% mgmt
Financing live
Cash to close
- Down payment
- $19,125
- Closing costs
- $2,295
- Reserves months
- —
- Total cash needed
- —
Loan-product check · same deal, 3 products live
Conventional
25% down · 7.5% · 30yr
- Down + closing
- —
- Monthly P&I
- —
- Monthly cashflow
- —
- DSCR
- —
- Eligible?
- —
Personal DTI + credit; lowest rate.
DSCR
20% down · 8.5% · 30yr
- Down + closing
- —
- Monthly P&I
- —
- Monthly cashflow
- —
- DSCR
- —
- Eligible?
- —
No personal income docs; deal must DSCR.
Hard money
10% down · 12.0% · 12mo
- Down + closing
- —
- Monthly P&I
- —
- Monthly cashflow
- —
- DSCR
- —
- Eligible?
- —
Short-term bridge; refi at stabilization.
Listing history 1 events
-
2026-06-07$76,500 Pending
ⓘ Source: listings_history table (triggers on properties + properties_extension) + one-shot
backfill from property_details.listing_events for pre-trigger history.
Tax reassessment forecast MT · Resets to sale price
- Current annual tax
- $2,213 · $184/mo
- Projected year-2 tax
- $2,213 · $184/mo
- Expected delta
- $0/yr ($0/mo · 0.0%)
ⓘ Screening estimate from a state-policy table — verify with the county assessor before closing.
Climate risk First Street
- Flood 1/10 Low FEMA zone X (unshaded) · 0% chance over 30 yrs
- Wildfire 3/10 Moderate
- Heat 2/10 Low 7 d/yr ≥94°F today · 14 d/yr by 30 yrs out
- Wind 1/10 Low
- Air quality 5/10 Major 5 unhealthy d/yr today · 7 by 30 yrs out
Nearby sold comps map
Loading sold comps map…
Walkable amenities ~0.75 mi
Loading nearby amenities…
Taxation est. · year 1
- Rental income
- $12,902
- − Mortgage interest
- −$4,285
- − Property taxes
- −$2,213
- − Insurance
- −$382
- − Repairs & maintenance
- −$1,032
- − Management
- −$1,032
- − Depreciation
- −$2,225
- Taxable income
- $1,731
- Est. tax owed @ 24.0%
- −$415
- After-tax cash flow
- $2,367/yr
For passive investors: Depreciation is non-cash, so a rental often shows a tax loss while cash-flowing — sheltering income. Rental losses are passive: they offset passive income freely, and up to $25,000/yr can offset ordinary (W-2) income if you actively participate and your MAGI is under $100k (phasing out to $0 by $150k); unused losses carry forward. On sale, claimed depreciation is recaptured at up to 25%, and gains may owe capital-gains tax (a 1031 exchange can defer both). Figures are a year-1 estimate at your 24.0% rate — not tax advice; consult a CPA.
Schools (NCES district)
- District
- Chinook H S
- NCES district ID
- 3006270
- Math proficiency
- 0% ▼ -40.00%
- Reading proficiency
- 21% ▼ -19.00%
- Median HH income
- $41,979
- Composite
- 12.86/100
- National rank
- #14540
- State rank
- #278 of 339 in MT
Livability — Chinook
- Score
- 73/100
- State rank
- #44
- US rank
- #5341
Category grades
Schools grade is shown separately in the Schools card above.
Census & demographics
- Census place
- Chinook, MT
- Population (ZIP)
- 2,281
Population outlook (Blaine County) Hauer SSP2
- Today (2025)
- 6,837 people
- By 2030
- 6,969 · +1.9%
- By 2040
- 7,228 · +5.7%
- By 2050
- 7,540 · +10.3%
- By 2075
- 8,571 · +25.4%
- By 2100
- 9,058 · +32.5%
Race, ethnicity, and origin ACS 2023
- Neighborhood character
- Predominantly White (89%)
- Race & ethnicity
- White 89% Two or more races 7% Native American 4% Hispanic / Latino 3%
- Common ancestry
- Portuguese 14% Slovak 3% Scottish 2%
- Foreign-born
- 1%
- Languages at home
- 96% English-only · Spanish 2% German/W. Germanic 2%
Political lean MEDSL · Blaine
- 2024 margin
- Lean R (+5.9) · D 44.6% · R 50.5% · Other 4.8%
- 2008→2024 swing
- -25.2pp toward R · 2008: 19.3pp · 2024: -5.9pp
- All cycles
- 2024: R+5.9 2020: D+3.9 2016: R+2.8 2012: D+15.2 2008: D+19.3
Not yet ingested
- Civics
- —
Market trends
- HPI YoY
- ▼ -1.84%
- Current HPI
- 213.5954
- Rent YoY
- —
- Metro
- —
- State GDP YoY
- ▲ 3.41%
- F500 in state
- 2
Industry mix (Fortune 500 HQ in MT)
| Industry | F500 HQs | Revenue |
|---|---|---|
| Technology / Analytics | 1 | $2B |
|
||
Price history
5 events — show timeline
- 2014-11-05 Delisted — HHLMLS
- 2014-06-19 Listed $76,500 HHLMLS
- 2004-06-24 Sold (Public Records) — Public Records
- 2000-10-03 Sold (Public Records) — Public Records
- 1999-12-22 Sold (Public Records) — Public Records
Property tax history
+3.5%/yrLatest (2025): $2,213 · -10.6% YoY. Source: county tax records.
Cash-flow waterfall
monthlySold comps — $/sqft
last 12 mo · ≤1 miLoading sold comps…