 Fourplex
65 Royale · Lakeport, CA
Flood risk 1/10 · Minimal
- FEMA flood zone
- AE
- Chance of flooding over 30 yrs
- 0.0%
- Est. flood insurance / yr
- $1,737 – $8,500
Fire risk 8/10 · Major
- Est. fire insurance / yr
- $659 – $1,223
Heat risk 6/10 · Moderate
- Hot days now (above 103°F)
- 7 days/yr
- Hot days in 30 yrs
- 14 days/yr
Wind risk 1/10 · Minimal
- Chance of severe wind over 30 yrs
- —
Air-quality risk 10/10 · Severe
- Unhealthy air days now
- 28 days/yr
- Unhealthy air days in 30 yrs
- 29 days/yr
Risk factors via First Street. Map © Google.
Why this score? — see what drove the C- grade
The composite is a weighted blend of 9 inputs, each scored 0–100. Each bar is that input's sub-score; the figure is the points it added to the 100-point composite (weight × sub-score).
- Cash flow +18.6/30.0
- ARV discount +15.0/15.0
- DSCR +5.8/10.0
- 1% rule +4.7/10.0
- Livability +2.7/5.0
- Rent growth +2.5/5.0
- Condition / age +2.5/5.0
- Schools +1.9/10.0
- Appreciation +0.0/10.0
$619,000
🖨 Deal sheet (PDF) 📄 Offer letter ✓ Due diligence
Multi-family units
County records classify this as Multi-Family (2-4 Unit). Listing-text estimate: 4 units. confirmed
Listing remarks MLS
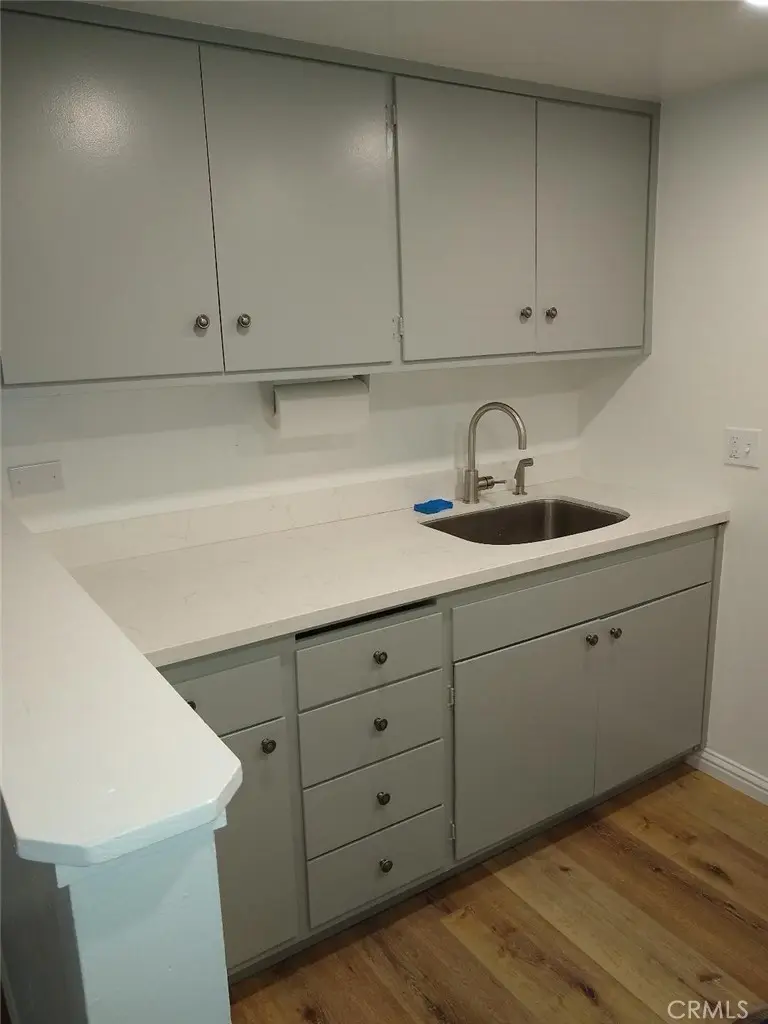
Located at 65 Royale Avenue in the heart of downtown Lakeport, this fully rented four unit apartment building offers an excellent investment opportunity in a highly walkable and convenient location just off Main Street. The two level property features approximately 3,200 square feet on a 6,534 square foot lot and includes four well configured units, each with two bedrooms and one bathroom. Select units have received cosmetic upgrades, and recent improvements include a new roof, providing added value and peace of mind. With all four units being rented you will have immediate income, covered parking, and close proximity to shopping, public transportation, dining, and Clear Lake, this property is ideally positioned for strong long term rental demand and future upside.
Key facts
- Covered parking
- New roof
- 6,970 sq ft lot
Tags
Neighborhood map
What this means for you Summary
Snapshot
- This is a 4 × 2-bed/1-bath units multifamily listed at $619k.
Deal economics
- At list price, monthly cash flow is $172 ($2k/yr) — positive. Per door: $43/mo.
- The deal already cash-flows at list — no discount required.
- To meet the 1% rule (rent ≥ 1% of price), the offer needs to be $600k (3.1% below list).
- Recommended offer: $545k (12.0% below list) — sets the bar for market timing.
- Cap rate 7.5% vs local median 3.1% in Lakeport — top-decile yield for the area; either an underpriced asset or a hidden risk that comps aren't pricing in. Stress-test before assuming the spread holds.
Location & tenants
- Location reads 54/100 on livability (#925 in CA) — a working-class tenant base; expect higher turnover. Strengths: housing A; Watch: health & safety C-, employment D+, crime F.
- Lakeport Unified (town): math 13% / reading 30% proficiency, ranked #451 of 517 in CA (top 87%) — low school quality limits family demand, transient renter base, plan for 1-2y turnover.
- Zoned schools: Lakeport Elementary (math 17% / reading 27%, grade F, #1,179 of 1,571 statewide, top 78%, 394 students, 66% FRL); Terrace Middle (math 12% / reading 27%, grade F, #419 of 498 statewide, top 85%, 482 students, 66% FRL); Clear Lake High (math 17% / reading 47%, grade F, #674 of 1,170 statewide, top 59%, 357 students, 57% FRL).
- Market conditions: 150 active listings in the ZIP; 107 units permitted in Lake County in 2024 (40 in 5+ unit buildings).
- At $6,001/mo this rent would consume 101% of the median local household income ($71k/yr) (locally 250% of renters already pay >50% of income on rent) — very limited rent-growth headroom before tenants either downsize or default.
Forward outlook
- Local home prices are declining (-3.0%/yr); year-one equity from $4k of loan paydown is wiped out by about $19k of value loss. Plan a longer hold.
- Lake County population projected at -15% by 2050 — secular population decline; favor cash flow + early exit over multi-decade hold.
Negotiation context
- It's been on market 146 days — a 12% lower offer ($545k) is reasonable based on typical stale-listing flexibility.
- 7 sale attempts since 11y ago with the ask held roughly flat each time — persistent listings suggest the price (not the market) is what's stuck; bring a comps-based counter.
Risks & watch-outs
- Watch-outs: flood insurance adds $427/mo.
- Climate carrying-cost: in FEMA flood zone AE (mandatory federal flood insurance); severe wildfire risk; extreme-heat days projected 7→14/yr by 2055 (HVAC capex compounding) — expect insurance premiums to compound above CPI over the hold.
Questions for the listing agent
- It's been on market 146 days. Have you received any prior offers? Is the seller open to a 12% concession, seller financing, or rate buy-down credit?
- Can we see the unit-by-unit rent roll, current vacancy, and any below-market leases? What's the average tenancy length?
- What capital expenditures (roof, boiler, parking lot, exteriors) have been made in the last 5 years, and what's planned in the next 2?
- Built in 1965 — when were the roof, HVAC, electrical panel, plumbing, and water heater last replaced?
- What's the actual annual flood-insurance premium (NFIP or private), and is the property in a SFHA with mandatory coverage?
- Why hasn't it sold? Are there any deal-killer items the seller is aware of (foundation, flood, title, zoning, code violations)?
- Is there a deadline driving the sale (1031 exchange, divorce, estate, relocation)? That informs how much negotiation room exists.
- Schools are D-rated, which usually means shorter tenancies and higher turnover. Who's the typical renter profile here, and what's been the actual vacancy rate?
- Crime grade is F in this area — have there been break-ins, vandalism, or insurance claims at this property in the last 3 years? What carrier currently insures it and at what premium?
- What's the average days-on-market for RENTAL listings here right now (not sales)? A rising rental-DOM trend means longer vacancies and softer asking-rent achievability than the comps imply.
- What's the recent tenant-quality profile in this submarket — average credit score on applications, eviction rate, late-payment / NSF rate, and stable-employment percentage? A property-management company in the area should have these aggregated.
- How much new apartment / multifamily construction is in the pipeline within 1–3 miles? Heavy new supply (>2% of stock underway) typically softens rents 12–24 months out; light construction supports rent growth.
Investment metrics
- 1% rule
- 0.97% ✗
- Cap rate
- 7.45%
- Cash-on-cash
- 4.14%
- DSCR
- 1.18
- GRM
- 8.6
CMA / ARV
- ARV (median comp)
- $975,000
- List price
- $619,000
- Delta
- -36.51%
- Verdict
- UNDERPRICED
- Comps
- 1 within 2.0 mi
Show comp detail 1 sale within ~0.75 mi
| Address | Dist | Beds/Ba | Sqft | Sold | Price | $/sf | Match |
|---|---|---|---|---|---|---|---|
| 55 Royale Ave | 0.01mi | 8/4.0 | 3,612 (+13%) | 10mo | $510,000 | $141 | 70 |
Match score weights: distance 35% · size 25% · config 20% · recency 20%. Top-matched comps best support the ARV.
Projected returns pro-forma
-3.0% appreciation · 3.0% rent growth · sell at horizon
- IRR
- -14.4%
- Equity multiple
- 0.49×
- Total profit
- $-89,099
- Equity at exit
- $92,295
- IRR
- -5.5%
- Equity multiple
- 0.64×
- Total profit
- $-62,408
- Equity at exit
- $53,520
Cash invested: $173,320 (down + closing). Projections, not guarantees.
Landlord ↔ Tenant lean methodology
- Overall (STATE)
- 18 Strongly Tenant-Friendly
- State California
- 18 Strongly Tenant-Friendly · D+13
- County
- — inherits STATE
- City
- — inherits STATE
ZIP-level market 95453
- Active inventory
- 150
- Price-to-rent
- 34.4×
Monthly cashflow live
- Estimated rent
- $6,001 medium interval (Pro) →
- Mortgage (P&I)
- −$3,246
- Tax from tax record
- −$639 /mo · $7,662/yr
- Insurance
- −$258
- Flood insurance flood zone
- −$427 /mo · $5,118/yr
- HOA
- −$0
- Vacancy / Maint / Mgmt
- −$1,260
- Net cashflow
- $172
Break-even live
Sensitivity live
| Price | -10% $522 | -5% $347 | +0% $172 | +5% $-3 | +10% $-179 |
|---|---|---|---|---|---|
| Rent | -10% $-302 | -5% $-65 | +0% $172 | +5% $409 | +10% $646 |
| Rate | -1.0pp $483 | -0.5pp $329 | base $172 | +0.5pp $11 | +1.0pp $-152 |
4-unit breakdown (identical units grouped — click to expand)
| Units | Beds | Baths | Est. rent |
|---|---|---|---|
| 4× units | 2 | 1 | $6,000 |
| #1 | 2 | 1 | $1,500 |
| #2 | 2 | 1 | $1,500 |
| #3 | 2 | 1 | $1,500 |
| #4 | 2 | 1 | $1,500 |
| Total (4 units) | $6,001 | ||
UW: 25.0% down · 7.5% · 30yr · 1.5% tax · 5.0% vac · 8.0% maint · 8.0% mgmt
Financing live
Cash to close
- Down payment
- $154,750
- Closing costs
- $18,570
- Reserves months
- —
- Total cash needed
- —
Loan-product check · same deal, 3 products live
Conventional
25% down · 7.5% · 30yr
- Down + closing
- —
- Monthly P&I
- —
- Monthly cashflow
- —
- DSCR
- —
- Eligible?
- —
Personal DTI + credit; lowest rate.
DSCR
20% down · 8.5% · 30yr
- Down + closing
- —
- Monthly P&I
- —
- Monthly cashflow
- —
- DSCR
- —
- Eligible?
- —
No personal income docs; deal must DSCR.
Hard money
10% down · 12.0% · 12mo
- Down + closing
- —
- Monthly P&I
- —
- Monthly cashflow
- —
- DSCR
- —
- Eligible?
- —
Short-term bridge; refi at stabilization.
Listing history 38 events
-
2026-06-21days on market $619,000 Active 146 DOM
-
2026-06-19days on market $619,000 Active 144 DOM
-
2026-06-18days on market $619,000 Active 143 DOM
-
2026-06-17days on market $619,000 Active 142 DOM
-
2026-06-16days on market $619,000 Active 141 DOM
-
2026-06-15days on market $619,000 Active 140 DOM
-
2026-06-14days on market $619,000 Active 138 DOM
-
2026-06-12days on market $619,000 Active 137 DOM
-
2026-06-09days on market $619,000 Active 134 DOM
-
2026-06-08days on market $619,000 Active 133 DOM
-
2026-06-07days on market $619,000 Active 132 DOM
-
2026-06-05days on market $619,000 Active 129 DOM
-
2026-06-03days on market $619,000 Active 128 DOM
-
2026-06-02days on market $619,000 Active 127 DOM
-
2026-06-01days on market $619,000 Active 126 DOM
-
2026-05-31days on market $619,000 Active 125 DOM
-
2026-05-30days on market $619,000 Active 124 DOM
-
2026-01-26$619,000 Active 775-char remark
Show marketing remark (775 chars)
Located at 65 Royale Avenue in the heart of downtown Lakeport, this fully rented four unit apartment building offers an excellent investment opportunity in a highly walkable and convenient location just off Main Street. The two level property features approximately 3,200 square feet on a 6,534 square foot lot and includes four well configured units, each with two bedrooms and one bathroom. Select units have received cosmetic upgrades, and recent improvements include a new roof, providing added value and peace of mind. With all four units being rented you will have immediate income, covered parking, and close proximity to shopping, public transportation, dining, and Clear Lake, this property is ideally positioned for strong long term rental demand and future upside.
-
2022-04-26soldstatus $580,000 Sold 214-char remark
Show marketing remark (214 chars)
Centrally located 4 plex with a great walk score! Shopping, dining, public transportation a short walk. Easy to rent! All units are the same: 2/1, dining area, kitchen, good size livingroom, units are all electric.
-
2022-04-26soldstatus $580,000 214-char remark
Show marketing remark (214 chars)
Centrally located 4 plex with a great walk score! Shopping, dining, public transportation a short walk. Easy to rent! All units are the same: 2/1, dining area, kitchen, good size livingroom, units are all electric.
-
2022-04-26soldstatus $580,000
Show marketing remark (214 chars)
Centrally located 4 plex with a great walk score! Shopping, dining, public transportation a short walk. Easy to rent! All units are the same: 2/1, dining area, kitchen, good size livingroom, units are all electric.
-
2022-02-14status Pending - Show for Backups 214-char remark
Show marketing remark (214 chars)
Centrally located 4 plex with a great walk score! Shopping, dining, public transportation a short walk. Easy to rent! All units are the same: 2/1, dining area, kitchen, good size livingroom, units are all electric.
-
2021-12-02$595,000 New 214-char remark
Show marketing remark (214 chars)
Centrally located 4 plex with a great walk score! Shopping, dining, public transportation a short walk. Easy to rent! All units are the same: 2/1, dining area, kitchen, good size livingroom, units are all electric.
-
2021-12-02$595,000 214-char remark
Show marketing remark (214 chars)
Centrally located 4 plex with a great walk score! Shopping, dining, public transportation a short walk. Easy to rent! All units are the same: 2/1, dining area, kitchen, good size livingroom, units are all electric.
-
2017-08-17soldstatus $436,000 Closed Sale
-
2017-08-17soldstatus $436,000
-
2017-08-16soldstatus $436,000
-
2017-08-14status Pending Sale
-
2017-07-26historical Active Under Contract
-
2017-07-06$449,900 Active
-
2017-07-04$449,900
-
2015-11-06soldstatus $350,000
-
2015-11-06soldstatus $350,000 Closed Sale
-
2015-11-05soldstatus $350,000
-
2015-09-17historical Active Under Contract
-
2015-09-05$369,000 Active
-
2015-09-04$369,000
-
1992-08-21soldstatus $171,000
ⓘ Source: listings_history table (triggers on properties + properties_extension) + one-shot
backfill from property_details.listing_events for pre-trigger history.
Tax reassessment forecast CA · Resets to sale price
- Current annual tax
- $7,662 · $639/mo
- Projected year-2 tax
- $7,662 · $639/mo
- Expected delta
- $0/yr ($0/mo · 0.0%)
ⓘ Screening estimate from a state-policy table — verify with the county assessor before closing.
Climate risk First Street
- Flood 1/10 Low FEMA zone AE · 0% chance over 30 yrs
- Wildfire 8/10 Severe
- Heat 6/10 Major 7 d/yr ≥103°F today · 14 d/yr by 30 yrs out
- Wind 1/10 Low
- Air quality 10/10 Extreme 28 unhealthy d/yr today · 29 by 30 yrs out
Nearby sold comps map
Loading sold comps map…
Walkable amenities ~0.75 mi
Loading nearby amenities…
Taxation est. · year 1
- Rental income
- $72,012
- − Mortgage interest
- −$34,674
- − Property taxes
- −$7,662
- − Insurance
- −$8,214
- − Repairs & maintenance
- −$5,761
- − Management
- −$5,761
- − Depreciation
- −$18,007
- Taxable loss
- −$8,067
- Est. tax savings @ 24.0%
- +$1,936
- After-tax cash flow
- $3,997/yr
For passive investors: Depreciation is non-cash, so a rental often shows a tax loss while cash-flowing — sheltering income. Rental losses are passive: they offset passive income freely, and up to $25,000/yr can offset ordinary (W-2) income if you actively participate and your MAGI is under $100k (phasing out to $0 by $150k); unused losses carry forward. On sale, claimed depreciation is recaptured at up to 25%, and gains may owe capital-gains tax (a 1031 exchange can defer both). Figures are a year-1 estimate at your 24.0% rate — not tax advice; consult a CPA.
Schools (NCES district)
- District
- Lakeport Unified
- NCES district ID
- 0620670
- Math proficiency
- 13% ▼ -8.00%
- Reading proficiency
- 30% ▲ 1.00%
- Median HH income
- $44,332
- Composite
- 18.55/100
- National rank
- #8912
- State rank
- #451 of 517 in CA
Livability — Lakeport
- Score
- 54/100
- State rank
- #925
- US rank
- #24236
Category grades
Schools grade is shown separately in the Schools card above.
Census & demographics
- Census place
- Lakeport, CA
- County
- Lake County · 24,333 people
- City population
- 11,741
- Metro
- Clearlake, CA
- Population (ZIP)
- 11,741
- Household income
- $71,419
- Rent vs Own
- Severe rent burden
- 250.0
Population outlook (Lake County) Hauer SSP2
- Today (2025)
- 62,396 people
- By 2030
- 60,626 · -2.8%
- By 2040
- 56,453 · -9.5%
- By 2050
- 53,054 · -15.0%
- By 2075
- 47,663 · -23.6%
- By 2100
- 41,804 · -33.0%
Race, ethnicity, and origin ACS 2023
- Neighborhood character
- Predominantly White (74%)
- Race & ethnicity
- White 74% Hispanic / Latino 14% Two or more races 9% Native American 5% Asian 1%
- Hispanic origin (detail)
- Mexican 10%
- Common ancestry
- Italian 3% Slovak 3% Romanian 2%
- Foreign-born
- 6% · Canada
- Languages at home
- 89% English-only · Spanish 9% Other Indo-European 1%
Political lean MEDSL · Lake
- 2024 margin
- Toss-up / Even · D 47.8% · R 49.2% · Other 3.0%
- 2008→2024 swing
- -20.6pp toward R · 2008: 19.3pp · 2024: -1.4pp
- All cycles
- 2024: R+1.4 2020: D+6.3 2016: D+3.7 2012: D+16.5 2008: D+19.3
Not yet ingested
- Civics
- —
Market trends
- HPI YoY
- ▼ -176.01%
- Current HPI
- 155.5391
- Rent YoY
- —
- Metro
- Clearlake, CA
- State GDP YoY
- ▲ 3.21%
- F500 in state
- 116
Industry mix (Fortune 500 HQ in CA)
| Industry | F500 HQs | Revenue |
|---|---|---|
| Technology | 27 | $1,492B |
|
||
| Financial Services | 3 | $174B |
|
||
| Retail | 3 | $44B |
|
||
| Insurance | 3 | $26B |
|
||
| Media / Entertainment | 2 | $115B |
|
||
| Pharmaceuticals / Biotech | 2 | $62B |
|
||
Price history
+262.0% since first listed21 events — show timeline
- 2026-01-26 Listed $619,000 CRMLS
- 2022-04-26 Sold (Public Records) $580,000 Public Records
- 2022-04-26 Sold (MLS) $580,000 San Francisco MLS
- 2022-04-26 Sold (MLS) $580,000 bridgeMLS, Bay East AOR, or Contra Costa AOR
- 2022-02-14 Pending — bridgeMLS, Bay East AOR, or Contra Costa AOR
- 2021-12-02 Listed $595,000 San Francisco MLS
- 2021-12-02 Listed $595,000 bridgeMLS, Bay East AOR, or Contra Costa AOR
- 2017-08-17 Sold (MLS) $436,000 SDMLS
- 2017-08-17 Sold (MLS) $436,000 CRMLS
- 2017-08-16 Sold (Public Records) $436,000 Public Records
- 2017-08-14 Pending — CRMLS
- 2017-07-26 Contingent — CRMLS
- 2017-07-06 Listed $449,900 CRMLS
- 2017-07-04 Listed $449,900 SDMLS
- 2015-11-06 Sold (MLS) $350,000 CRMLS
- 2015-11-06 Sold (MLS) $350,000 SDMLS
- 2015-11-05 Sold (Public Records) $350,000 Public Records
- 2015-09-17 Contingent — CRMLS
- 2015-09-05 Listed $369,000 CRMLS
- 2015-09-04 Listed $369,000 SDMLS
- 1992-08-21 Sold (Public Records) $171,000 Public Records
Property tax history
+9.3%/yrLatest (2025): $7,662 · +2.4% YoY. Source: county tax records.
Cash-flow waterfall
monthlySold comps — $/sqft
last 12 mo · ≤1 miLoading sold comps…