553 Redberry Rd · Lyons, TX
Flood risk No data
- FEMA flood zone
- —
- Chance of flooding over 30 yrs
- —
- Est. flood insurance / yr
- —
Fire risk No data
- Est. fire insurance / yr
- —
Heat risk No data
- Hot days now (above threshold)
- —
- Hot days in 30 yrs
- —
Wind risk No data
- Chance of severe wind over 30 yrs
- —
Air-quality risk No data
- Unhealthy air days now
- —
- Unhealthy air days in 30 yrs
- —
Risk factors via First Street. Map © Google.
Why this score? — see what drove the F grade
The composite is a weighted blend of 9 inputs, each scored 0–100. Each bar is that input's sub-score; the figure is the points it added to the 100-point composite (weight × sub-score).
- ARV discount +7.5/15.0
- Appreciation +5.6/10.0
- Cash flow +3.4/30.0
- Schools +2.8/10.0
- Rent growth +2.5/5.0
- Livability +2.5/5.0
- Condition / age +2.5/5.0
- 1% rule +0.0/10.0
- DSCR +0.0/10.0
$265,000
🖨 Deal sheet (PDF) 📄 Offer letter ✓ Due diligence
Listing remarks MLS
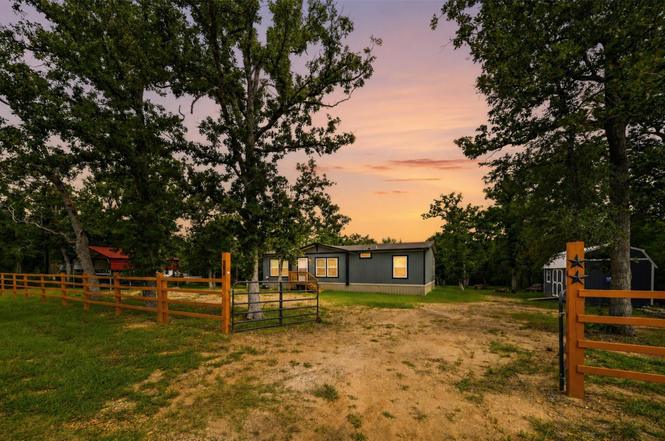
This lot is located in the Enchanted Oaks subdivision, offering a rural and serene atmosphere close to Birch Creek State Park and Lake Somerville. This proximity to a state park and a lake offers the potential for outdoor recreational activities such as boating, fishing, hiking, and more. The property is over half an acre, which provides ample space for various purposes. The presence of native trees adds to the natural beauty of the lot and can offer shade and privacy. There is a meandering ditch located midway on the property and appears to be a natural channel, the property boundary continues past this in back. Enchanted Oaks has the essential utilities in place, including public water and Bluebonnet Electric, which can make it easier to build or set up a residence. Manufactured homes, RVs, and tiny homes are welcome.
Key facts
- Great room
- Open-concept layout
- 0.56 acre lot
Tags
Property features AI
Finance
- Other: Property sits on about 0.555 acre (approx. 24,180 sq ft)
Exterior
- Parking: No designated parking
- Security: Smoke detectors
- Utilities: Septic tank; Asphalt road access
- Home design: Residential property; Built in 2024; Pillar/post/pier foundation; Composition roof; Living area approximately 1,150
- Construction: Cement siding
- Exterior features: Deck; Patio; Fence (partial); Storage shed; Outdoor storage; Wooded lot
Interior
- Kitchen: Dishwasher; Electric cooktop; Microwave; Oven; Kitchen island
- Bedrooms: Primary bedroom (First level) — approx. 12'6" x 12'8"; Bedroom (First level) — approx. 11'3" x 12'9"; Bedroom (First level) — approx. 10'11" x 8'9"; Home configured for 3 bedrooms
- Flooring: Laminate; Tile
- Bathrooms: 2 full bathrooms
- Heating & cooling: Central heating (electric); Central air (electric); Programmable thermostat
- Interior features: Double vanity; Kitchen island; Kitchen/family room combo; Ceiling fans; Programmable thermostat
- Laundry & utility: Washer hookup; Electric dryer hookup; Utility room (First level) — approx. 7'5" x 6'0"
Neighborhood map
What this means for you Summary
Snapshot
- This is a 3-bed/2.0-bath other listed at $265k.
Deal economics
- At list price, monthly cash flow is $-808 ($-10k/yr) — negative.
- To cash-flow at today's rent, offer at most $122k (53.9% below list).
- To meet the 1% rule (rent ≥ 1% of price), the offer needs to be $96k (64.0% below list).
- Recommended offer: $96k (64.0% below list) — sets the bar for 1% rule.
- Cap rate 2.6% vs local median 3.9% in Lyons — below-typical yield; the buyer is paying a premium for something (appreciation thesis, condition, location) that the cap rate doesn't capture.
Location & tenants
- Location reads: area grade F — affects rentability + tenant quality, not the cash-flow math above.
- Somerville ISD (rural): math 36% / reading 29% proficiency, ranked #579 of 826 in TX (top 70%) — families likely to look elsewhere, expect single-tenant / working-renter base with shorter leases; 61% free/reduced lunch — lower-income household profile, screen leases tightly.
- Zoned schools: Somerville El (math 22% / reading 12%, grade F, #3,836 of 4,322 statewide, top 91%, 225 students, 77% FRL); Somerville Int (math 47% / reading 32%, grade F, #660 of 1,662 statewide, top 41%, 109 students, 72% FRL); Somerville H S (math 32% / reading 37%, grade F, #963 of 1,632 statewide, top 61%, 199 students, 72% FRL).
- Market conditions: 222 active listings in the ZIP; 44 units permitted in Burleson County in 2024 (0 in 5+ unit buildings).
Forward outlook
- In year one you build about $5k of equity ($2k loan paydown + $3k appreciation (1.2% local appreciation)).
- By year 7, paydown + projected appreciation supports a ~$34k cash-out refi (75% LTV) — recoverable capital for the next deal without selling this one.
Negotiation context
- Only 6 days on market — expect competitive offers; lowballing is unlikely to land.
- 2 sale attempts since 3y ago with the ask held roughly flat each time — persistent listings suggest the price (not the market) is what's stuck; bring a comps-based counter.
Questions for the listing agent
- What do current leases actually rent for vs. the listed asking? Can we see a recent rent roll and the last 12 months of T-12 income?
- Is there a deadline driving the sale (1031 exchange, divorce, estate, relocation)? That informs how much negotiation room exists.
- The area grade is low — what's the realistic commute time and amenity access for the typical tenant pool here? Any planned neighborhood developments (good or bad) we should know about?
- What's the average days-on-market for RENTAL listings here right now (not sales)? A rising rental-DOM trend means longer vacancies and softer asking-rent achievability than the comps imply.
- What's the recent tenant-quality profile in this submarket — average credit score on applications, eviction rate, late-payment / NSF rate, and stable-employment percentage? A property-management company in the area should have these aggregated.
- How much new for-sale + rental construction is in the pipeline within 1–3 miles? Heavy new supply typically softens prices + rents 12–24 months out; constrained supply supports both.
Investment metrics
- 1% rule
- 0.36% ✗
- Cap rate
- 2.63%
- Cash-on-cash
- -13.07%
- DSCR
- 0.42
- GRM
- 23.1
CMA / ARV
No comps found within radius.
Projected returns pro-forma
1.2% appreciation · 3.0% rent growth · sell at horizon
- IRR
- -11.6%
- Equity multiple
- 0.41×
- Total profit
- $-44,017
- Equity at exit
- $93,295
- IRR
- -5.6%
- Equity multiple
- 0.30×
- Total profit
- $-52,166
- Equity at exit
- $126,198
Cash invested: $74,200 (down + closing). Projections, not guarantees.
Landlord ↔ Tenant lean methodology
- Overall (STATE)
- 87 Strongly Landlord-Friendly
- State Texas
- 87 Strongly Landlord-Friendly · R+5
- County
- — inherits STATE
- City
- — inherits STATE
ZIP-level market 77879
- Home prices YoY
- 0.7%
- Active inventory
- 222
- Price-to-rent
- 23.1×
Monthly cashflow live
- Estimated rent
- $955 medium interval (Pro) →
- Mortgage (P&I)
- −$1,390
- Tax from tax record
- −$63 /mo · $754/yr
- Insurance
- −$110
- HOA
- −$0
- Vacancy / Maint / Mgmt
- −$201
- Net cashflow
- $-808
Break-even live
Sensitivity live
| Price | -10% $-658 | -5% $-733 | +0% $-808 | +5% $-883 | +10% $-958 |
|---|---|---|---|---|---|
| Rent | -10% $-884 | -5% $-846 | +0% $-808 | +5% $-771 | +10% $-733 |
| Rate | -1.0pp $-675 | -0.5pp $-741 | base $-808 | +0.5pp $-877 | +1.0pp $-947 |
UW: 25.0% down · 7.5% · 30yr · 1.5% tax · 5.0% vac · 8.0% maint · 8.0% mgmt
Financing live
Cash to close
- Down payment
- $66,250
- Closing costs
- $7,950
- Reserves months
- —
- Total cash needed
- —
Loan-product check · same deal, 3 products live
Conventional
25% down · 7.5% · 30yr
- Down + closing
- —
- Monthly P&I
- —
- Monthly cashflow
- —
- DSCR
- —
- Eligible?
- —
Personal DTI + credit; lowest rate.
DSCR
20% down · 8.5% · 30yr
- Down + closing
- —
- Monthly P&I
- —
- Monthly cashflow
- —
- DSCR
- —
- Eligible?
- —
No personal income docs; deal must DSCR.
Hard money
10% down · 12.0% · 12mo
- Down + closing
- —
- Monthly P&I
- —
- Monthly cashflow
- —
- DSCR
- —
- Eligible?
- —
Short-term bridge; refi at stabilization.
Listing history 6 events
-
2026-06-21days on market $265,000 Active 6 DOM
-
2026-06-19days on market $265,000 Active 4 DOM
-
2026-06-18days on market $265,000 Active 3 DOM
-
2026-06-17days on market $265,000 Active 2 DOM
-
2026-06-16remarks 699-char remark
-
2026-06-16$265,000 Active 1 DOM
ⓘ Source: listings_history table (triggers on properties + properties_extension) + one-shot
backfill from property_details.listing_events for pre-trigger history.
Tax reassessment forecast TX · Resets to sale price
- Current annual tax
- $754 · $63/mo
- Projected year-2 tax
- $4,850 · $404/mo
- Expected delta
- +$4,095/yr (+$341/mo · 542.9%)
ⓘ Screening estimate from a state-policy table — verify with the county assessor before closing.
Nearby sold comps map
Loading sold comps map…
Walkable amenities ~0.75 mi
Loading nearby amenities…
Taxation est. · year 1
- Rental income
- $11,463
- − Mortgage interest
- −$14,844
- − Property taxes
- −$754
- − Insurance
- −$1,325
- − Repairs & maintenance
- −$917
- − Management
- −$917
- − Depreciation
- −$7,709
- Taxable loss
- −$15,003
- Est. tax savings @ 24.0%
- +$3,601
- After-tax cash flow
- $-6,099/yr
For passive investors: Depreciation is non-cash, so a rental often shows a tax loss while cash-flowing — sheltering income. Rental losses are passive: they offset passive income freely, and up to $25,000/yr can offset ordinary (W-2) income if you actively participate and your MAGI is under $100k (phasing out to $0 by $150k); unused losses carry forward. On sale, claimed depreciation is recaptured at up to 25%, and gains may owe capital-gains tax (a 1031 exchange can defer both). Figures are a year-1 estimate at your 24.0% rate — not tax advice; consult a CPA.
Schools (NCES district)
- District
- Somerville ISD
- NCES district ID
- 4840770
- Math proficiency
- 36% ▲ 10.00%
- Reading proficiency
- 29% ▬ 0.00%
- Median HH income
- $42,453
- Composite
- 27.59/100
- National rank
- #6936
- State rank
- #579 of 826 in TX
Livability — Lyons
No livability data for this city. (Only ~50 U.S. cities are tracked.)
Census & demographics
- City population
- 370
- Population (ZIP)
- 4,775
Population outlook (Burleson County) Hauer SSP2
- Today (2025)
- 18,066 people
- By 2030
- 18,174 · +0.6%
- By 2040
- 18,198 · +0.7%
- By 2050
- 18,110 · +0.2%
- By 2075
- 18,166 · +0.6%
- By 2100
- 16,949 · -6.2%
Race, ethnicity, and origin ACS 2023
- Neighborhood character
- Diverse neighborhood (Simpson 0.58)
- Race & ethnicity
- White 59% Hispanic / Latino 23% Two or more races 15% Black 14% Native American 2%
- Hispanic origin (detail)
- Mexican 20%
- Common ancestry
- Lithuanian 2% Slovak 2% Serbian 1%
- Foreign-born
- 8% · Canada, Vietnam
- Languages at home
- 84% English-only · Spanish 14% Vietnamese 1% Tagalog/Filipino 1%
Political lean MEDSL · Burleson
- 2024 margin
- Solid R (+62.8) · D 18.2% · R 81.0%
- 2008→2024 swing
- -25.4pp toward R · 2008: -37.4pp · 2024: -62.8pp
- All cycles
- 2024: R+62.8 2020: R+57.6 2016: R+55.1 2012: R+46.0 2008: R+37.4
Not yet ingested
- Civics
- —
Market trends
- HPI YoY
- ▲ 1.20%
- Current HPI
- 178.3416
- Rent YoY
- —
- Metro
- —
- State GDP YoY
- ▲ 3.95%
- F500 in state
- 110
Industry mix (Fortune 500 HQ in TX)
| Industry | F500 HQs | Revenue |
|---|---|---|
| Energy | 16 | $1,198B |
|
||
| Technology | 5 | $198B |
|
||
| Engineering / Construction | 4 | $72B |
|
||
| Energy Services | 3 | $60B |
|
||
| Utilities | 3 | $41B |
|
||
| Healthcare | 2 | $330B |
|
||
Price history
+446.4% since first listed7 events — show timeline
- 2026-06-15 Listed $265,000 HARMLS
- 2024-01-09 Sold (Public Records) — Public Records
- 2024-01-09 Sold (Public Records) — Public Records
- 2023-12-29 Sold (MLS) — HARMLS
- 2023-12-17 Pending — HARMLS
- 2023-11-21 Pending — HARMLS
- 2023-11-02 Listed $48,500 HARMLS
Property tax history
+22.9%/yrLatest (2025): $754 · +75.9% YoY. Source: county tax records.
Cash-flow waterfall
monthlySold comps — $/sqft
last 12 mo · ≤1 miLoading sold comps…