 Duplex
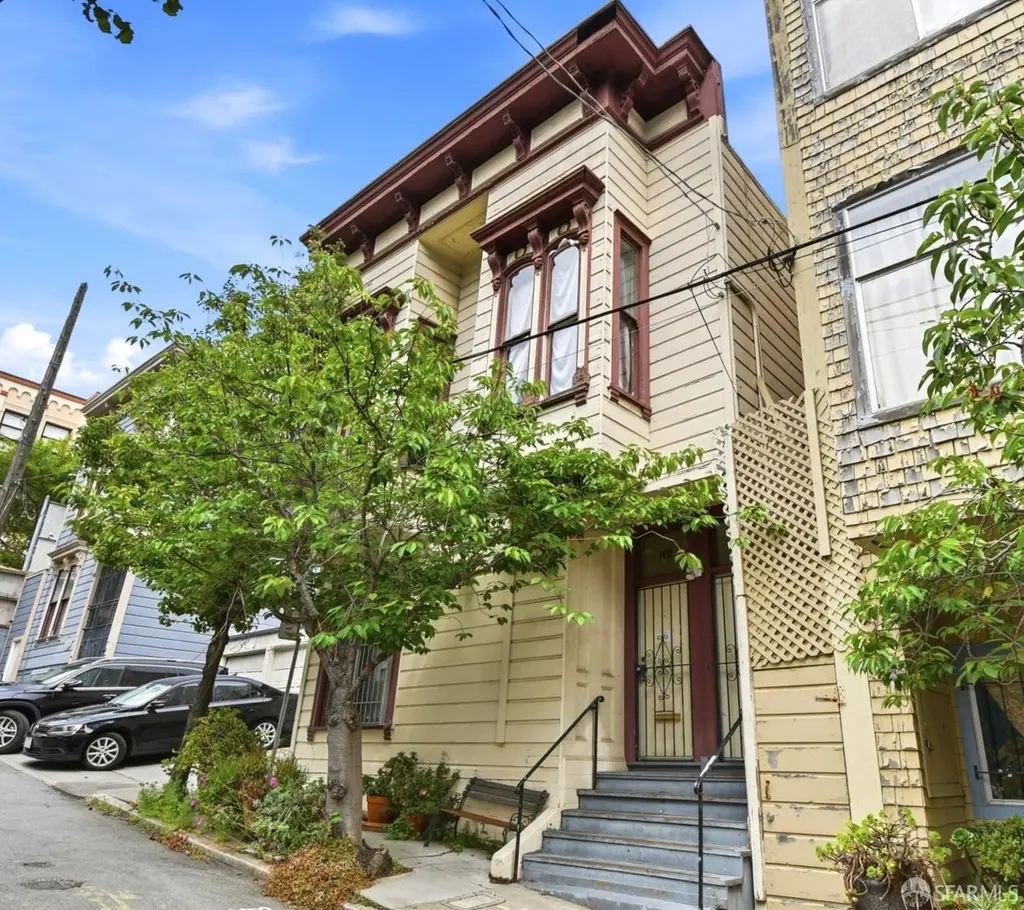
438-440 Lily St · San Francisco, CA
Flood risk No data
- FEMA flood zone
- —
- Chance of flooding over 30 yrs
- —
- Est. flood insurance / yr
- —
Fire risk No data
- Est. fire insurance / yr
- —
Heat risk No data
- Hot days now (above threshold)
- —
- Hot days in 30 yrs
- —
Wind risk No data
- Chance of severe wind over 30 yrs
- —
Air-quality risk No data
- Unhealthy air days now
- —
- Unhealthy air days in 30 yrs
- —
Risk factors via First Street. Map © Google.
Why this score? — see what drove the A grade
The composite is a weighted blend of 9 inputs, each scored 0–100. Each bar is that input's sub-score; the figure is the points it added to the 100-point composite (weight × sub-score).
- Cash flow +30.0/30.0
- ARV discount +15.0/15.0
- 1% rule +10.0/10.0
- DSCR +10.0/10.0
- Appreciation +7.4/10.0
- Rent growth +5.0/5.0
- Schools +5.0/10.0
- Livability +3.8/5.0
- Condition / age +2.5/5.0
$650,000
🖨 Deal sheet 📄 Offer letter ✓ Due diligence
Multi-family units
County records classify this as Multi-Family (2-4 Unit). Listing-text estimate: 2 units. confirmed
Listing remarks
Duplex located on quiet tree-lined street in the desirable Lower Haight neighborhood. Fully occupied, long term tenants. Building consists of a 1BD/1BA unit and a 2BD/1BA unit totaling approximately 1,560 SF. Both units offer spacious layouts, high ceilings, and classic period details. Current rents are below market, presenting a significant value-add opportunity. Excellent location in Lower Haight, near Hayes Valley, public transportation, dining, retail, and major employment centers.
Key facts
- Spacious layouts
- High ceilings
- 1,237 sq ft lot
Tags
Property features AI
Finance
- Financial info: Two-unit property with 2 leased units
- HOA & community: No association fee
Exterior
- Utilities: Gas on a separate meter; Electric on a separate meter
- Home design: Residential income duplex; Two-story building; One building on the lot
- Construction: Built in 1900; Wood construction with wood siding; Flat roof; Concrete and masonry perimeter foundation
- Exterior features: Located on a cul-de-sac
Interior
- Kitchen: No kitchen appliance details provided
- Bedrooms: 3 bedrooms; Unit 1: 1 bed, 1 bath; Unit 2: 2 bed, 1 bath
- Bathrooms: 2 full bathrooms (total)
- Heating & cooling: Wall furnace heating
- Interior features: Wall furnace heating; Gas water heater
- Laundry & utility: No laundry details provided
Neighborhood map
What this means for you Summary
Snapshot
- This is a 2 × 3-bed/1.0-bath units multifamily listed at $650k.
Deal economics
- At list price, monthly cash flow is $4k ($52k/yr) — positive. Per door: $2k/mo.
- The deal already cash-flows at list — no discount required.
- Meets the 1% rule at list price ($11k rent vs $650k).
- Cap rate 14.2% vs local median 2.1% in San Francisco — top-decile yield for the area; either an underpriced asset or a hidden risk that comps aren't pricing in. Stress-test before assuming the spread holds.
Location & tenants
- Location reads 76/100 on livability (#90 in CA, #3,143 nationally) — a middle-class / working-renter tenant base. Strengths: amenities A+, commute A+, employment A+; Watch: crime F, cost of living F.
- San Francisco Unified (urban): math 50% / reading 56% proficiency, ranked #322 of 1,400 in CA (top 23%) — acceptable for families but not a draw, mixed tenant base, ~2y average lease.
- Market conditions: Rents rising fast (+10.1%/yr); 63 active listings in the ZIP; 750 units permitted in San Francisco County in 2024 (688 in 5+ unit buildings).
- At $11,121/mo this rent would consume 221% of the median local household income ($60k/yr) (locally 3769% of renters already pay >50% of income on rent) — very limited rent-growth headroom before tenants either downsize or default.
Forward outlook
- In year one you build about $36k of equity ($4k loan paydown + $31k appreciation (4.8% local appreciation)).
- San Francisco County population projected at +39% by 2050 — long-run rental-demand tailwind backs the buy-and-hold thesis.
- At projected returns (4.8% appreciation + 8.0% rent growth), your $182k cash investment doubles in ~2 years — after that, you're playing with house money.
- By year 2, paydown + projected appreciation supports a ~$57k cash-out refi (75% LTV) — recoverable capital for the next deal without selling this one.
Negotiation context
- Only 13 days on market — expect competitive offers; lowballing is unlikely to land.
Risks & watch-outs
- Watch-outs: built in 1900 — expect roof / HVAC / electrical / plumbing capex.
Questions for the listing agent
- Can we see the unit-by-unit rent roll, current vacancy, and any below-market leases? What's the average tenancy length?
- What capital expenditures (roof, boiler, parking lot, exteriors) have been made in the last 5 years, and what's planned in the next 2?
- Built in 1900 — when were the roof, HVAC, electrical panel, plumbing, and water heater last replaced?
- Is there a deadline driving the sale (1031 exchange, divorce, estate, relocation)? That informs how much negotiation room exists.
- Schools are B-rated — typically a magnet for longer-tenancy family renters. What's the average tenant stay here, and is there a school-zone premium baked into asking?
- Crime grade is F in this area — have there been break-ins, vandalism, or insurance claims at this property in the last 3 years? What carrier currently insures it and at what premium?
- What's the average days-on-market for RENTAL listings here right now (not sales)? A rising rental-DOM trend means longer vacancies and softer asking-rent achievability than the comps imply.
- What's the recent tenant-quality profile in this submarket — average credit score on applications, eviction rate, late-payment / NSF rate, and stable-employment percentage? A property-management company in the area should have these aggregated.
- How much new apartment / multifamily construction is in the pipeline within 1–3 miles? Heavy new supply (>2% of stock underway) typically softens rents 12–24 months out; light construction supports rent growth.
Investment metrics
- 1% rule
- 1.71% ✓
- Cap rate
- 14.22%
- Cash-on-cash
- 28.31%
- DSCR
- 2.26
- GRM
- 4.9
CMA / ARV
- ARV (on-the-fly)
- $819,000
- Comps found
- 1
Show comp detail 1 sale within ~0.75 mi
| Address | Dist | Beds/Ba | Sqft | Sold | Price | $/sf | Match |
|---|---|---|---|---|---|---|---|
| 1048-1050 Oak St | 0.46mi | 6/— | 1,380 (-12%) | 6mo | $725,000 | $525 | 55 |
Match score weights: distance 35% · size 25% · config 20% · recency 20%. Top-matched comps best support the ARV.
Projected returns pro-forma
4.8% appreciation · 8.0% rent growth · sell at horizon
- IRR
- 41.1%
- Equity multiple
- 3.61×
- Total profit
- $474,711
- Equity at exit
- $360,362
- IRR
- 41.7%
- Equity multiple
- 8.38×
- Total profit
- $1,343,711
- Equity at exit
- $615,433
Cash invested: $182,000 (down + closing). Projections, not guarantees.
Landlord ↔ Tenant lean methodology
- Overall (CITY)
- 0 Strongly Tenant-Friendly
- State California
- 18 Strongly Tenant-Friendly · D+13
- County
- — inherits STATE
- City San Francisco
- 0 Strongly Tenant-Friendly · D+57
ZIP-level market 94102
- Home prices YoY
- 2.7%
- Rents YoY
- 10.1%
- Active inventory
- 63
- Price-to-rent
- 9.7×
Monthly cashflow live
- Estimated rent
- $11,121 high interval (Pro) →
- Mortgage (P&I)
- −$3,409
- Tax est. 1.5%
- −$812 /mo · $9,750/yr
- Insurance
- −$271
- HOA
- −$0
- Vacancy / Maint / Mgmt
- −$2,335
- Net cashflow
- $4,294
Break-even live
2-unit breakdown (identical units grouped — click to expand)
| Units | Beds | Baths | Est. rent |
|---|---|---|---|
| 2× units | 3 | 1 | $11,122 |
| #1 | 3 | 1 | $5,561 |
| #2 | 3 | 1 | $5,561 |
| Total (2 units) | $11,121 | ||
UW: 25.0% down · 7.5% · 30yr · 1.5% tax · 5.0% vac · 8.0% maint · 8.0% mgmt
Financing live
Cash to close
- Down payment
- $162,500
- Closing costs
- $19,500
- Reserves months
- —
- Total cash needed
- —
Loan-product check · same deal, 3 products live
Conventional
25% down · 7.5% · 30yr
- Down + closing
- —
- Monthly P&I
- —
- Monthly cashflow
- —
- DSCR
- —
- Eligible?
- —
Personal DTI + credit; lowest rate.
DSCR
20% down · 8.5% · 30yr
- Down + closing
- —
- Monthly P&I
- —
- Monthly cashflow
- —
- DSCR
- —
- Eligible?
- —
No personal income docs; deal must DSCR.
Hard money
10% down · 12.0% · 12mo
- Down + closing
- —
- Monthly P&I
- —
- Monthly cashflow
- —
- DSCR
- —
- Eligible?
- —
Short-term bridge; refi at stabilization.
Listing history 10 events
-
2026-06-18days on market $650,000 Active 13 DOM
-
2026-06-17days on market $650,000 Active 12 DOM
-
2026-06-16days on market $650,000 Active 11 DOM
-
2026-06-15days on market $650,000 Active 10 DOM
-
2026-06-13days on market $650,000 Active 8 DOM
-
2026-06-13days on market $650,000 Active 7 DOM
-
2026-06-09days on market $650,000 Active 4 DOM
-
2026-06-08days on market $650,000 Active 3 DOM
-
2026-06-07remarks 490-char remark
-
2026-06-07$650,000 Active 2 DOM
ⓘ Source: listings_history table (triggers on properties + properties_extension) + one-shot
backfill from property_details.listing_events for pre-trigger history.
Nearby sold comps map
Loading sold comps map…
Walkable amenities ~0.75 mi
Loading nearby amenities…
Taxation est. · year 1
- Rental income
- $133,452
- − Mortgage interest
- −$36,410
- − Property taxes
- −$9,750
- − Insurance
- −$3,250
- − Repairs & maintenance
- −$10,676
- − Management
- −$10,676
- − Depreciation
- −$18,909
- Taxable income
- $43,780
- Est. tax owed @ 24.0%
- −$10,507
- After-tax cash flow
- $41,016/yr
For passive investors: Depreciation is non-cash, so a rental often shows a tax loss while cash-flowing — sheltering income. Rental losses are passive: they offset passive income freely, and up to $25,000/yr can offset ordinary (W-2) income if you actively participate and your MAGI is under $100k (phasing out to $0 by $150k); unused losses carry forward. On sale, claimed depreciation is recaptured at up to 25%, and gains may owe capital-gains tax (a 1031 exchange can defer both). Figures are a year-1 estimate at your 24.0% rate — not tax advice; consult a CPA.
Schools (NCES district)
- District
- San Francisco Unified
- NCES district ID
- 0634410
- Math proficiency
- 50% ▬ 0.00%
- Reading proficiency
- 56% ▲ 1.00%
- Median HH income
- $81,249
- Composite
- 50.14/100
- National rank
- #4088
- State rank
- #322 of 1400 in CA
Livability — San Francisco
- Score
- 76/100
- State rank
- #90
- US rank
- #3143
Category grades
Schools grade is shown separately in the Schools card above.
Census & demographics
- Census place
- San Francisco, CA
- County
- San Francisco County · 827,552 people
- City population
- 827,552
- Metro
- San Francisco-Oakland-Berkeley, CA
- Population (ZIP)
- 35,976
- Household income
- $60,431
- Rent vs Own
- Severe rent burden
- 3769.0
Population outlook (San Francisco County) Hauer SSP2
- Today (2025)
- 1,030,936 people
- By 2030
- 1,110,409 · +7.7%
- By 2040
- 1,270,010 · +23.2%
- By 2050
- 1,435,001 · +39.2%
- By 2075
- 1,779,074 · +72.6%
- By 2100
- 1,966,767 · +90.8%
Race, ethnicity, and origin ACS 2023
- Neighborhood character
- Highly diverse neighborhood (Simpson 0.77)
- Race & ethnicity
- White 31% Asian 28% Hispanic / Latino 22% Two or more races 13% Black 9% Native American 2%
- Hispanic origin (detail)
- Mexican 15% Puerto Rican 1%
- Common ancestry
- Scotch-Irish 2% Romanian 2% Lithuanian 2%
- Foreign-born
- 41% · Canada, China, Vietnam
- Languages at home
- 52% English-only · Spanish 16% Chinese 10% Vietnamese 5%
Political lean MEDSL · San Francisco
- 2024 margin
- Solid D (+64.8) · D 80.3% · R 15.5% · Other 4.1%
- 2008→2024 swing
- -5.7pp toward R · 2008: 70.5pp · 2024: 64.8pp
- All cycles
- 2024: D+64.8 2020: D+72.5 2016: D+76.1 2012: D+70.2 2008: D+70.5
Not yet ingested
- Civics
- —
Market trends
- HPI YoY
- ▲ 4.80%
- Current HPI
- 184.4403
- Rent YoY
- ▲ 10.11%
- Metro
- San Francisco-Oakland-Berkeley, CA
- State GDP YoY
- ▲ 3.21%
- F500 in state
- 116
Industry mix (Fortune 500 HQ in CA)
| Industry | F500 HQs | Revenue |
|---|---|---|
| Technology | 27 | $1,492B |
|
||
| Financial Services | 3 | $174B |
|
||
| Retail | 3 | $44B |
|
||
| Insurance | 3 | $26B |
|
||
| Media / Entertainment | 2 | $115B |
|
||
| Pharmaceuticals / Biotech | 2 | $62B |
|
||
Price history
1 event — show timeline
- 2026-06-05 Listed $650,000 San Francisco MLS
Property tax history
+1.2%/yrLatest (2025): $280 · +30.8% YoY. Source: county tax records.
Cash-flow waterfall
monthlySold comps — $/sqft
last 12 mo · ≤1 miLoading sold comps…