1124 Morraine View Dr #103 · Madison, WI
Flood risk 1/10 · Minimal
- FEMA flood zone
- X (unshaded)
- Chance of flooding over 30 yrs
- 0.0%
- Est. flood insurance / yr
- $507 – $1,088
Fire risk 1/10 · Minimal
- Est. fire insurance / yr
- $636 – $1,182
Heat risk 2/10 · Minimal
- Hot days now (above 98°F)
- 7 days/yr
- Hot days in 30 yrs
- 14 days/yr
Wind risk 2/10 · Minimal
- Chance of severe wind over 30 yrs
- —
Air-quality risk 2/10 · Minimal
- Unhealthy air days now
- 1 days/yr
- Unhealthy air days in 30 yrs
- 1 days/yr
Risk factors via First Street. Map © Google.
Why this score? — see what drove the C grade
The composite is a weighted blend of 9 inputs, each scored 0–100. Each bar is that input's sub-score; the figure is the points it added to the 100-point composite (weight × sub-score).
- Cash flow +20.1/30.0
- ARV discount +7.5/15.0
- 1% rule +7.3/10.0
- DSCR +6.4/10.0
- Schools +4.9/10.0
- Livability +4.2/5.0
- Rent growth +3.5/5.0
- Condition / age +2.5/5.0
- Appreciation +0.0/10.0
$165,000
🖨 Deal sheet 📄 Offer letter ✓ Due diligence
Listing remarks MLS
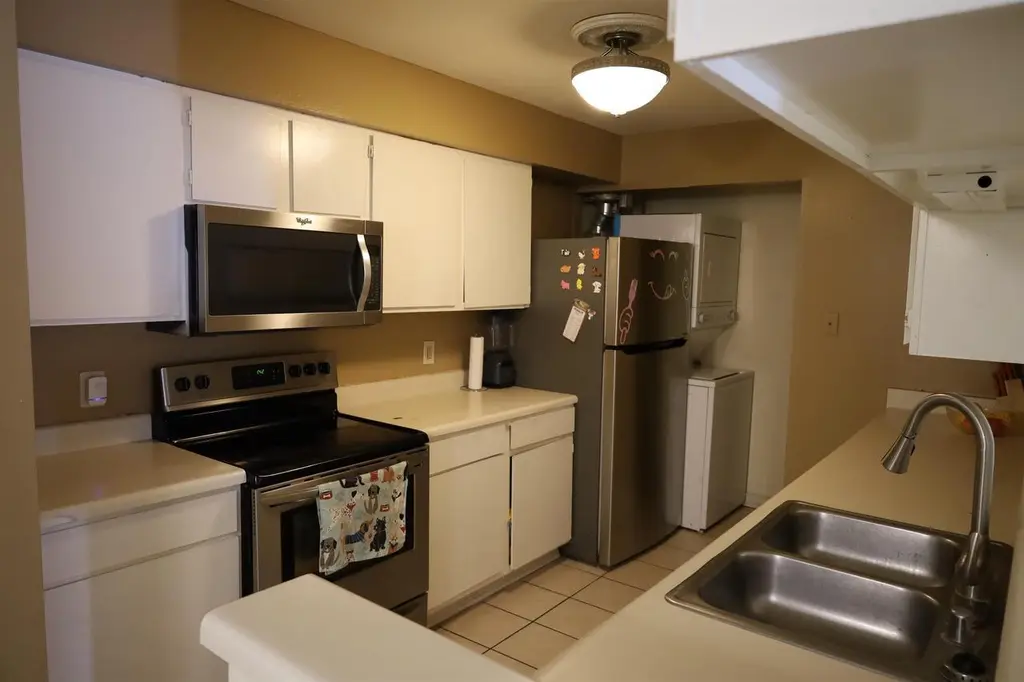
Convenient first-floor unit with underground parking included. Enjoy access to a beautifully renovated clubhouse, updated hallways, and a modern fitness center. Great location?close to Elver Park, West Towne Mall, and various grocery stores.
Key facts
- $300 HOA
- Built 1989
- Listed 90 days
Neighborhood map
What this means for you Summary
Snapshot
- This is a 3-bed/1.0-bath condo listed at $165k.
Deal economics
- At list price, monthly cash flow is $206 ($2k/yr) — positive.
- The deal already cash-flows at list — no discount required.
- Meets the 1% rule at list price ($2k rent vs $165k).
- Recommended offer: $155k (6.0% below list) — sets the bar for market timing.
- Cap rate 7.8% vs local median 2.4% in Madison — top-decile yield for the area; either an underpriced asset or a hidden risk that comps aren't pricing in. Stress-test before assuming the spread holds.
Location & tenants
- Location reads 84/100 on livability (#39 in WI, #819 nationally) — a professional / high-income tenant draw. Strengths: commute A+, employment A+, housing A+; Watch: schools C-.
- Middleton-Cross Plains Area School District (suburban): math 52% / reading 56% proficiency, ranked #36 of 342 in WI (top 10%) — acceptable for families but not a draw, mixed tenant base, ~2y average lease; only 15% free/reduced lunch — higher-income household profile.
- Market conditions: Rents rising fast (+4.0%/yr); 150 active listings in the ZIP; 34 comparable units currently listed for rent nearby; rentals at typical pace (median 14d on market — plan ~3-4 weeks tenant-placement turnaround); solid renter incomes; 5,519 units permitted in Dane County in 2024 (3,978 in 5+ unit buildings).
Forward outlook
- Local home prices are declining (-3.0%/yr); year-one equity from $1k of loan paydown is wiped out by about $5k of value loss. Plan a longer hold.
- Dane County population projected at +35% by 2050 — long-run rental-demand tailwind backs the buy-and-hold thesis.
Negotiation context
- It's been on market 90 days — a 6% lower offer ($155k) is reasonable based on typical stale-listing flexibility.
- Current owner paid $76k; list at $165k implies a 116% gain — meaningful room to come down on a strong offer.
Questions for the listing agent
- It's been on market 90 days. Have you received any prior offers? Is the seller open to a 6% concession, seller financing, or rate buy-down credit?
- What does the HOA fee cover, when was the last increase, and are there any pending special assessments or reserve-fund shortfalls?
- Any open or pending special assessments — roof, HVAC, plumbing, elevator, façade? What's the per-unit balance and payoff schedule, and is the seller paying it off at close or rolling it to the buyer?
- Why hasn't it sold? Are there any deal-killer items the seller is aware of (foundation, flood, title, zoning, code violations)?
- Is there a deadline driving the sale (1031 exchange, divorce, estate, relocation)? That informs how much negotiation room exists.
- What's the average days-on-market for RENTAL listings here right now (not sales)? A rising rental-DOM trend means longer vacancies and softer asking-rent achievability than the comps imply.
- What's the recent tenant-quality profile in this submarket — average credit score on applications, eviction rate, late-payment / NSF rate, and stable-employment percentage? A property-management company in the area should have these aggregated.
- How much new apartment / multifamily construction is in the pipeline within 1–3 miles? Heavy new supply (>2% of stock underway) typically softens rents 12–24 months out; light construction supports rent growth.
Investment metrics
- 1% rule
- 1.23% ✓
- Cap rate
- 7.79%
- Cash-on-cash
- 5.35%
- DSCR
- 1.24
- GRM
- 6.8
CMA / ARV
- ARV (median comp)
- $165,075
- List price
- $165,000
- Delta
- -0.05%
- Verdict
- FAIR
- Comps
- 20 within 1.0 mi
Projected returns pro-forma
-3.0% appreciation · 4.04% rent growth · sell at horizon
- IRR
- -6.5%
- Equity multiple
- 0.76×
- Total profit
- $-11,271
- Equity at exit
- $24,602
- IRR
- 4.7%
- Equity multiple
- 1.36×
- Total profit
- $16,860
- Equity at exit
- $14,266
Cash invested: $46,200 (down + closing). Projections, not guarantees.
Landlord ↔ Tenant lean methodology
- Overall (STATE)
- 73 Landlord-Friendly
- State Wisconsin
- 73 Landlord-Friendly · R+2
- County
- — inherits STATE
- City
- — inherits STATE
ZIP-level market 53719
- Rents YoY
- 4.0%
- Active inventory
- 150
- Price-to-rent
- 6.8×
Monthly cashflow live
- Estimated rent
- $2,031 high interval (Pro) →
- Mortgage (P&I)
- −$865
- Tax from tax record
- −$164 /mo · $1,969/yr
- Insurance
- −$69
- HOA
- −$300
- Vacancy / Maint / Mgmt
- −$426
- Net cashflow
- $206
Break-even live
UW: 25.0% down · 7.5% · 30yr · 1.5% tax · 5.0% vac · 8.0% maint · 8.0% mgmt
Financing live
Cash to close
- Down payment
- $41,250
- Closing costs
- $4,950
- Reserves months
- —
- Total cash needed
- —
Loan-product check · same deal, 3 products live
Conventional
25% down · 7.5% · 30yr
- Down + closing
- —
- Monthly P&I
- —
- Monthly cashflow
- —
- DSCR
- —
- Eligible?
- —
Personal DTI + credit; lowest rate.
DSCR
20% down · 8.5% · 30yr
- Down + closing
- —
- Monthly P&I
- —
- Monthly cashflow
- —
- DSCR
- —
- Eligible?
- —
No personal income docs; deal must DSCR.
Hard money
10% down · 12.0% · 12mo
- Down + closing
- —
- Monthly P&I
- —
- Monthly cashflow
- —
- DSCR
- —
- Eligible?
- —
Short-term bridge; refi at stabilization.
Rent comps 34 comps
| Address | Beds | Baths | Sqft | Rent | $/sqft | DOM | Units | Dist |
|---|---|---|---|---|---|---|---|---|
| 1042 McKenna Blvd Madison, WI | 1.0–3.0 | 1.0–2.0 | 1000 | $1,975 | $1.98 | 14d | 9 | 0.09mi |
| 1132 Morraine View Dr Madison, WI | 3.0 | 1.0 | 1074 | $1,700 | $1.58 | 14d | 4 | 0.09mi |
| 1202 McKenna Blvd Madison, WI | 2.0 | 1.0 | 700 | $1,604 | $2.29 | 14d | 15 | 0.10mi |
| 1118 Gammon Ln Madison, WI | 3.0 | 1.5 | 1200 | $2,350 | $1.96 | 14d | 1 | 0.17mi |
| 13 Westover Ct Madison, WI | 3.0 | 1.5 | 1400 | $2,795 | $2.00 | 14d | 1 | 0.26mi |
| 6723 Schroeder Rd Madison, WI | 1.0–3.0 | 1.0–2.0 | 912 | $1,895 | $2.08 | 14d | 27 | 0.46mi |
| 6763 Hammersley Rd Madison, WI | 3.0 | 2.5 | 1400 | $2,695 | $1.93 | 19d | 1 | 0.46mi |
| 6822 Schroeder Rd Madison, WI | 2.0 | 1.0 | 570 | $1,715 | $3.01 | 14d | 54 | 0.47mi |
| 5 High Point Woods Dr Apt 201 Madison, WI | 2.0 | 2.0 | 996 | $1,400 | $1.41 | 43d | 1 | 0.76mi |
| 2105 Muir Field Rd Madison, WI | 1.0–2.0 | 1.0 | 850 | $1,690 | $1.99 | 14d | 10 | 0.81mi |
| 7602 Mid Town Rd Madison, WI | 2.0 | 2.0 | 1679 | $2,200 | $1.31 | 14d | 8 | 0.82mi |
| 18 N Wickham Ct Unit 1 Madison, WI | 2.0 | 1.0 | 950 | $1,375 | $1.45 | 14d | 1 | 0.88mi |
| 1815 Brittany Pl Madison, WI | 2.0 | 1.0–2.0 | 725 | $1,635 | $2.26 | 14d | 9 | 0.89mi |
| 9 N Wickham Ct Unit 1 Madison, WI | 2.0 | 1.0 | 850 | $1,425 | $1.68 | 43d | 1 | 0.92mi |
| 8002 Starr Grass Dr Madison, WI | 1.0–3.0 | 1.0–2.0 | 1182 | $2,425 | $2.05 | 14d | 49 | 0.93mi |
| 7449 Weekend Way Madison, WI | 3.0 | 1.0–2.0 | 860 | $2,877 | $3.35 | 14d | 39 | 0.94mi |
| 2 S Wickham Ct Unit 4 Madison, WI | 2.0 | 1.0 | 808 | $1,400 | $1.73 | 43d | 1 | 0.95mi |
| 2 S Wickham Ct Unit 2 Madison, WI | 2.0 | 1.0 | 808 | $1,400 | $1.73 | 44d | 1 | 0.95mi |
| 2013 Adderbury Ln Madison, WI | 3.0 | 1.5 | 1400 | $2,795 | $2.00 | 19d | 1 | 1.02mi |
| 1723 Waldorf Blvd Madison, WI | 1.0–2.0 | 1.0–2.0 | 953 | $1,930 | $2.02 | 14d | 18 | 1.12mi |
| 8206 Starr Grass Dr #204 Madison, WI | 2.0 | 2.0 | 1235 | $2,050 | $1.66 | 19d | 1 | 1.14mi |
| 8206 Starr Grass Dr Madison, WI | 1.0–2.0 | 1.0–2.0 | 1017 | $2,050 | $2.01 | 23d | 2 | 1.14mi |
| 1806 Golden Oak Ln Madison, WI | 3.0 | 2.0 | 1319 | $2,100 | $1.59 | 23d | 1 | 1.18mi |
| 512 S Yellowstone Dr Madison, WI | 2.0 | 1.0–2.0 | 803 | $2,100 | $2.62 | 14d | 11 | 1.19mi |
| 477 S High Point Rd Madison, WI | 2.0 | 1.0–2.0 | 1000 | $1,862 | $1.86 | 14d | 21 | 1.21mi |
| 2002 Jeffy Trl Madison, WI | 2.0 | 1.0–2.0 | 823 | $1,845 | $2.24 | 14d | 7 | 1.27mi |
| 8504 Mansion Hill Ave Madison, WI | 2.0 | 1.0–2.0 | 944 | $2,221 | $2.35 | 14d | 21 | 1.29mi |
| 8504 Mansion Hill Ave Madison, WI | 3.0 | 1.0–2.0 | 1058 | $2,837 | $2.68 | 43d | 25 | 1.29mi |
| 78 Kessel Ct Madison, WI | 1.0–3.0 | 1.0–2.0 | 1476 | $2,615 | $1.77 | 14d | 12 | 1.33mi |
| 2837 Cimarron Trl Madison, WI | 3.0 | 1.5 | 1400 | $2,350 | $1.68 | 19d | 1 | 1.33mi |
| 2850 Bedrock Ln Madison, WI | 3.0 | 1.0–2.5 | 1052 | $2,990 | $2.84 | 14d | 16 | 1.37mi |
| 6503 Grand Teton Plz Madison, WI | 1.0–2.0 | 1.0–2.0 | 899 | $2,290 | $2.55 | 21d | 33 | 1.38mi |
| 238 Randolph Dr Madison, WI | 2.0 | 1.0–2.0 | 840 | $1,895 | $2.26 | 43d | 1 | 1.48mi |
| 5806 Raymond Rd Madison, WI | 2.0 | 1.0–2.0 | 1059 | $1,484 | $1.40 | 14d | 15 | 1.48mi |
HOA detail condo
- Monthly dues
- $300 · $3,600/yr
- Likely covers
- gymparking
- Assessments
- None detected in remarks — confirm with the listing agent.
Listing history 21 events
-
2026-06-18days on market $165,000 Active 90 DOM
-
2026-06-17days on market $165,000 Active 89 DOM
-
2026-06-16days on market $165,000 Active 88 DOM
-
2026-06-15days on market $165,000 Active 87 DOM
-
2026-06-14days on market $165,000 Active 85 DOM
-
2026-06-13days on market $165,000 Active 84 DOM
-
2026-06-10days on market $165,000 Active 82 DOM
-
2026-06-09days on market $165,000 Active 81 DOM
-
2026-06-08days on market $165,000 Active 80 DOM
-
2026-06-07days on market $165,000 Active 79 DOM
-
2026-06-05days on market $165,000 Active 76 DOM
-
2026-06-03days on market $165,000 Active 75 DOM
-
2026-06-02days on market $165,000 Active 74 DOM
-
2026-06-01days on market $165,000 Active 73 DOM
-
2026-05-31days on market $165,000 Active 72 DOM
-
2026-05-31days on market $165,000 Active 71 DOM
-
2026-03-20$165,000 Active 241-char remark
Show marketing remark (241 chars)
Convenient first-floor unit with underground parking included. Enjoy access to a beautifully renovated clubhouse, updated hallways, and a modern fitness center. Great location?close to Elver Park, West Towne Mall, and various grocery stores.
-
2016-08-02soldstatus $76,500
-
2010-08-26soldstatus $69,200
-
2010-07-26soldstatus $41,932
-
2007-06-12soldstatus $99,500
ⓘ Source: listings_history table (triggers on properties + properties_extension) + one-shot
backfill from property_details.listing_events for pre-trigger history.
Tax reassessment forecast WI · Partial reset (capped growth)
- Current annual tax
- $1,969 · $164/mo
- Projected year-2 tax
- $2,511 · $209/mo
- Expected delta
- +$542/yr (+$45/mo · 27.5%)
ⓘ Screening estimate from a state-policy table — verify with the county assessor before closing.
Climate risk First Street
- Flood 1/10 Low FEMA zone X (unshaded) · 0% chance over 30 yrs
- Wildfire 1/10 Low
- Heat 2/10 Low 7 d/yr ≥98°F today · 14 d/yr by 30 yrs out
- Wind 2/10 Low
- Air quality 2/10 Low 1 unhealthy d/yr today · 1 by 30 yrs out
Nearby sold comps map
Loading sold comps map…
Walkable amenities ~0.75 mi
Loading nearby amenities…
Taxation est. · year 1
- Rental income
- $24,369
- − Mortgage interest
- −$9,243
- − Property taxes
- −$1,969
- − Insurance
- −$825
- − Repairs & maintenance
- −$1,950
- − Management
- −$1,950
- − HOA
- −$3,600
- − Depreciation
- −$4,800
- Taxable income
- $33
- Est. tax owed @ 24.0%
- −$8
- After-tax cash flow
- $2,466/yr
For passive investors: Depreciation is non-cash, so a rental often shows a tax loss while cash-flowing — sheltering income. Rental losses are passive: they offset passive income freely, and up to $25,000/yr can offset ordinary (W-2) income if you actively participate and your MAGI is under $100k (phasing out to $0 by $150k); unused losses carry forward. On sale, claimed depreciation is recaptured at up to 25%, and gains may owe capital-gains tax (a 1031 exchange can defer both). Figures are a year-1 estimate at your 24.0% rate — not tax advice; consult a CPA.
Schools (NCES district)
- District
- Middleton-Cross Plains Area School District
- NCES district ID
- 5509510
- Math proficiency
- 52% ▼ -12.00%
- Reading proficiency
- 56% ▼ -4.00%
- Median HH income
- $75,614
- Composite
- 48.54/100
- National rank
- #2116
- State rank
- #36 of 342 in WI
Livability — Madison
- Score
- 84/100
- State rank
- #39
- US rank
- #819
Category grades
Schools grade is shown separately in the Schools card above.
Census & demographics
- Census place
- Madison, WI
- County
- Dane County · 506,461 people
- City population
- 301,931
- Metro
- Madison, WI
- Population (ZIP)
- 34,115
- Household income
- $92,052
- Rent vs Own
- Severe rent burden
- 1237.0
Population outlook (Dane County) Hauer SSP2
- Today (2025)
- 610,707 people
- By 2030
- 654,875 · +7.2%
- By 2040
- 740,480 · +21.2%
- By 2050
- 826,188 · +35.3%
- By 2075
- 1,040,574 · +70.4%
- By 2100
- 1,168,084 · +91.3%
Race, ethnicity, and origin ACS 2023
- Neighborhood character
- Predominantly White (67%)
- Race & ethnicity
- White 67% Hispanic / Latino 12% Two or more races 10% Asian 9% Black 6%
- Hispanic origin (detail)
- Mexican 7%
- Common ancestry
- Portuguese 7% Romanian 5% Italian 3%
- Foreign-born
- 13% · Canada, China, Jamaica
- Languages at home
- 83% English-only · Spanish 7% Other Indo-European 3% Chinese 2%
Political lean MEDSL · Dane
- 2024 margin
- Solid D (+51.7) · D 75.1% · R 23.4% · Other 1.5%
- 2008→2024 swing
- +4.7pp toward D · 2008: 47.0pp · 2024: 51.7pp
- All cycles
- 2024: D+51.7 2020: D+52.6 2016: D+48.0 2012: D+43.6 2008: D+47.0
Not yet ingested
- Civics
- —
Market trends
- HPI YoY
- ▼ -186.97%
- Current HPI
- 265.9371
- Rent YoY
- ▲ 4.04%
- Metro
- Madison, WI
- State GDP YoY
- ▲ 2.10%
- F500 in state
- 20
Industry mix (Fortune 500 HQ in WI)
| Industry | F500 HQs | Revenue |
|---|---|---|
| Industrial Machinery | 4 | $23B |
|
||
| Industrial Technology | 2 | $36B |
|
||
| Insurance | 1 | $36B |
|
||
| Professional Services | 1 | $19B |
|
||
| Utilities | 1 | $9B |
|
||
| Consumer Goods | 1 | $3B |
|
||
Price history
+65.8% since first listed5 events — show timeline
- 2026-03-20 Listed $165,000 SCWMLS
- 2016-08-02 Sold (Public Records) $76,500 Public Records
- 2010-08-26 Sold (Public Records) $69,200 Public Records
- 2010-07-26 Sold (Public Records) $41,932 Public Records
- 2007-06-12 Sold (Public Records) $99,500 Public Records
Property tax history
+1.1%/yrLatest (2025): $1,969 · +9.3% YoY. Source: county tax records.
Cash-flow waterfall
monthlySold comps — $/sqft
last 12 mo · ≤1 miLoading sold comps…