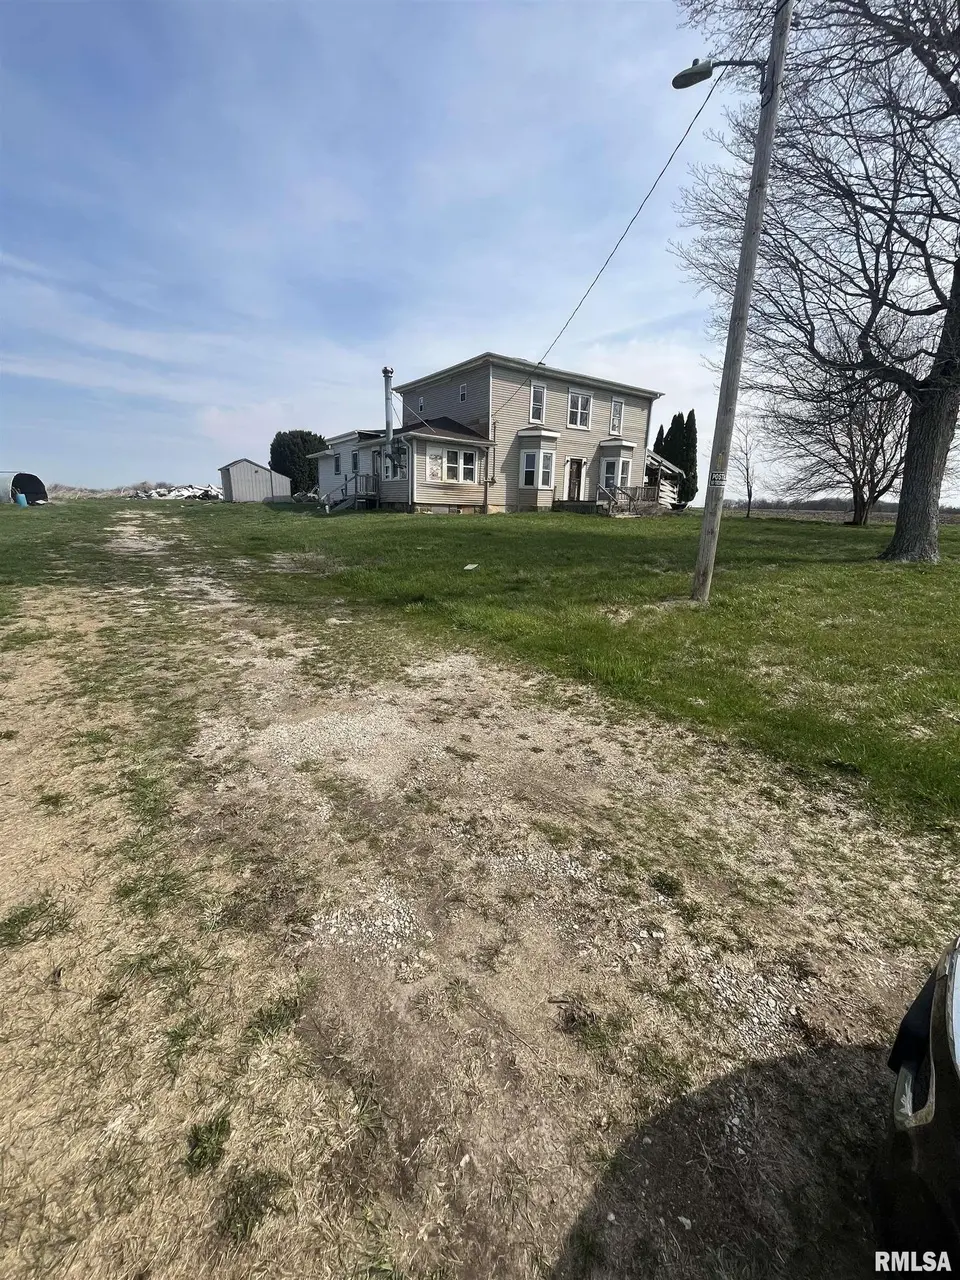
423 Knox Rd 2350 Rd N · Henderson, IL
Flood risk 1/10 · Minimal
- FEMA flood zone
- X (unshaded)
- Chance of flooding over 30 yrs
- 0.0%
- Est. flood insurance / yr
- $473 – $860
Fire risk 1/10 · Minimal
- Est. fire insurance / yr
- $804 – $1,492
Heat risk 2/10 · Minimal
- Hot days now (above 103°F)
- 7 days/yr
- Hot days in 30 yrs
- 17 days/yr
Wind risk 2/10 · Minimal
- Chance of severe wind over 30 yrs
- 1.0%
Air-quality risk 3/10 · Minor
- Unhealthy air days now
- 2 days/yr
- Unhealthy air days in 30 yrs
- 3 days/yr
Risk factors via First Street. Map © Google.
Why this score? — see what drove the B grade
The composite is a weighted blend of 9 inputs, each scored 0–100. Each bar is that input's sub-score; the figure is the points it added to the 100-point composite (weight × sub-score).
- Cash flow +30.0/30.0
- 1% rule +10.0/10.0
- DSCR +10.0/10.0
- ARV discount +7.5/15.0
- Appreciation +5.0/10.0
- Livability +2.9/5.0
- Rent growth +2.5/5.0
- Condition / age +2.5/5.0
- Schools +1.4/10.0
$50,000
🖨 Deal sheet (PDF) 📄 Offer letter ✓ Due diligence
Listing remarks MLS
Home is being sold completely AS-IS. Cash Only A lot of potential for the right buyer. 1 acre lot rural setting. Large home, lots of square footage for the price. 4 bedroom potential 6 bedroom and 3 bathrooms.
Key facts
- 1.03 acre lot
- Parking
- Built 1900
Neighborhood map
What this means for you Summary
Snapshot
- This is a 4-bed/3.0-bath other listed at $50k.
Deal economics
- At list price, monthly cash flow is $551 ($7k/yr) — positive.
- The deal already cash-flows at list — no discount required.
- Meets the 1% rule at list price ($1k rent vs $50k).
- Recommended offer: $47k (6.0% below list) — sets the bar for market timing.
Location & tenants
- Location reads 58/100 on livability (#1,086 in IL) — a working-class tenant base; expect higher turnover. Strengths: cost of living A+, housing A+; Watch: employment D+, crime D-, amenities F.
- Galesburg CUSD 205 (town): math 13% / reading 22% proficiency, ranked #488 of 620 in IL (top 79%) — low school quality limits family demand, transient renter base, plan for 1-2y turnover.
- Zoned schools: Galesburg Jr High School (math 13% / reading 27%); Galesburg Senior High School (math 19% / reading 24%, grade F, #345 of 693 statewide, top 50%, 1,762 students, 0% FRL) — zoned schools average 0% FRL vs 60% district-wide (60 pts lower); this property's tenant base skews higher-income than the district average.
- Market conditions: 1 active listings in the ZIP.
Forward outlook
- In year one you build about $2k of equity ($346 loan paydown + $2k appreciation (3.0% local appreciation)).
- Knox County population projected at -19% by 2050 — secular population decline; favor cash flow + early exit over multi-decade hold.
- At projected returns (3.0% appreciation + 3.0% rent growth), your $14k cash investment doubles in ~2 years — after that, you're playing with house money.
Negotiation context
- It's been on market 71 days — a 6% lower offer ($47k) is reasonable based on typical stale-listing flexibility.
Risks & watch-outs
- Watch-outs: property tax is 4.4% of price; built in 1900 — expect roof / HVAC / electrical / plumbing capex.
Questions for the listing agent
- It's been on market 71 days. Have you received any prior offers? Is the seller open to a 6% concession, seller financing, or rate buy-down credit?
- Built in 1900 — when were the roof, HVAC, electrical panel, plumbing, and water heater last replaced?
- Property tax is high relative to price — has the assessment been appealed recently, and will the sale trigger a re-assessment?
- Why hasn't it sold? Are there any deal-killer items the seller is aware of (foundation, flood, title, zoning, code violations)?
- Is there a deadline driving the sale (1031 exchange, divorce, estate, relocation)? That informs how much negotiation room exists.
- Schools are F-rated, which usually means shorter tenancies and higher turnover. Who's the typical renter profile here, and what's been the actual vacancy rate?
- Crime grade is D in this area — have there been break-ins, vandalism, or insurance claims at this property in the last 3 years? What carrier currently insures it and at what premium?
- What's the average days-on-market for RENTAL listings here right now (not sales)? A rising rental-DOM trend means longer vacancies and softer asking-rent achievability than the comps imply.
- What's the recent tenant-quality profile in this submarket — average credit score on applications, eviction rate, late-payment / NSF rate, and stable-employment percentage? A property-management company in the area should have these aggregated.
- How much new for-sale + rental construction is in the pipeline within 1–3 miles? Heavy new supply typically softens prices + rents 12–24 months out; constrained supply supports both.
Investment metrics
- 1% rule
- 2.57% ✓
- Cap rate
- 19.51%
- Cash-on-cash
- 47.22%
- DSCR
- 3.10
- GRM
- 3.2
CMA / ARV
- ARV (median comp)
- $458,861
- List price
- $50,000
- Delta
- -89.10%
- Verdict
- UNDERPRICED
- Comps
- 2 within 2.0 mi
Projected returns pro-forma
3.0% appreciation · 3.0% rent growth · sell at horizon
- IRR
- 52.5%
- Equity multiple
- 3.94×
- Total profit
- $41,204
- Equity at exit
- $22,482
- IRR
- 52.2%
- Equity multiple
- 7.97×
- Total profit
- $97,644
- Equity at exit
- $34,648
Cash invested: $14,000 (down + closing). Projections, not guarantees.
Landlord ↔ Tenant lean methodology
- Overall (STATE)
- 43 Moderately Tenant-Leaning
- State Illinois
- 43 Moderately Tenant-Leaning · D+7
- County
- — inherits STATE
- City
- — inherits STATE
ZIP-level market 61472-9676
- Active inventory
- 1
- Price-to-rent
- 3.2×
Monthly cashflow live
- Estimated rent
- $1,287 medium interval (Pro) →
- Mortgage (P&I)
- −$262
- Tax from tax record
- −$183 /mo · $2,191/yr
- Insurance
- −$21
- HOA
- −$0
- Vacancy / Maint / Mgmt
- −$270
- Net cashflow
- $551
Break-even live
Sensitivity live
| Price | -10% $579 | -5% $565 | +0% $551 | +5% $537 | +10% $523 |
|---|---|---|---|---|---|
| Rent | -10% $449 | -5% $500 | +0% $551 | +5% $602 | +10% $653 |
| Rate | -1.0pp $576 | -0.5pp $564 | base $551 | +0.5pp $538 | +1.0pp $525 |
UW: 25.0% down · 7.5% · 30yr · 1.5% tax · 5.0% vac · 8.0% maint · 8.0% mgmt
Financing live
Cash to close
- Down payment
- $12,500
- Closing costs
- $1,500
- Reserves months
- —
- Total cash needed
- —
Loan-product check · same deal, 3 products live
Conventional
25% down · 7.5% · 30yr
- Down + closing
- —
- Monthly P&I
- —
- Monthly cashflow
- —
- DSCR
- —
- Eligible?
- —
Personal DTI + credit; lowest rate.
DSCR
20% down · 8.5% · 30yr
- Down + closing
- —
- Monthly P&I
- —
- Monthly cashflow
- —
- DSCR
- —
- Eligible?
- —
No personal income docs; deal must DSCR.
Hard money
10% down · 12.0% · 12mo
- Down + closing
- —
- Monthly P&I
- —
- Monthly cashflow
- —
- DSCR
- —
- Eligible?
- —
Short-term bridge; refi at stabilization.
Listing history 18 events
-
2026-06-21days on market $50,000 Active 71 DOM
-
2026-06-21days on market $50,000 Active 70 DOM
-
2026-06-18days on market $50,000 Active 68 DOM
-
2026-06-17days on market $50,000 Active 67 DOM
-
2026-06-16days on market $50,000 Active 66 DOM
-
2026-06-15days on market $50,000 Active 65 DOM
-
2026-06-13days on market $50,000 Active 63 DOM
-
2026-06-12days on market $50,000 Active 62 DOM
-
2026-06-09days on market $50,000 Active 59 DOM
-
2026-06-08days on market $50,000 Active 58 DOM
-
2026-06-07days on market $50,000 Active 57 DOM
-
2026-06-07days on market $50,000 Active 56 DOM
-
2026-06-04days on market $50,000 Active 53 DOM
-
2026-06-02days on market $50,000 Active 52 DOM
-
2026-06-01days on market $50,000 Active 51 DOM
-
2026-05-31days on market $50,000 Active 50 DOM
-
2026-05-31days on market $50,000 Active 49 DOM
-
2026-04-09$50,000 Active 211-char remark
Show marketing remark (211 chars)
Home is being sold completely AS-IS. Cash Only A lot of potential for the right buyer. 1 acre lot rural setting. Large home, lots of square footage for the price. 4 bedroom potential 6 bedroom and 3 bathrooms.
ⓘ Source: listings_history table (triggers on properties + properties_extension) + one-shot
backfill from property_details.listing_events for pre-trigger history.
Tax reassessment forecast IL · Partial reset (capped growth)
- Current annual tax
- $2,191 · $183/mo
- Projected year-2 tax
- $2,191 · $183/mo
- Expected delta
- $0/yr ($0/mo · 0.0%)
ⓘ Screening estimate from a state-policy table — verify with the county assessor before closing.
Climate risk First Street
- Flood 1/10 Low FEMA zone X (unshaded) · 0% chance over 30 yrs
- Wildfire 1/10 Low
- Heat 2/10 Low 7 d/yr ≥103°F today · 17 d/yr by 30 yrs out
- Wind 2/10 Low 100% chance of damaging wind over 30 yrs
- Air quality 3/10 Moderate 2 unhealthy d/yr today · 3 by 30 yrs out
Nearby sold comps map
Loading sold comps map…
Walkable amenities ~0.75 mi
Loading nearby amenities…
Taxation est. · year 1
- Rental income
- $15,441
- − Mortgage interest
- −$2,801
- − Property taxes
- −$2,191
- − Insurance
- −$250
- − Repairs & maintenance
- −$1,235
- − Management
- −$1,235
- − Depreciation
- −$1,455
- Taxable income
- $6,274
- Est. tax owed @ 24.0%
- −$1,506
- After-tax cash flow
- $5,105/yr
For passive investors: Depreciation is non-cash, so a rental often shows a tax loss while cash-flowing — sheltering income. Rental losses are passive: they offset passive income freely, and up to $25,000/yr can offset ordinary (W-2) income if you actively participate and your MAGI is under $100k (phasing out to $0 by $150k); unused losses carry forward. On sale, claimed depreciation is recaptured at up to 25%, and gains may owe capital-gains tax (a 1031 exchange can defer both). Figures are a year-1 estimate at your 24.0% rate — not tax advice; consult a CPA.
Schools (NCES district)
- District
- Galesburg CUSD 205
- NCES district ID
- 1716080
- Math proficiency
- 13% ▼ -8.00%
- Reading proficiency
- 22% ▼ -11.00%
- Median HH income
- $35,901
- Composite
- 14.46/100
- National rank
- #9427
- State rank
- #488 of 620 in IL
Livability — Henderson
- Score
- 58/100
- State rank
- #1086
- US rank
- #20663
Category grades
Schools grade is shown separately in the Schools card above.
Census & demographics
No demographic data for this ZIP.
Market trends
- HPI YoY
- —
- Current HPI
- —
- Rent YoY
- —
- Metro
- —
- State GDP YoY
- ▲ 1.59%
- F500 in state
- 60
Industry mix (Fortune 500 HQ in IL)
| Industry | F500 HQs | Revenue |
|---|---|---|
| Insurance | 4 | $201B |
|
||
| Consumer Goods | 4 | $87B |
|
||
| Industrial Machinery | 3 | $64B |
|
||
| Healthcare | 2 | $55B |
|
||
| Retail / Pharmacy | 1 | $148B |
|
||
| Agriculture / Food | 1 | $86B |
|
||
Price history
1 event — show timeline
- 2026-04-09 Listed $50,000 RMLSA as Distributed by MLS Grid
Property tax history
+3.0%/yrLatest (2024): $2,191 · +3.4% YoY. Source: county tax records.
Cash-flow waterfall
monthlySold comps — $/sqft
last 12 mo · ≤1 miLoading sold comps…