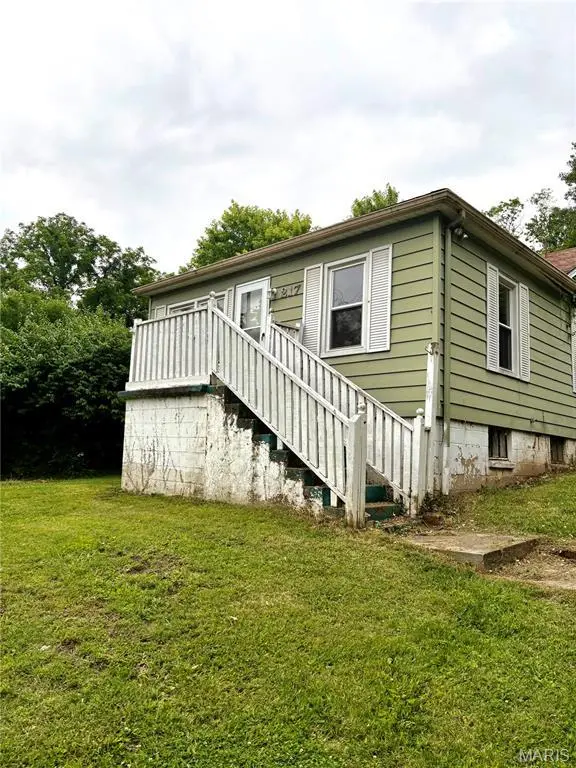
217 Center Dr · Caseyville, IL
Flood risk 1/10 · Minimal
- FEMA flood zone
- X
- Chance of flooding over 30 yrs
- 0.0%
- Est. flood insurance / yr
- $507 – $1,088
Fire risk 2/10 · Minimal
- Est. fire insurance / yr
- $804 – $1,492
Heat risk 5/10 · Moderate
- Hot days now (above 107°F)
- 7 days/yr
- Hot days in 30 yrs
- 21 days/yr
Wind risk 2/10 · Minimal
- Chance of severe wind over 30 yrs
- 1.0%
Air-quality risk 3/10 · Minor
- Unhealthy air days now
- 2 days/yr
- Unhealthy air days in 30 yrs
- 4 days/yr
Risk factors via First Street. Map © Google.
Why this score? — see what drove the B+ grade
The composite is a weighted blend of 9 inputs, each scored 0–100. Each bar is that input's sub-score; the figure is the points it added to the 100-point composite (weight × sub-score).
- Cash flow +30.0/30.0
- ARV discount +15.0/15.0
- 1% rule +10.0/10.0
- DSCR +10.0/10.0
- Livability +3.7/5.0
- Rent growth +2.5/5.0
- Condition / age +2.5/5.0
- Schools +1.6/10.0
- Appreciation +0.0/10.0
$80,000
🖨 Deal sheet 📄 Offer letter ✓ Due diligence
Listing remarks
Charming opportunity in the heart of Caseyville! This 2 bedroom, 1 bath home with an additional office offers a great floor plan full of potential. With a little love and care, this property could truly shine again. Features include a full unfinished basement with walk-up access, providing plenty of storage or future possibilities. Step outside to enjoy the level backyard, perfect for entertaining, gatherings, or relaxing evenings. Conveniently located close to highways, shopping, dining, and everyday amenities for an easy commute and lifestyle. Great opportunity for investors, buyers with a creative spirit, or anyone looking to add their personal touch!
Key facts
- Level backyard
- Close to dining
- Close to amenities
Tags
Property features AI
Finance
- Financial info: Lease not considered
- HOA & community: No association amenities
Exterior
- Parking: Off-street parking on-site; Gravel parking; No garage
- Utilities: Public water; Public sewer; 220-volt electric service (Ameren); Natural gas connected; Electricity, water and sewer connected; Cable and phone available
- Home design: Single-family house; One story; Private ownership; Property listed in fixer condition
- Construction: Steel siding; Architectural shingle roof; Block foundation; Full, unfinished basement with exterior entry and walk-up access
- Exterior features: Covered rear porch; Shed(s); Back yard adjoining wooded area with many trees; Wooded lot
Interior
- Kitchen: Kitchen on the main level
- Bedrooms: Two bedrooms on the main level
- Flooring: Carpet; Linoleum
- Bathrooms: One full bathroom on the main level
- Heating & cooling: Forced-air heating (natural gas); Central air conditioning; Ceiling fans for additional cooling
- Interior features: Ceiling fans; Laminate counters; Double-pane windows; Tilt-in windows; Exhaust fan; Gas water heater
- Laundry & utility: In-unit laundry with washer hookup; Electric and gas dryer hook-ups; Laundry area in basement
Neighborhood map
What this means for you Summary
Snapshot
- This is a 2-bed/2.0-bath single-family listed at $80k.
Deal economics
- At list price, monthly cash flow is $564 ($7k/yr) — positive.
- The deal already cash-flows at list — no discount required.
- Meets the 1% rule at list price ($2k rent vs $80k).
- Recommended offer: $79k (1.5% below list) — sets the bar for market timing.
- Cap rate 14.7% vs local median 3.3% in Caseyville — top-decile yield for the area; either an underpriced asset or a hidden risk that comps aren't pricing in. Stress-test before assuming the spread holds.
Location & tenants
- Location reads 74/100 on livability (#241 in IL, #4,389 nationally) — a middle-class / working-renter tenant base. Strengths: commute A+, cost of living A+, housing A+; Watch: health & safety C-, amenities F.
- Collinsville CUSD 10 (suburban): math 14% / reading 20% proficiency, ranked #465 of 620 in IL (top 75%) — low school quality limits family demand, transient renter base, plan for 1-2y turnover.
- Zoned schools: Collinsville High School (math 16% / reading 21%, grade F, #427 of 693 statewide, top 62%, 1,978 students, 0% FRL) — zoned schools average 0% FRL vs 52% district-wide (52 pts lower); this property's tenant base skews higher-income than the district average.
- Market conditions: 50 active listings in the ZIP; 783 units permitted in St. Clair County in 2024 (378 in 5+ unit buildings).
Forward outlook
- Local home prices are declining (-3.0%/yr); year-one equity from $553 of loan paydown is wiped out by about $2k of value loss. Plan a longer hold.
- St. Clair County population projected at -23% by 2050 — secular population decline; favor cash flow + early exit over multi-decade hold.
- At projected returns (-3.0% appreciation + 3.0% rent growth), your $22k cash investment doubles in ~4 years — after that, you're playing with house money.
Negotiation context
- It's been on market 27 days — a 2% lower offer ($79k) is reasonable based on typical stale-listing flexibility.
- Current owner paid $41k; list at $80k implies a 95% gain — meaningful room to come down on a strong offer.
Risks & watch-outs
- Watch-outs: property tax is 2.6% of price; built in 1920 — expect roof / HVAC / electrical / plumbing capex.
- Climate carrying-cost: extreme-heat days projected 7→21/yr by 2055 (HVAC capex compounding) — expect insurance premiums to compound above CPI over the hold.
Questions for the listing agent
- Built in 1920 — when were the roof, HVAC, electrical panel, plumbing, and water heater last replaced?
- Property tax is high relative to price — has the assessment been appealed recently, and will the sale trigger a re-assessment?
- Is there a deadline driving the sale (1031 exchange, divorce, estate, relocation)? That informs how much negotiation room exists.
- Schools are F-rated, which usually means shorter tenancies and higher turnover. Who's the typical renter profile here, and what's been the actual vacancy rate?
- What's the average days-on-market for RENTAL listings here right now (not sales)? A rising rental-DOM trend means longer vacancies and softer asking-rent achievability than the comps imply.
- What's the recent tenant-quality profile in this submarket — average credit score on applications, eviction rate, late-payment / NSF rate, and stable-employment percentage? A property-management company in the area should have these aggregated.
- How much new for-sale + rental construction is in the pipeline within 1–3 miles? Heavy new supply typically softens prices + rents 12–24 months out; constrained supply supports both.
Investment metrics
- 1% rule
- 1.88% ✓
- Cap rate
- 14.75%
- Cash-on-cash
- 30.20%
- DSCR
- 2.34
- GRM
- 4.4
CMA / ARV
- ARV (on-the-fly)
- $116,160
- Comps found
- 6
Show comp detail 6 sales within ~0.75 mi
| Address | Dist | Beds/Ba | Sqft | Sold | Price | $/sf | Match |
|---|---|---|---|---|---|---|---|
| 347 Brookside Dr | 0.22mi | 2/1.0 | 748 (-15%) | 6mo | $99,000 | $132 | 56 |
| 105 Brookside Dr | 0.41mi | 2/1.0 | 954 (+8%) | 14mo | $65,000 | $68 | 51 |
| 251 Center Dr | 0.12mi | 3/1.0 (+1) | 1,008 (+14%) | 15mo | $130,000 | $129 | 49 |
| 643 Hill Rd | 0.46mi | 2/1.0 | 960 (+9%) | 23mo | $45,000 | $47 | 40 |
| 400 S 2nd St | 0.65mi | 2/1.0 | 780 (-11%) | 17mo | $129,900 | $167 | 32 |
| 509 N Long St | 0.64mi | 2/1.0 | 784 (-11%) | 21mo | $188,000 | $240 | 31 |
Match score weights: distance 35% · size 25% · config 20% · recency 20%. Top-matched comps best support the ARV.
Projected returns pro-forma
-3.0% appreciation · 3.0% rent growth · sell at horizon
- IRR
- 24.9%
- Equity multiple
- 2.03×
- Total profit
- $23,007
- Equity at exit
- $11,928
- IRR
- 32.7%
- Equity multiple
- 3.97×
- Total profit
- $66,539
- Equity at exit
- $6,917
Cash invested: $22,400 (down + closing). Projections, not guarantees.
Landlord ↔ Tenant lean methodology
- Overall (STATE)
- 43 Moderately Tenant-Leaning
- State Illinois
- 43 Moderately Tenant-Leaning · D+7
- County
- — inherits STATE
- City
- — inherits STATE
ZIP-level market 62232
- Active inventory
- 50
- Price-to-rent
- 4.4×
Monthly cashflow live
- Estimated rent
- $1,506 medium interval (Pro) →
- Mortgage (P&I)
- −$420
- Tax from tax record
- −$173 /mo · $2,076/yr
- Insurance
- −$33
- HOA
- −$0
- Vacancy / Maint / Mgmt
- −$316
- Net cashflow
- $564
Break-even live
UW: 25.0% down · 7.5% · 30yr · 1.5% tax · 5.0% vac · 8.0% maint · 8.0% mgmt
Financing live
Cash to close
- Down payment
- $20,000
- Closing costs
- $2,400
- Reserves months
- —
- Total cash needed
- —
Loan-product check · same deal, 3 products live
Conventional
25% down · 7.5% · 30yr
- Down + closing
- —
- Monthly P&I
- —
- Monthly cashflow
- —
- DSCR
- —
- Eligible?
- —
Personal DTI + credit; lowest rate.
DSCR
20% down · 8.5% · 30yr
- Down + closing
- —
- Monthly P&I
- —
- Monthly cashflow
- —
- DSCR
- —
- Eligible?
- —
No personal income docs; deal must DSCR.
Hard money
10% down · 12.0% · 12mo
- Down + closing
- —
- Monthly P&I
- —
- Monthly cashflow
- —
- DSCR
- —
- Eligible?
- —
Short-term bridge; refi at stabilization.
Listing history 17 events
-
2026-06-18days on market $80,000 Active 27 DOM
-
2026-06-17days on market $80,000 Active 26 DOM
-
2026-06-16days on market $80,000 Active 25 DOM
-
2026-06-15days on market $80,000 Active 24 DOM
-
2026-06-13days on market $80,000 Active 22 DOM
-
2026-06-13days on market $80,000 Active 21 DOM
-
2026-06-09days on market $80,000 Active 18 DOM
-
2026-06-08days on market $80,000 Active 17 DOM
-
2026-06-07days on market $80,000 Active 16 DOM
-
2026-06-05days on market $80,000 Active 13 DOM
-
2026-06-03days on market $80,000 Active 12 DOM
-
2026-06-02days on market $80,000 Active 11 DOM
-
2026-06-01days on market $80,000 Active 10 DOM
-
2026-05-31days on market $80,000 Active 9 DOM
-
2026-05-22$80,000 Active
-
2009-11-29historical
-
1989-11-01soldstatus $41,000
ⓘ Source: listings_history table (triggers on properties + properties_extension) + one-shot
backfill from property_details.listing_events for pre-trigger history.
Tax reassessment forecast IL · Partial reset (capped growth)
- Current annual tax
- $2,076 · $173/mo
- Projected year-2 tax
- $2,076 · $173/mo
- Expected delta
- $0/yr ($0/mo · 0.0%)
ⓘ Screening estimate from a state-policy table — verify with the county assessor before closing.
Climate risk First Street
- Flood 1/10 Low FEMA zone X · 0% chance over 30 yrs
- Wildfire 2/10 Low
- Heat 5/10 Major 7 d/yr ≥107°F today · 21 d/yr by 30 yrs out
- Wind 2/10 Low 100% chance of damaging wind over 30 yrs
- Air quality 3/10 Moderate 2 unhealthy d/yr today · 4 by 30 yrs out
Nearby sold comps map
Loading sold comps map…
Walkable amenities ~0.75 mi
Loading nearby amenities…
Taxation est. · year 1
- Rental income
- $18,070
- − Mortgage interest
- −$4,481
- − Property taxes
- −$2,076
- − Insurance
- −$400
- − Repairs & maintenance
- −$1,446
- − Management
- −$1,446
- − Depreciation
- −$2,327
- Taxable income
- $5,894
- Est. tax owed @ 24.0%
- −$1,415
- After-tax cash flow
- $5,350/yr
For passive investors: Depreciation is non-cash, so a rental often shows a tax loss while cash-flowing — sheltering income. Rental losses are passive: they offset passive income freely, and up to $25,000/yr can offset ordinary (W-2) income if you actively participate and your MAGI is under $100k (phasing out to $0 by $150k); unused losses carry forward. On sale, claimed depreciation is recaptured at up to 25%, and gains may owe capital-gains tax (a 1031 exchange can defer both). Figures are a year-1 estimate at your 24.0% rate — not tax advice; consult a CPA.
Schools (NCES district)
- District
- Collinsville CUSD 10
- NCES district ID
- 1710650
- Math proficiency
- 14% ▼ -9.00%
- Reading proficiency
- 20% ▼ -7.00%
- Median HH income
- $52,504
- Composite
- 15.65/100
- National rank
- #9288
- State rank
- #465 of 620 in IL
Livability — Caseyville
- Score
- 74/100
- State rank
- #241
- US rank
- #4389
Category grades
Schools grade is shown separately in the Schools card above.
Census & demographics
- Census place
- Caseyville, IL
- City population
- 7,480
- Population (ZIP)
- 7,480
Population outlook (St. Clair County) Hauer SSP2
- Today (2025)
- 250,366 people
- By 2030
- 240,511 · -3.9%
- By 2040
- 217,391 · -13.2%
- By 2050
- 192,699 · -23.0%
- By 2075
- 140,637 · -43.8%
- By 2100
- 100,499 · -59.9%
Race, ethnicity, and origin ACS 2023
- Neighborhood character
- Predominantly White (66%)
- Race & ethnicity
- White 66% Hispanic / Latino 18% Black 9% Two or more races 9%
- Hispanic origin (detail)
- Mexican 14% Puerto Rican 2%
- Common ancestry
- Lithuanian 4% Romanian 3% Portuguese 3%
- Foreign-born
- 4% · Canada
- Languages at home
- 89% English-only · Spanish 10%
Political lean MEDSL · St. Clair
- 2024 margin
- Lean D (+7.9) · D 53.0% · R 45.1% · Other 1.8%
- 2008→2024 swing
- -14.6pp toward R · 2008: 22.4pp · 2024: 7.9pp
- All cycles
- 2024: D+7.9 2020: D+8.7 2016: D+5.6 2012: D+14.5 2008: D+22.4
Not yet ingested
- Civics
- —
Market trends
- HPI YoY
- ▼ -83.21%
- Current HPI
- 124.0291
- Rent YoY
- —
- Metro
- —
- State GDP YoY
- ▲ 1.59%
- F500 in state
- 60
Industry mix (Fortune 500 HQ in IL)
| Industry | F500 HQs | Revenue |
|---|---|---|
| Insurance | 4 | $201B |
|
||
| Consumer Goods | 4 | $87B |
|
||
| Industrial Machinery | 3 | $64B |
|
||
| Healthcare | 2 | $55B |
|
||
| Retail / Pharmacy | 1 | $148B |
|
||
| Agriculture / Food | 1 | $86B |
|
||
Price history
+95.1% since first listed3 events — show timeline
- 2026-05-22 Listed $80,000 MARIS as Distributed by MLS Grid
- 2009-11-29 Listing Removed — MRED as Distributed by MLS Grid
- 1989-11-01 Sold (Public Records) $41,000 Public Records
Property tax history
+6.0%/yrLatest (2024): $2,076 · +8.4% YoY. Source: county tax records.
Cash-flow waterfall
monthlySold comps — $/sqft
last 12 mo · ≤1 miLoading sold comps…