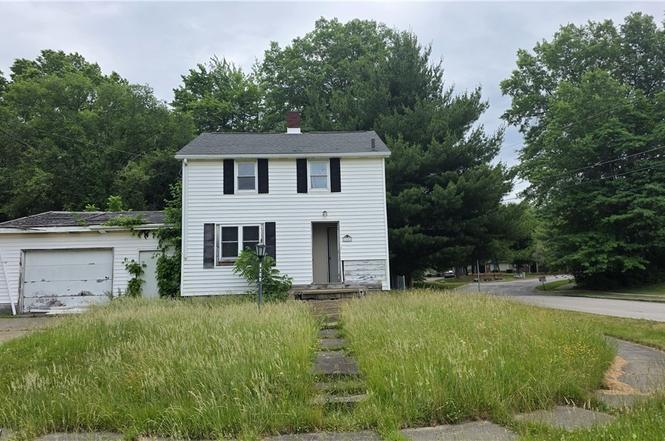
2143 Central Parkway Ave SE · Warren, OH
Flood risk 1/10 · Minimal
- FEMA flood zone
- X (unshaded)
- Chance of flooding over 30 yrs
- 0.0%
- Est. flood insurance / yr
- $473 – $860
Fire risk 1/10 · Minimal
- Est. fire insurance / yr
- $713 – $1,323
Heat risk 3/10 · Minor
- Hot days now (above 98°F)
- 7 days/yr
- Hot days in 30 yrs
- 17 days/yr
Wind risk 1/10 · Minimal
- Chance of severe wind over 30 yrs
- —
Air-quality risk 3/10 · Minor
- Unhealthy air days now
- 1 days/yr
- Unhealthy air days in 30 yrs
- 4 days/yr
Risk factors via First Street. Map © Google.
Why this score? — see what drove the B- grade
The composite is a weighted blend of 9 inputs, each scored 0–100. Each bar is that input's sub-score; the figure is the points it added to the 100-point composite (weight × sub-score).
- Cash flow +30.0/30.0
- 1% rule +10.0/10.0
- DSCR +10.0/10.0
- ARV discount +7.5/15.0
- Livability +3.7/5.0
- Rent growth +2.5/5.0
- Condition / age +2.5/5.0
- Schools +2.2/10.0
- Appreciation +0.0/10.0
$55,000
🖨 Deal sheet (PDF) 📄 Offer letter ✓ Due diligence
Listing remarks MLS
Welcome to 2143 Central Parkway Ave in Warren. - This property is ready for transformation and offers an excellent opportunity for investors or buyers looking to renovate and build equity. In need of TLC, the home serves as a blank canvas for a flip, full renovation, or long-term rental investment. Bring your vision and creativity to unlock its full potential and add lasting value.
Key facts
- 5,501 sq ft lot
- Garage
- Built 1946
Property features AI
Finance
- Financial info: Annual tax listed (2025)
Exterior
- Parking: Attached garage; 1-car garage
- Utilities: Public water; Public sewer
- Home design: Two-story house; Year built per public records
- Construction: Aluminum, vinyl, and wood siding; Asphalt shingle roof
- Exterior features: Lot size about 0.1263 acres; Above-grade finished area 1,144
Interior
- Bathrooms: 1 full bathroom; 1 half bathroom; One main-level bathroom
- Heating & cooling: Baseboard heating; Heating present
- Interior features: Basement present; 6 total rooms
Neighborhood map
What this means for you Summary
Snapshot
- This is a 3-bed/1.5-bath single-family listed at $55k.
Deal economics
- At list price, monthly cash flow is $441 ($5k/yr) — positive.
- The deal already cash-flows at list — no discount required.
- Meets the 1% rule at list price ($986 rent vs $55k).
- Cap rate 15.9% vs local median 5.9% in Warren — top-decile yield for the area; either an underpriced asset or a hidden risk that comps aren't pricing in. Stress-test before assuming the spread holds.
Location & tenants
- Location reads 73/100 on livability (#312 in OH) — a middle-class / working-renter tenant base. Strengths: cost of living A+, health & safety A+, housing A; Watch: crime D-, commute F, employment F.
- Warren City (urban): math 22% / reading 32% proficiency, ranked #599 of 656 in OH (top 91%) — low school quality limits family demand, transient renter base, plan for 1-2y turnover; 75% free/reduced lunch — lower-income household profile, screen leases tightly.
- Zoned schools: Willard Avenue Pk-8 School (math 19% / reading 30%, grade F, #1,217 of 1,584 statewide, top 78%, 877 students, 0% FRL); Warren G Harding High School (math 16% / reading 32%, grade F, #665 of 781 statewide, top 85%, 1,155 students, 0% FRL) — zoned schools average 0% FRL vs 75% district-wide (75 pts lower); this property's tenant base skews higher-income than the district average.
- Market conditions: 90 active listings in the ZIP; 5 comparable units currently listed for rent nearby; rentals at typical pace (median 15d on market — plan ~3-4 weeks tenant-placement turnaround); 129 units permitted in Trumbull County in 2024 (0 in 5+ unit buildings).
Forward outlook
- Local home prices are declining (-3.0%/yr); year-one equity from $380 of loan paydown is wiped out by about $2k of value loss. Plan a longer hold.
- Trumbull County population projected at -22% by 2050 — secular population decline; favor cash flow + early exit over multi-decade hold.
- At projected returns (-3.0% appreciation + 3.0% rent growth), your $15k cash investment doubles in ~4 years — after that, you're playing with house money.
Negotiation context
- Only 7 days on market — expect competitive offers; lowballing is unlikely to land.
- 4 sale attempts since 18y ago with the ask held roughly flat each time — persistent listings suggest the price (not the market) is what's stuck; bring a comps-based counter.
- Current owner paid $45k; 22% above their basis — modest negotiation headroom, anchor on the comps not their cost.
Risks & watch-outs
- Watch-outs: built in 1946 — expect roof / HVAC / electrical / plumbing capex.
Questions for the listing agent
- Built in 1946 — when were the roof, HVAC, electrical panel, plumbing, and water heater last replaced?
- Is there a deadline driving the sale (1031 exchange, divorce, estate, relocation)? That informs how much negotiation room exists.
- Crime grade is D in this area — have there been break-ins, vandalism, or insurance claims at this property in the last 3 years? What carrier currently insures it and at what premium?
- What's the average days-on-market for RENTAL listings here right now (not sales)? A rising rental-DOM trend means longer vacancies and softer asking-rent achievability than the comps imply.
- What's the recent tenant-quality profile in this submarket — average credit score on applications, eviction rate, late-payment / NSF rate, and stable-employment percentage? A property-management company in the area should have these aggregated.
- How much new for-sale + rental construction is in the pipeline within 1–3 miles? Heavy new supply typically softens prices + rents 12–24 months out; constrained supply supports both.
Investment metrics
- 1% rule
- 1.79% ✓
- Cap rate
- 15.91%
- Cash-on-cash
- 34.35%
- DSCR
- 2.53
- GRM
- 4.6
CMA / ARV
- ARV (on-the-fly)
- $134,992
- Comps found
- 12
Show comp detail 12 sales within ~0.75 mi
| Address | Dist | Beds/Ba | Sqft | Sold | Price | $/sf | Match |
|---|---|---|---|---|---|---|---|
| 2143 Central Parkway Ave SE | 0.00mi | 3/1.5 | 1,144 (0%) | 2mo | $45,000 | $39 | 98 |
| 1523 Edgehill Ave SE | 0.23mi | 3/2.0 | 1,108 (-3%) | 7mo | $122,200 | $110 | 76 |
| 1507 Westover Dr SE | 0.33mi | 3/2.0 | 1,173 (+2%) | 7mo | $133,000 | $113 | 72 |
| 1178 Meadowbrook Ave SE | 0.41mi | 2/1.0 (-1) | 1,184 (+4%) | 3mo | $95,000 | $80 | 66 |
| 3323 Draper Ave SE | 0.53mi | 2/1.0 (-1) | 1,148 (+0%) | 4mo | $136,000 | $118 | 64 |
| 696 Meadowbrook Ave SE | 0.75mi | 3/1.5 | 1,140 (-0%) | 2mo | $150,000 | $132 | 63 |
| 2712 Ridge Ave SE | 0.36mi | 2/1.0 (-1) | 1,031 (-10%) | 1mo | $82,000 | $80 | 58 |
| 948 Francis Ave SE | 0.63mi | 3/2.0 | 1,170 (+2%) | 8mo | $120,000 | $103 | 58 |
| 1153 Meadowbrook Ave SE | 0.44mi | 4/1.0 (+1) | 1,248 (+9%) | 1mo | $165,000 | $132 | 56 |
| 3788 Adrian Dr | 0.63mi | 3/2.0 | 1,092 (-4%) | 9mo | $170,000 | $156 | 53 |
| 1191 Westover | 0.49mi | 3/2.0 | 1,284 (+12%) | 2mo | $185,000 | $144 | 53 |
| 697 Perkinswood Blvd SE | 0.73mi | 3/2.0 | 1,222 (+7%) | 9mo | $161,305 | $132 | 45 |
Match score weights: distance 35% · size 25% · config 20% · recency 20%. Top-matched comps best support the ARV.
Projected returns pro-forma
-3.0% appreciation · 3.0% rent growth · sell at horizon
- IRR
- 29.8%
- Equity multiple
- 2.24×
- Total profit
- $19,150
- Equity at exit
- $8,201
- IRR
- 37.0%
- Equity multiple
- 4.43×
- Total profit
- $52,779
- Equity at exit
- $4,755
Cash invested: $15,400 (down + closing). Projections, not guarantees.
Landlord ↔ Tenant lean methodology
- Overall (STATE)
- 73 Landlord-Friendly
- State Ohio
- 73 Landlord-Friendly · R+6
- County
- — inherits STATE
- City
- — inherits STATE
ZIP-level market 44484
- Home prices YoY
- -17.5%
- Active inventory
- 90
- Price-to-rent
- 4.6×
Monthly cashflow live
- Estimated rent
- $986 high interval (Pro) →
- Mortgage (P&I)
- −$288
- Tax from tax record
- −$27 /mo · $322/yr
- Insurance
- −$23
- HOA
- −$0
- Vacancy / Maint / Mgmt
- −$207
- Net cashflow
- $441
Break-even live
Sensitivity live
| Price | -10% $472 | -5% $456 | +0% $441 | +5% $425 | +10% $410 |
|---|---|---|---|---|---|
| Rent | -10% $363 | -5% $402 | +0% $441 | +5% $480 | +10% $519 |
| Rate | -1.0pp $468 | -0.5pp $455 | base $441 | +0.5pp $427 | +1.0pp $412 |
UW: 25.0% down · 7.5% · 30yr · 1.5% tax · 5.0% vac · 8.0% maint · 8.0% mgmt
Financing live
Cash to close
- Down payment
- $13,750
- Closing costs
- $1,650
- Reserves months
- —
- Total cash needed
- —
Loan-product check · same deal, 3 products live
Conventional
25% down · 7.5% · 30yr
- Down + closing
- —
- Monthly P&I
- —
- Monthly cashflow
- —
- DSCR
- —
- Eligible?
- —
Personal DTI + credit; lowest rate.
DSCR
20% down · 8.5% · 30yr
- Down + closing
- —
- Monthly P&I
- —
- Monthly cashflow
- —
- DSCR
- —
- Eligible?
- —
No personal income docs; deal must DSCR.
Hard money
10% down · 12.0% · 12mo
- Down + closing
- —
- Monthly P&I
- —
- Monthly cashflow
- —
- DSCR
- —
- Eligible?
- —
Short-term bridge; refi at stabilization.
Rent comps 5 comps
| Address | Beds | Baths | Sqft | Rent | $/sqft | DOM | Units | Dist |
|---|---|---|---|---|---|---|---|---|
| 2232 Youngstown Rd SE Warren, OH | 2.0 | 1.0 | 800 | $1,050 | $1.31 | 15d | 1 | 0.58mi |
| 1151 Kenilworth Ave SE Warren, OH | 2.0 | 1.0 | 1207 | $900 | $0.75 | 15d | 1 | 0.86mi |
| 840 Woodbine Ave SE Unit 838 Warren, OH | 2.0 | 1.0 | 1009 | $1,000 | $0.99 | 15d | 1 | 0.90mi |
| 259 Perkinswood Blvd NE Warren, OH | 1.0–2.0 | 1.0 | 743 | $845 | $1.14 | 15d | 3 | 1.30mi |
| 341 Charles AVE Warren, OH | 3.0 | 1.0 | 1232 | $1,100 | $0.89 | 45d | 1 | 1.43mi |
Listing history 7 events
-
2026-06-22days on market $55,000 Active 7 DOM
-
2026-06-19days on market $55,000 Active 5 DOM
-
2026-06-18days on market $55,000 Active 4 DOM
-
2026-06-17days on market $55,000 Active 3 DOM
-
2026-06-16days on market $55,000 Active 2 DOM
-
2026-06-15remarks 699-char remark
-
2026-06-15$55,000 Active 1 DOM
ⓘ Source: listings_history table (triggers on properties + properties_extension) + one-shot
backfill from property_details.listing_events for pre-trigger history.
Tax reassessment forecast OH · Partial reset (capped growth)
- Current annual tax
- $322 · $27/mo
- Projected year-2 tax
- $590 · $49/mo
- Expected delta
- +$268/yr (+$22/mo · 83.4%)
ⓘ Screening estimate from a state-policy table — verify with the county assessor before closing.
Climate risk First Street
- Flood 1/10 Low FEMA zone X (unshaded) · 0% chance over 30 yrs
- Wildfire 1/10 Low
- Heat 3/10 Moderate 7 d/yr ≥98°F today · 17 d/yr by 30 yrs out
- Wind 1/10 Low
- Air quality 3/10 Moderate 1 unhealthy d/yr today · 4 by 30 yrs out
Nearby sold comps map
Loading sold comps map…
Walkable amenities ~0.75 mi
Loading nearby amenities…
Taxation est. · year 1
- Rental income
- $11,832
- − Mortgage interest
- −$3,081
- − Property taxes
- −$322
- − Insurance
- −$275
- − Repairs & maintenance
- −$947
- − Management
- −$947
- − Depreciation
- −$1,600
- Taxable income
- $4,661
- Est. tax owed @ 24.0%
- −$1,119
- After-tax cash flow
- $4,171/yr
For passive investors: Depreciation is non-cash, so a rental often shows a tax loss while cash-flowing — sheltering income. Rental losses are passive: they offset passive income freely, and up to $25,000/yr can offset ordinary (W-2) income if you actively participate and your MAGI is under $100k (phasing out to $0 by $150k); unused losses carry forward. On sale, claimed depreciation is recaptured at up to 25%, and gains may owe capital-gains tax (a 1031 exchange can defer both). Figures are a year-1 estimate at your 24.0% rate — not tax advice; consult a CPA.
Schools (NCES district)
- District
- Warren City
- NCES district ID
- 3904499
- Math proficiency
- 22% ▼ -16.00%
- Reading proficiency
- 32% ▼ -9.00%
- Median HH income
- $28,222
- Composite
- 21.6/100
- National rank
- #8299
- State rank
- #599 of 656 in OH
Livability — Warren
- Score
- 73/100
- State rank
- #312
- US rank
- #5068
Category grades
Schools grade is shown separately in the Schools card above.
Census & demographics
- Census place
- Warren, OH
- County
- Trumbull · 193,293 people
- City population
- 25,805
- Metro
- Youngstown-Warren, OH
- Population (ZIP)
- 21,634
- Household income
- $65,435
- Rent vs Own
- Severe rent burden
- 6.7
Population outlook (Trumbull County) Hauer SSP2
- Today (2025)
- 191,696 people
- By 2030
- 184,015 · -4.0%
- By 2040
- 166,810 · -13.0%
- By 2050
- 149,857 · -21.8%
- By 2075
- 115,769 · -39.6%
- By 2100
- 83,617 · -56.4%
Race, ethnicity, and origin ACS 2023
- Neighborhood character
- Predominantly White (84%)
- Race & ethnicity
- White 84% Black 8% Two or more races 5% Hispanic / Latino 3% Asian 2%
- Common ancestry
- Romanian 3% Lithuanian 2% Serbian 1%
- Foreign-born
- 3% · China, Canada
- Languages at home
- 96% English-only · Other Indo-European 2% Other Asian/Pacific 1% Spanish 1%
Political lean MEDSL · Trumbull
- 2024 margin
- R (+16.8) · D 41.2% · R 58.0%
- 2008→2024 swing
- -39.2pp toward R · 2008: 22.4pp · 2024: -16.8pp
- All cycles
- 2024: R+16.8 2020: R+10.6 2016: R+6.4 2012: D+22.2 2008: D+22.4
Not yet ingested
- Civics
- —
Market trends
- HPI YoY
- ▼ -46.24%
- Current HPI
- 217.6603
- Rent YoY
- —
- Metro
- —
- State GDP YoY
- ▲ 1.98%
- F500 in state
- 48
Industry mix (Fortune 500 HQ in OH)
| Industry | F500 HQs | Revenue |
|---|---|---|
| Insurance | 3 | $145B |
|
||
| Industrial Machinery | 3 | $49B |
|
||
| Financial Services | 3 | $24B |
|
||
| Consumer Goods | 2 | $93B |
|
||
| Aerospace / Defense | 2 | $47B |
|
||
| Utilities | 2 | $33B |
|
||
Price history
-21.3% since first listed13 events — show timeline
- 2026-06-14 Listed $55,000 MLSNOW
- 2026-04-29 Sold (Public Records) $45,000 Public Records
- 2026-04-28 Sold (MLS) $45,000 MLSNOW
- 2026-04-15 Pending — MLSNOW
- 2026-04-08 Listed $49,900 MLSNOW
- 2017-04-28 Sold (Public Records) $6,150 Public Records
- 2017-04-20 Sold (MLS) $6,150 MLSNOW
- 2017-03-26 Pending — MLSNOW
- 2017-03-21 Contingent — MLSNOW
- 2017-03-09 Sold (Public Records) $6,000 Public Records
- 2017-03-04 Listed $5,050 MLSNOW
- 2009-02-28 Listing Removed — MLSNOW
- 2008-03-07 Listed $69,900 MLSNOW
Property tax history
-4.6%/yrLatest (2025): $322 · +1.9% YoY. Source: county tax records.
Cash-flow waterfall
monthlySold comps — $/sqft
last 12 mo · ≤1 miLoading sold comps…