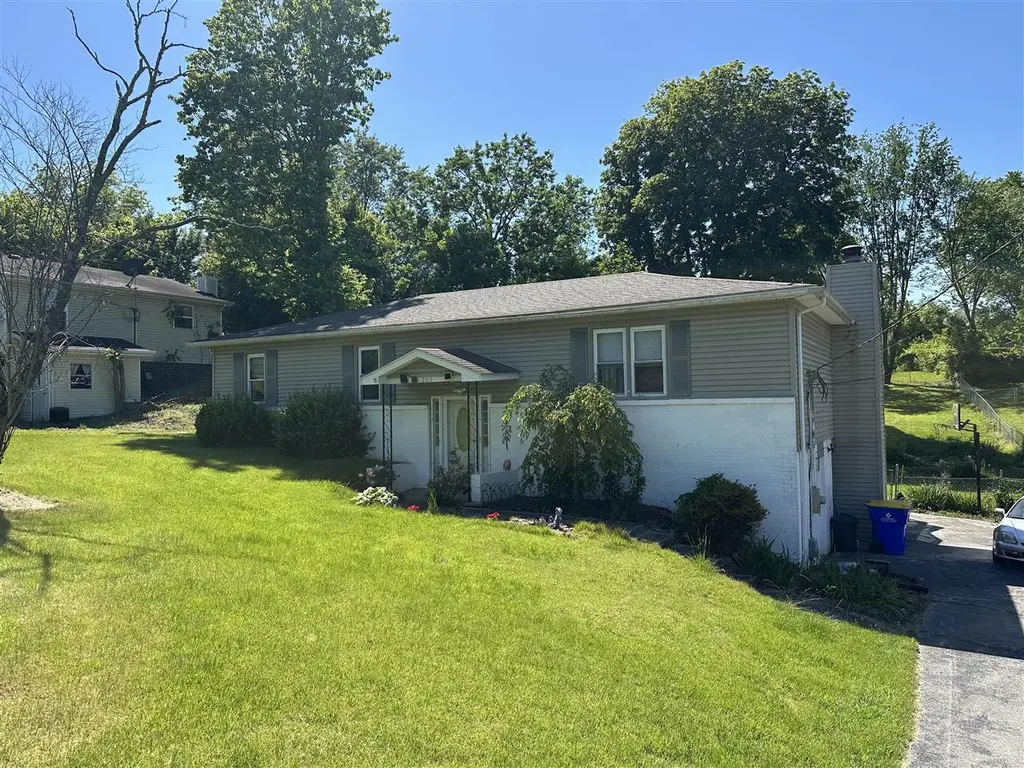
609 Clark Cir · Bowling Green, KY
Flood risk 5/10 · Moderate
- FEMA flood zone
- X (unshaded)
- Chance of flooding over 30 yrs
- 0.24%
- Est. flood insurance / yr
- $473 – $860
Fire risk 2/10 · Minimal
- Est. fire insurance / yr
- $839 – $1,559
Heat risk 6/10 · Moderate
- Hot days now (above 107°F)
- 7 days/yr
- Hot days in 30 yrs
- 19 days/yr
Wind risk 3/10 · Minor
- Chance of severe wind over 30 yrs
- 8.0%
Air-quality risk 2/10 · Minimal
- Unhealthy air days now
- 0 days/yr
- Unhealthy air days in 30 yrs
- 1 days/yr
Risk factors via First Street. Map © Google.
Why this score? — see what drove the C grade
The composite is a weighted blend of 9 inputs, each scored 0–100. Each bar is that input's sub-score; the figure is the points it added to the 100-point composite (weight × sub-score).
- Cash flow +24.9/30.0
- DSCR +8.1/10.0
- ARV discount +7.5/15.0
- 1% rule +5.3/10.0
- Schools +3.2/10.0
- Livability +3.2/5.0
- Rent growth +2.5/5.0
- Condition / age +2.5/5.0
- Appreciation +0.0/10.0
$160,000
🖨 Deal sheet 📄 Offer letter ✓ Due diligence
Listing remarks
Don't miss this investment opportunity! This 3 bed, 1.5 bath house has tons of potential. Would make a great flip or rental with the right TLC. Home features a large eat-in kitchen, spacious living room and primary bedroom, along with some previous updates to the hall bathroom. The basement is flexible and has room to add a 4th bed or bonus area/room. Call me today for your private showing!
Key facts
- Flexible basement
- Large eat-in kitchen
- Spacious living room
Tags
Property features AI
Exterior
- Utilities: Septic tank
- Home design: Single-family residence; Residential property
- Construction: Brick and vinyl siding exterior
- Exterior features: Deck; Chain link fencing; Approximately 0.45-acre lot
Interior
- Kitchen: Dishwasher; Range/Oven; Refrigerator; Electric water heater
- Flooring: Vinyl
- Bathrooms: 1 full bathroom (main level)
- Heating & cooling: Heat pump; Electric heating
- Interior features: Eat-in kitchen; Wood-burning fireplace; Unfinished basement
- Laundry & utility: Laundry room
Neighborhood map
What this means for you Summary
Snapshot
- This is a 3-bed/2.0-bath single-family listed at $160k.
Deal economics
- At list price, monthly cash flow is $342 ($4k/yr) — positive.
- The deal already cash-flows at list — no discount required.
- Meets the 1% rule at list price ($2k rent vs $160k).
- Recommended offer: $155k (3.0% below list) — sets the bar for market timing.
- Cap rate 8.9% vs local median 3.2% in Bowling Green — top-decile yield for the area; either an underpriced asset or a hidden risk that comps aren't pricing in. Stress-test before assuming the spread holds.
Location & tenants
- Location reads 65/100 on livability (#255 in KY) — a middle-class / working-renter tenant base. Strengths: cost of living A+, housing A+; Watch: crime C-, amenities F, commute F.
- Warren County (rural): math 30% / reading 43% proficiency, ranked #48 of 165 in KY (top 29%) — families likely to look elsewhere, expect single-tenant / working-renter base with shorter leases.
- Zoned schools: Oakland Elementary (math 8% / reading 17%, grade F, #630 of 676 statewide, top 95%, 380 students, 79% FRL); Warren East Middle School (math 23% / reading 40%, grade F, #125 of 217 statewide, top 63%, 487 students, 65% FRL); Warren East High School (math 22% / reading 31%, grade F, #174 of 254 statewide, top 69%, 1,031 students, 60% FRL) — zoned schools average 68% FRL vs 42% district-wide (25 pts higher); higher-poverty schools than district average — tighter screening recommended.
- Zoned-school proficiency averages 23% at this address vs 36% district-wide (-13 pts) — the specific schools serving this property underperform the Warren County average; the district grade overstates school quality for this exact location.
- Market conditions: 279 active listings in the ZIP; solid renter incomes; 2,286 units permitted in Warren County in 2024 (1,410 in 5+ unit buildings).
Forward outlook
- Local home prices are declining (-3.0%/yr); year-one equity from $1k of loan paydown is wiped out by about $5k of value loss. Plan a longer hold.
- Warren County population projected at +41% by 2050 — long-run rental-demand tailwind backs the buy-and-hold thesis.
Negotiation context
- It's been on market 37 days — a 3% lower offer ($155k) is reasonable based on typical stale-listing flexibility.
- 2 sale attempts with the ask held roughly flat each time — persistent listings suggest the price (not the market) is what's stuck; bring a comps-based counter.
Risks & watch-outs
- Climate carrying-cost: moderate flood risk; extreme-heat days projected 7→19/yr by 2055 (HVAC capex compounding) — expect insurance premiums to compound above CPI over the hold.
Questions for the listing agent
- It's been on market 37 days. Have you received any prior offers? Is the seller open to a 3% concession, seller financing, or rate buy-down credit?
- Built in 1975 — when were the roof, HVAC, electrical panel, plumbing, and water heater last replaced?
- Is there a deadline driving the sale (1031 exchange, divorce, estate, relocation)? That informs how much negotiation room exists.
- Schools are D-rated, which usually means shorter tenancies and higher turnover. Who's the typical renter profile here, and what's been the actual vacancy rate?
- What's the average days-on-market for RENTAL listings here right now (not sales)? A rising rental-DOM trend means longer vacancies and softer asking-rent achievability than the comps imply.
- What's the recent tenant-quality profile in this submarket — average credit score on applications, eviction rate, late-payment / NSF rate, and stable-employment percentage? A property-management company in the area should have these aggregated.
- How much new for-sale + rental construction is in the pipeline within 1–3 miles? Heavy new supply typically softens prices + rents 12–24 months out; constrained supply supports both.
Investment metrics
- 1% rule
- 1.03% ✓
- Cap rate
- 8.86%
- Cash-on-cash
- 9.16%
- DSCR
- 1.41
- GRM
- 8.1
CMA / ARV
No comps found within radius.
Projected returns pro-forma
-3.0% appreciation · 3.0% rent growth · sell at horizon
- IRR
- -2.5%
- Equity multiple
- 0.91×
- Total profit
- $-4,212
- Equity at exit
- $23,857
- IRR
- 7.2%
- Equity multiple
- 1.54×
- Total profit
- $24,115
- Equity at exit
- $13,834
Cash invested: $44,800 (down + closing). Projections, not guarantees.
Landlord ↔ Tenant lean methodology
- Overall (STATE)
- 83 Strongly Landlord-Friendly
- State Kentucky
- 83 Strongly Landlord-Friendly · R+16
- County
- — inherits STATE
- City
- — inherits STATE
ZIP-level market 42103
- Home prices YoY
- -30.4%
- Active inventory
- 279
- Price-to-rent
- 8.1×
Monthly cashflow live
- Estimated rent
- $1,648 medium interval (Pro) →
- Mortgage (P&I)
- −$839
- Tax from tax record
- −$54 /mo · $652/yr
- Insurance
- −$67
- HOA
- −$0
- Vacancy / Maint / Mgmt
- −$346
- Net cashflow
- $342
Break-even live
UW: 25.0% down · 7.5% · 30yr · 1.5% tax · 5.0% vac · 8.0% maint · 8.0% mgmt
Financing live
Cash to close
- Down payment
- $40,000
- Closing costs
- $4,800
- Reserves months
- —
- Total cash needed
- —
Loan-product check · same deal, 3 products live
Conventional
25% down · 7.5% · 30yr
- Down + closing
- —
- Monthly P&I
- —
- Monthly cashflow
- —
- DSCR
- —
- Eligible?
- —
Personal DTI + credit; lowest rate.
DSCR
20% down · 8.5% · 30yr
- Down + closing
- —
- Monthly P&I
- —
- Monthly cashflow
- —
- DSCR
- —
- Eligible?
- —
No personal income docs; deal must DSCR.
Hard money
10% down · 12.0% · 12mo
- Down + closing
- —
- Monthly P&I
- —
- Monthly cashflow
- —
- DSCR
- —
- Eligible?
- —
Short-term bridge; refi at stabilization.
Listing history 20 events
-
2026-06-19days on market $160,000 Active 37 DOM
-
2026-06-18status $160,000 Active 36 DOM
-
2026-06-18days on market $160,000 Active Under Contract 36 DOM
-
2026-06-17days on market $160,000 Active Under Contract 35 DOM
-
2026-06-16days on market $160,000 Active Under Contract 34 DOM
-
2026-06-15days on market $160,000 Active Under Contract 33 DOM
-
2026-06-14days on market $160,000 Active Under Contract 31 DOM
-
2026-06-13statusdays on market $160,000 Active Under Contract 30 DOM
-
2026-06-10days on market $160,000 Active 28 DOM
-
2026-06-09days on market $160,000 Active 27 DOM
-
2026-06-08days on market $160,000 Active 26 DOM
-
2026-06-07days on market $160,000 Active 25 DOM
-
2026-06-05days on market $160,000 Active 22 DOM
-
2026-06-02days on market $160,000 Active 20 DOM
-
2026-06-01days on market $160,000 Active 19 DOM
-
2026-05-31days on market $160,000 Active 18 DOM
-
2026-05-30days on market $160,000 Active 17 DOM
-
2026-05-21status Active
-
2026-05-15historical Active Under Contract
-
2026-05-13$160,000 Active
ⓘ Source: listings_history table (triggers on properties + properties_extension) + one-shot
backfill from property_details.listing_events for pre-trigger history.
Tax reassessment forecast KY · Resets to sale price
- Current annual tax
- $652 · $54/mo
- Projected year-2 tax
- $1,376 · $115/mo
- Expected delta
- +$724/yr (+$60/mo · 111.2%)
ⓘ Screening estimate from a state-policy table — verify with the county assessor before closing.
Climate risk First Street
- Flood 5/10 Major FEMA zone X (unshaded) · 24% chance over 30 yrs
- Wildfire 2/10 Low
- Heat 6/10 Major 7 d/yr ≥107°F today · 19 d/yr by 30 yrs out
- Wind 3/10 Moderate 8% chance of damaging wind over 30 yrs
- Air quality 2/10 Low 0 unhealthy d/yr today · 1 by 30 yrs out
Nearby sold comps map
Loading sold comps map…
Walkable amenities ~0.75 mi
Loading nearby amenities…
Taxation est. · year 1
- Rental income
- $19,777
- − Mortgage interest
- −$8,962
- − Property taxes
- −$652
- − Insurance
- −$800
- − Repairs & maintenance
- −$1,582
- − Management
- −$1,582
- − Depreciation
- −$4,655
- Taxable income
- $1,544
- Est. tax owed @ 24.0%
- −$371
- After-tax cash flow
- $3,733/yr
For passive investors: Depreciation is non-cash, so a rental often shows a tax loss while cash-flowing — sheltering income. Rental losses are passive: they offset passive income freely, and up to $25,000/yr can offset ordinary (W-2) income if you actively participate and your MAGI is under $100k (phasing out to $0 by $150k); unused losses carry forward. On sale, claimed depreciation is recaptured at up to 25%, and gains may owe capital-gains tax (a 1031 exchange can defer both). Figures are a year-1 estimate at your 24.0% rate — not tax advice; consult a CPA.
Schools (NCES district)
- District
- Warren County
- NCES district ID
- 2105730
- Math proficiency
- 30% ▼ -18.00%
- Reading proficiency
- 43% ▼ -16.00%
- Median HH income
- $50,092
- Composite
- 31.55/100
- National rank
- #5958
- State rank
- #48 of 165 in KY
Livability — Bowling Green
- Score
- 65/100
- State rank
- #255
- US rank
- #12782
Category grades
Schools grade is shown separately in the Schools card above.
Census & demographics
- County
- Warren County · 129,408 people
- City population
- 129,408
- Metro
- Bowling Green, KY
- Population (ZIP)
- 21,911
- Household income
- $87,689
- Rent vs Own
- Severe rent burden
- 704.0
Population outlook (Warren County) Hauer SSP2
- Today (2025)
- 144,620 people
- By 2030
- 155,977 · +7.9%
- By 2040
- 179,381 · +24.0%
- By 2050
- 203,713 · +40.9%
- By 2075
- 267,291 · +84.8%
- By 2100
- 314,019 · +117.1%
Race, ethnicity, and origin ACS 2023
- Neighborhood character
- Predominantly White (83%)
- Race & ethnicity
- White 83% Black 6% Asian 5% Hispanic / Latino 4% Two or more races 3%
- Common ancestry
- Slovak 4% Italian 2% Romanian 2%
- Foreign-born
- 8% · Canada, Philippines, China
- Languages at home
- 90% English-only · Other Asian/Pacific 4% Spanish 3% Other Indo-European 1%
Political lean MEDSL · Warren
- 2024 margin
- Strong R (+24.3) · D 37.0% · R 61.3% · Other 1.6%
- 2008→2024 swing
- -5.4pp toward R · 2008: -18.9pp · 2024: -24.3pp
- All cycles
- 2024: R+24.3 2020: R+16.8 2016: R+24.2 2012: R+21.8 2008: R+18.9
Not yet ingested
- Civics
- —
Market trends
- HPI YoY
- ▼ -90.89%
- Current HPI
- 208.4381
- Rent YoY
- —
- Metro
- Bowling Green, KY
- State GDP YoY
- ▲ 1.81%
- F500 in state
- 4
Industry mix (Fortune 500 HQ in KY)
| Industry | F500 HQs | Revenue |
|---|---|---|
| Healthcare | 1 | $118B |
|
||
| Food / Beverage | 1 | $7B |
|
||
Price history
3 events — show timeline
- 2026-05-21 Relisted — RASKMLS
- 2026-05-15 Contingent — RASKMLS
- 2026-05-13 Listed $160,000 RASKMLS
Property tax history
+2.5%/yrLatest (2025): $652 · +2.8% YoY. Source: county tax records.
Cash-flow waterfall
monthlySold comps — $/sqft
last 12 mo · ≤1 miLoading sold comps…