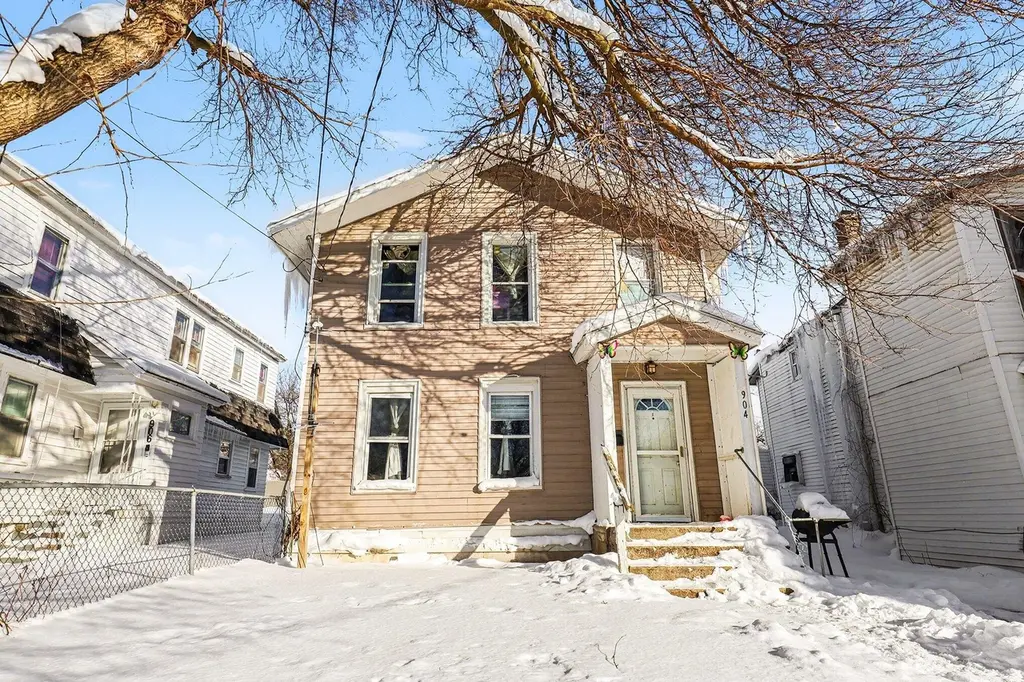
904 College Ave NE · Grand Rapids, MI
Flood risk 1/10 · Minimal
- FEMA flood zone
- X (unshaded)
- Chance of flooding over 30 yrs
- 0.0%
- Est. flood insurance / yr
- $507 – $1,088
Fire risk 1/10 · Minimal
- Est. fire insurance / yr
- $784 – $1,456
Heat risk 2/10 · Minimal
- Hot days now (above 96°F)
- 7 days/yr
- Hot days in 30 yrs
- 16 days/yr
Wind risk 2/10 · Minimal
- Chance of severe wind over 30 yrs
- —
Air-quality risk 3/10 · Minor
- Unhealthy air days now
- 2 days/yr
- Unhealthy air days in 30 yrs
- 3 days/yr
Risk factors via First Street. Map © Google.
Why this score? — see what drove the D grade
The composite is a weighted blend of 9 inputs, each scored 0–100. Each bar is that input's sub-score; the figure is the points it added to the 100-point composite (weight × sub-score).
- Cash flow +14.8/30.0
- ARV discount +7.5/15.0
- 1% rule +5.0/10.0
- DSCR +4.5/10.0
- Livability +4.2/5.0
- Rent growth +3.2/5.0
- Condition / age +2.5/5.0
- Schools +1.9/10.0
- Appreciation +0.0/10.0
$219,000
🖨 Deal sheet (PDF) 📄 Offer letter ✓ Due diligence
Listing remarks MLS
* * Property is now vacant * * 904 College NE is a spacious 4 BR, 1 BA home featuring a main-floor bedroom and dedicated main-floor laundry--an ideal layout for everyday convenience. Just minutes from the Medical Mile and downtown with quick access to US-131, it offers an easy commute and a great location! Vinyl replacement windows and durable vinyl siding add low-maintenance appeal and long-term value. Just a little TLC and this thing is move-in ready! Don't miss this one. Schedule your showing today!
Key facts
- Durable vinyl siding
- Main-floor bedroom
- Great location
Tags
Property features AI
Finance
- Other: Living area approximately 1,563
- Financial info: Details not provided
- HOA & community: Details not provided
Exterior
- Parking: Details not provided
- Security: Details not provided
- Utilities: Public water; Natural gas
- Home design: Traditional single-family residence; Built in 1915
- Construction: Vinyl siding; Shingle roof; Partial basement
- Exterior features: Wooded lot; Paved road access
Interior
- Kitchen: Range; Refrigerator; Dryer
- Bedrooms: Details not provided
- Flooring: Details not provided
- Bathrooms: 1 full bathroom
- Heating & cooling: Forced air heating
- Interior features: Replacement insulated windows; 8 total rooms
- Laundry & utility: Washer; Natural gas water heater
Neighborhood map
What this means for you Summary
Snapshot
- This is a 4-bed/1.0-bath single-family listed at $219k.
Deal economics
- At list price, monthly cash flow is $58 ($700/yr) — positive.
- The deal already cash-flows at list — no discount required.
- Meets the 1% rule at list price ($2k rent vs $219k).
- Recommended offer: $212k (3.0% below list) — sets the bar for market timing.
- Cap rate 6.6% vs local median 4.5% in Grand Rapids — top-decile yield for the area; either an underpriced asset or a hidden risk that comps aren't pricing in. Stress-test before assuming the spread holds.
Location & tenants
- Location reads 83/100 on livability (#44 in MI, #939 nationally) — a professional / high-income tenant draw. Strengths: amenities A+, commute A+, cost of living A+; Watch: employment C-, crime F.
- Grand Rapids Public Schools (urban): math 15% / reading 29% proficiency, ranked #451 of 540 in MI (top 84%) — low school quality limits family demand, transient renter base, plan for 1-2y turnover; 80% free/reduced lunch — lower-income household profile, screen leases tightly.
- Zoned schools: East Leonard Elementary (math 5% / reading 24%, grade F, #1,172 of 1,397 statewide, top 85%, 167 students, 92% FRL); Riverside Middle School (math 8% / reading 17%, grade F, #466 of 493 statewide, top 95%, 248 students, 89% FRL); Union High School (math 2% / reading 12%, grade F, #699 of 713 statewide, top 99%, 922 students, 88% FRL).
- Market conditions: Rents rising (+2.8%/yr); 184 active listings in the ZIP; 14 comparable units currently listed for rent nearby; rentals lingering (median 46d on market — plan ~5-8 weeks vacancy on turnover, expect pricing pressure); 79% of comp listings sitting > 30 days — soft ceiling on asking rent; 2,253 units permitted in Kent County in 2024 (969 in 5+ unit buildings).
- This rent runs 41% of the median local income ($65k/yr) — at the standard rent-burdened threshold; future hikes will face affordability resistance.
Forward outlook
- Local home prices are declining (-3.0%/yr); year-one equity from $2k of loan paydown is wiped out by about $7k of value loss. Plan a longer hold.
- Kent County population projected at +22% by 2050 — long-run rental-demand tailwind backs the buy-and-hold thesis.
Negotiation context
- It's been on market 46 days — a 3% lower offer ($212k) is reasonable based on typical stale-listing flexibility.
- 17 sale attempts since 38y ago with the ask held roughly flat each time — persistent listings suggest the price (not the market) is what's stuck; bring a comps-based counter.
- Current owner paid $160k; 37% above their basis — modest negotiation headroom, anchor on the comps not their cost.
Risks & watch-outs
- Watch-outs: built in 1915 — expect roof / HVAC / electrical / plumbing capex.
Questions for the listing agent
- It's been on market 46 days. Have you received any prior offers? Is the seller open to a 3% concession, seller financing, or rate buy-down credit?
- Built in 1915 — when were the roof, HVAC, electrical panel, plumbing, and water heater last replaced?
- Is there a deadline driving the sale (1031 exchange, divorce, estate, relocation)? That informs how much negotiation room exists.
- Crime grade is F in this area — have there been break-ins, vandalism, or insurance claims at this property in the last 3 years? What carrier currently insures it and at what premium?
- The area grade is low — what's the realistic commute time and amenity access for the typical tenant pool here? Any planned neighborhood developments (good or bad) we should know about?
- What's the average days-on-market for RENTAL listings here right now (not sales)? A rising rental-DOM trend means longer vacancies and softer asking-rent achievability than the comps imply.
- What's the recent tenant-quality profile in this submarket — average credit score on applications, eviction rate, late-payment / NSF rate, and stable-employment percentage? A property-management company in the area should have these aggregated.
- How much new for-sale + rental construction is in the pipeline within 1–3 miles? Heavy new supply typically softens prices + rents 12–24 months out; constrained supply supports both.
Investment metrics
- 1% rule
- 1.00% ✓
- Cap rate
- 6.61%
- Cash-on-cash
- 1.14%
- DSCR
- 1.05
- GRM
- 8.3
CMA / ARV
No comps found within radius.
Projected returns pro-forma
-3.0% appreciation · 2.82% rent growth · sell at horizon
- IRR
- -14.6%
- Equity multiple
- 0.48×
- Total profit
- $-32,038
- Equity at exit
- $32,654
- IRR
- -6.2%
- Equity multiple
- 0.61×
- Total profit
- $-24,201
- Equity at exit
- $18,935
Cash invested: $61,320 (down + closing). Projections, not guarantees.
Landlord ↔ Tenant lean methodology
- Overall (STATE)
- 62 Landlord-Friendly
- State Michigan
- 62 Landlord-Friendly · EVEN
- County
- — inherits STATE
- City
- — inherits STATE
ZIP-level market 49503
- Rents YoY
- 2.8%
- Active inventory
- 184
- Price-to-rent
- 8.3×
Monthly cashflow live
- Estimated rent
- $2,194 high interval (Pro) →
- Mortgage (P&I)
- −$1,148
- Tax from tax record
- −$435 /mo · $5,219/yr
- Insurance
- −$91
- HOA
- −$0
- Vacancy / Maint / Mgmt
- −$461
- Net cashflow
- $58
Break-even live
Sensitivity live
| Price | -10% $182 | -5% $120 | +0% $58 | +5% $-4 | +10% $-66 |
|---|---|---|---|---|---|
| Rent | -10% $-115 | -5% $-28 | +0% $58 | +5% $145 | +10% $232 |
| Rate | -1.0pp $169 | -0.5pp $114 | base $58 | +0.5pp $2 | +1.0pp $-56 |
UW: 25.0% down · 7.5% · 30yr · 1.5% tax · 5.0% vac · 8.0% maint · 8.0% mgmt
Financing live
Cash to close
- Down payment
- $54,750
- Closing costs
- $6,570
- Reserves months
- —
- Total cash needed
- —
Loan-product check · same deal, 3 products live
Conventional
25% down · 7.5% · 30yr
- Down + closing
- —
- Monthly P&I
- —
- Monthly cashflow
- —
- DSCR
- —
- Eligible?
- —
Personal DTI + credit; lowest rate.
DSCR
20% down · 8.5% · 30yr
- Down + closing
- —
- Monthly P&I
- —
- Monthly cashflow
- —
- DSCR
- —
- Eligible?
- —
No personal income docs; deal must DSCR.
Hard money
10% down · 12.0% · 12mo
- Down + closing
- —
- Monthly P&I
- —
- Monthly cashflow
- —
- DSCR
- —
- Eligible?
- —
Short-term bridge; refi at stabilization.
Rent comps 14 comps
| Address | Beds | Baths | Sqft | Rent | $/sqft | DOM | Units | Dist |
|---|---|---|---|---|---|---|---|---|
| 519 Shirley St NE Grand Rapids, MI | 5.0 | 2.0 | 1192 | $2,045 | $1.72 | 45d | 1 | 0.05mi |
| 728 Fairview Ave NE Grand Rapids, MI | 4.0 | 2.0 | 2000 | $2,100 | $1.05 | 45d | 1 | 0.55mi |
| 414 Benson Ave NE Grand Rapids, MI | 1.0–3.0 | 1.0–2.0 | 1110 | $2,673 | $2.41 | 45d | 14 | 0.57mi |
| 541 Eastern Ave NE Grand Rapids, MI | 4.0 | 2.0 | 1600 | $2,300 | $1.44 | 45d | 1 | 0.58mi |
| 135 Page St NE Grand Rapids, MI | 3.0 | 2.0 | 1100 | $3,100 | $2.82 | 45d | 1 | 0.66mi |
| 50 Mathews Ct NE Grand Rapids, MI | 3.0 | 1.5 | 1100 | $1,850 | $1.68 | 45d | 1 | 0.90mi |
| 138 Travis St NE Grand Rapids, MI | 4.0 | 2.0 | 1800 | $2,395 | $1.33 | 13d | 1 | 1.09mi |
| 700 Broadway Ave NW Unit 1 Grand Rapids, MI | 4.0 | 2.0 | 1450 | $2,795 | $1.93 | 45d | 1 | 1.15mi |
| 1335 Hamilton Ave NW Unit 2 Grand Rapids, MI | 3.0 | 1.0 | 1124 | $1,395 | $1.24 | 45d | 1 | 1.32mi |
| 523 Crosby St NW Grand Rapids, MI | 5.0 | 2.0 | 1701 | $2,200 | $1.29 | 45d | 1 | 1.33mi |
| 1044 Muskegon Ave NW Unit 2 Grand Rapids, MI | 3.0 | 1.0 | 1100 | $1,800 | $1.64 | 45d | 1 | 1.40mi |
| 1429 Quarry Ave NW Unit 1 Grand Rapids, MI | 3.0 | 1.5 | 1200 | $1,800 | $1.50 | 45d | 1 | 1.43mi |
| 1542 Michigan St NE Grand Rapids, MI | 3.0 | 1.0–2.0 | 836 | $1,895 | $2.27 | 5d | 6 | 1.47mi |
| 209 Division Ave S Grand Rapids, MI | 1.0–3.0 | 1.0–2.0 | 1180 | $1,495 | $1.27 | 23d | 2 | 1.48mi |
Listing history 50 events
-
2026-06-21days on market $219,000 Active 46 DOM
-
2026-06-18days on market $219,000 Active 43 DOM
-
2026-06-17days on market $219,000 Active 42 DOM
-
2026-06-16days on market $219,000 Active 41 DOM
-
2026-06-15days on market $219,000 Active 40 DOM
-
2026-06-14days on market $219,000 Active 38 DOM
-
2026-06-13days on market $219,000 Active 37 DOM
-
2026-06-10days on market $219,000 Active 35 DOM
-
2026-06-09days on market $219,000 Active 34 DOM
-
2026-06-08days on market $219,000 Active 33 DOM
-
2026-06-07days on market $219,000 Active 32 DOM
-
2026-06-05days on market $219,000 Active 29 DOM
-
2026-06-03days on market $219,000 Active 28 DOM
-
2026-06-03days on market $219,000 Active 27 DOM
-
2026-06-01days on market $219,000 Active 26 DOM
-
2026-05-31days on market $219,000 Active 25 DOM
-
2026-05-06$219,000 Active 624-char remark
Show marketing remark (510 chars)
* * Property is now vacant * * 904 College NE is a spacious 4 BR, 1 BA home featuring a main-floor bedroom and dedicated main-floor laundry--an ideal layout for everyday convenience. Just minutes from the Medical Mile and downtown with quick access to US-131, it offers an easy commute and a great location! Vinyl replacement windows and durable vinyl siding add low-maintenance appeal and long-term value. Just a little TLC and this thing is move-in ready! Don't miss this one. Schedule your showing today!
-
2026-05-06$219,000 Active
Show marketing remark (510 chars)
* * Property is now vacant * * 904 College NE is a spacious 4 BR, 1 BA home featuring a main-floor bedroom and dedicated main-floor laundry--an ideal layout for everyday convenience. Just minutes from the Medical Mile and downtown with quick access to US-131, it offers an easy commute and a great location! Vinyl replacement windows and durable vinyl siding add low-maintenance appeal and long-term value. Just a little TLC and this thing is move-in ready! Don't miss this one. Schedule your showing today!
-
2026-05-01historical
-
2026-04-30historical
-
2026-02-18price $224,500
-
2026-02-18price $224,500
-
2026-02-18price $224,500
-
2026-02-05$234,500 Active
-
2026-02-05$234,500 Active
-
2023-03-06soldstatus $160,000
-
2015-02-07historical
-
2015-01-31historical
-
2015-01-30historical
-
2015-01-29historical
-
2015-01-28historical
-
2015-01-28historical
-
2006-03-30historical
-
2005-11-04$84,900
-
2005-11-04$84,900
-
1996-07-22historical
-
1996-04-22$25,000
-
1996-04-22$25,000
-
1992-10-30historical
-
1992-06-23$31,500
-
1992-06-23$31,500
-
1991-04-20historical
-
1990-12-20$31,500
-
1990-12-20$31,500
-
1990-04-18historical
-
1990-01-18$29,900
-
1990-01-18$29,900
-
1988-04-05$30,000
-
1988-04-05$30,000
ⓘ Source: listings_history table (triggers on properties + properties_extension) + one-shot
backfill from property_details.listing_events for pre-trigger history.
Tax reassessment forecast MI · Partial reset (capped growth)
- Current annual tax
- $5,219 · $435/mo
- Projected year-2 tax
- $5,219 · $435/mo
- Expected delta
- $0/yr ($0/mo · 0.0%)
ⓘ Screening estimate from a state-policy table — verify with the county assessor before closing.
Climate risk First Street
- Flood 1/10 Low FEMA zone X (unshaded) · 0% chance over 30 yrs
- Wildfire 1/10 Low
- Heat 2/10 Low 7 d/yr ≥96°F today · 16 d/yr by 30 yrs out
- Wind 2/10 Low
- Air quality 3/10 Moderate 2 unhealthy d/yr today · 3 by 30 yrs out
Nearby sold comps map
Loading sold comps map…
Walkable amenities ~0.75 mi
Loading nearby amenities…
Taxation est. · year 1
- Rental income
- $26,323
- − Mortgage interest
- −$12,267
- − Property taxes
- −$5,219
- − Insurance
- −$1,095
- − Repairs & maintenance
- −$2,106
- − Management
- −$2,106
- − Depreciation
- −$6,371
- Taxable loss
- −$2,841
- Est. tax savings @ 24.0%
- +$682
- After-tax cash flow
- $1,382/yr
For passive investors: Depreciation is non-cash, so a rental often shows a tax loss while cash-flowing — sheltering income. Rental losses are passive: they offset passive income freely, and up to $25,000/yr can offset ordinary (W-2) income if you actively participate and your MAGI is under $100k (phasing out to $0 by $150k); unused losses carry forward. On sale, claimed depreciation is recaptured at up to 25%, and gains may owe capital-gains tax (a 1031 exchange can defer both). Figures are a year-1 estimate at your 24.0% rate — not tax advice; consult a CPA.
Schools (NCES district)
- District
- Grand Rapids Public Schools
- NCES district ID
- 2616440
- Math proficiency
- 15% ▼ -5.00%
- Reading proficiency
- 29% ▼ -1.00%
- Median HH income
- $40,612
- Composite
- 18.62/100
- National rank
- #8899
- State rank
- #451 of 540 in MI
Livability — Grand Rapids
- Score
- 83/100
- State rank
- #44
- US rank
- #939
Category grades
Schools grade is shown separately in the Schools card above.
Census & demographics
- Census place
- Grand Rapids, MI
- County
- Kent County · 533,805 people
- City population
- 181,325
- Metro
- Grand Rapids-Kentwood, MI
- Population (ZIP)
- 39,489
- Household income
- $64,661
- Rent vs Own
- Severe rent burden
- 1891.0
Population outlook (Kent County) Hauer SSP2
- Today (2025)
- 712,484 people
- By 2030
- 748,618 · +5.1%
- By 2040
- 814,777 · +14.4%
- By 2050
- 868,556 · +21.9%
- By 2075
- 966,487 · +35.7%
- By 2100
- 967,975 · +35.9%
Race, ethnicity, and origin ACS 2023
- Neighborhood character
- Diverse neighborhood (Simpson 0.60)
- Race & ethnicity
- White 59% Hispanic / Latino 19% Two or more races 14% Black 14% Asian 3%
- Hispanic origin (detail)
- Mexican 11% Puerto Rican 1%
- Common ancestry
- Iranian 10% Romanian 7% Slovak 2%
- Foreign-born
- 11% · Canada, South Korea, China
- Languages at home
- 82% English-only · Spanish 15% Chinese 1%
Political lean MEDSL · Kent
- 2024 margin
- Lean D (+5.4) · D 51.8% · R 46.5% · Other 1.7%
- 2008→2024 swing
- +4.8pp toward D · 2008: 0.5pp · 2024: 5.4pp
- All cycles
- 2024: D+5.4 2020: D+6.1 2016: R+3.1 2012: R+7.9 2008: D+0.5
Not yet ingested
- Civics
- —
Market trends
- HPI YoY
- ▼ -347.22%
- Current HPI
- 312.3878
- Rent YoY
- ▲ 2.82%
- Metro
- Grand Rapids-Kentwood, MI
- State GDP YoY
- ▲ 1.37%
- F500 in state
- 28
Industry mix (Fortune 500 HQ in MI)
| Industry | F500 HQs | Revenue |
|---|---|---|
| Automotive Parts | 3 | $48B |
|
||
| Automotive | 2 | $372B |
|
||
| Chemicals | 1 | $45B |
|
||
| Automotive Retail | 1 | $29B |
|
||
| Healthcare / Medical Devices | 1 | $23B |
|
||
| Automotive Technology | 1 | $20B |
|
||
Price history
+630.0% since first listed34 events — show timeline
- 2026-05-06 Listed $219,000 SW Michigan MLS
- 2026-05-06 Listed $219,000 REALCOMP
- 2026-05-06 Listed $219,000 MiRealSource-MiMLS
- 2026-05-01 Listing Removed — MiRealSource-MiMLS
- 2026-04-30 Listing Removed — REALCOMP
- 2026-02-18 Price Changed $224,500 MiRealSource-MiMLS
- 2026-02-18 Price Changed $224,500 REALCOMP
- 2026-02-18 Price Changed $224,500 SW Michigan MLS
- 2026-02-05 Listed $234,500 REALCOMP
- 2026-02-05 Listed $234,500 MiRealSource-MiMLS
- 2023-03-06 Sold (Public Records) $160,000 Public Records
- 2015-02-07 Listing Removed — SW Michigan MLS
- 2015-01-31 Listing Removed — SW Michigan MLS
- 2015-01-30 Listing Removed — SW Michigan MLS
- 2015-01-29 Listing Removed — SW Michigan MLS
- 2015-01-28 Listing Removed — SW Michigan MLS
- 2015-01-28 Listing Removed — SW Michigan MLS
- 2006-03-30 Listing Removed — REALCOMP
- 2005-11-04 Listed $84,900 REALCOMP
- 2005-11-04 Listed $84,900 SW Michigan MLS
- 1996-07-22 Listing Removed — REALCOMP
- 1996-04-22 Listed $25,000 REALCOMP
- 1996-04-22 Listed $25,000 SW Michigan MLS
- 1992-10-30 Listing Removed — REALCOMP
- 1992-06-23 Listed $31,500 REALCOMP
- 1992-06-23 Listed $31,500 SW Michigan MLS
- 1991-04-20 Listing Removed — REALCOMP
- 1990-12-20 Listed $31,500 REALCOMP
- 1990-12-20 Listed $31,500 SW Michigan MLS
- 1990-04-18 Listing Removed — REALCOMP
- 1990-01-18 Listed $29,900 REALCOMP
- 1990-01-18 Listed $29,900 SW Michigan MLS
- 1988-04-05 Listed $30,000 REALCOMP
- 1988-04-05 Listed $30,000 SW Michigan MLS
Property tax history
+10.5%/yrLatest (2025): $5,219 · +8.1% YoY. Source: county tax records.
Cash-flow waterfall
monthlySold comps — $/sqft
last 12 mo · ≤1 miLoading sold comps…