2715 W Annie Rd · Paulden, AZ
Flood risk 1/10 · Minimal
- FEMA flood zone
- X (shaded)
- Chance of flooding over 30 yrs
- 0.0%
- Est. flood insurance / yr
- $507 – $1,088
Fire risk 5/10 · Moderate
- Est. fire insurance / yr
- $610 – $1,132
Heat risk 5/10 · Moderate
- Hot days now (above 97°F)
- 7 days/yr
- Hot days in 30 yrs
- 19 days/yr
Wind risk 1/10 · Minimal
- Chance of severe wind over 30 yrs
- —
Air-quality risk 1/10 · Minimal
- Unhealthy air days now
- 0 days/yr
- Unhealthy air days in 30 yrs
- 0 days/yr
Risk factors via First Street. Map © Google.
Why this score? — see what drove the C+ grade
The composite is a weighted blend of 9 inputs, each scored 0–100. Each bar is that input's sub-score; the figure is the points it added to the 100-point composite (weight × sub-score).
- Cash flow +22.6/30.0
- ARV discount +15.0/15.0
- DSCR +7.2/10.0
- 1% rule +4.6/10.0
- Livability +3.0/5.0
- Appreciation +2.5/10.0
- Rent growth +2.5/5.0
- Schools +2.5/10.0
- Condition / age +2.5/5.0
$199,900
🖨 Deal sheet 📄 Offer letter ✓ Due diligence
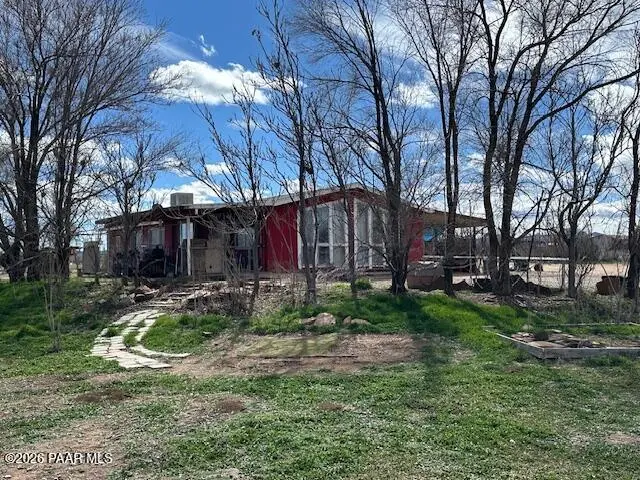
Listing remarks
Opportunity Knocks in Paulden! Time to own an affordable slice of Northern Arizona living on 2.52 acres with a private well -- how great is that? This livable home is ready for its next chapter and offers the perfect opportunity to create your own ''Home Sweet Home. ''Situated on a desirable corner parcel, the property provides easy access, added usability, and plenty of space for your vision. Whether you're dreaming of a mini-ranch, workshop, garden, or room for all your toys, there's space here to make it happen. The home does need some work, but it's a fantastic chance to build equity while customizing to your taste. With wide-open skies, privacy, and room to grow, this property is ready
Key facts
- Garden
- Private well
- Mini-ranch
Tags
Neighborhood map
What this means for you Summary
Snapshot
- This is a 3-bed/2.0-bath manufactured listed at $200k.
Deal economics
- At list price, monthly cash flow is $339 ($4k/yr) — positive.
- The deal already cash-flows at list — no discount required.
- To meet the 1% rule (rent ≥ 1% of price), the offer needs to be $192k (3.8% below list).
- Recommended offer: $192k (3.8% below list) — sets the bar for 1% rule.
- Cap rate 8.3% vs local median 3.0% in Paulden — top-decile yield for the area; either an underpriced asset or a hidden risk that comps aren't pricing in. Stress-test before assuming the spread holds.
Location & tenants
- Location reads 59/100 on livability (#202 in AZ) — a working-class tenant base; expect higher turnover. Strengths: housing A+, cost of living A-; Watch: employment D, schools F, amenities F.
- Chino Valley Unified District (4474) (town): math 24% / reading 35% proficiency, ranked #112 of 249 in AZ (top 45%) — low school quality limits family demand, transient renter base, plan for 1-2y turnover.
- Market conditions: 192 active listings in the ZIP; 2,062 units permitted in Yavapai County in 2024 (98 in 5+ unit buildings).
Forward outlook
- Local home prices are declining (-3.0%/yr); year-one equity from $1k of loan paydown is wiped out by about $6k of value loss. Plan a longer hold.
- Yavapai County population projected at +10% by 2050 — modest demand growth; plan on rents tracking national, not racing it.
Negotiation context
- Only 10 days on market — expect competitive offers; lowballing is unlikely to land.
- 2 sale attempts with the ask held roughly flat each time — persistent listings suggest the price (not the market) is what's stuck; bring a comps-based counter.
- Current owner paid $125k; list at $200k implies a 60% gain — meaningful room to come down on a strong offer.
Risks & watch-outs
- Climate carrying-cost: moderate wildfire risk; extreme-heat days projected 7→19/yr by 2055 (HVAC capex compounding) — expect insurance premiums to compound above CPI over the hold.
Questions for the listing agent
- Is there a deadline driving the sale (1031 exchange, divorce, estate, relocation)? That informs how much negotiation room exists.
- Schools are F-rated, which usually means shorter tenancies and higher turnover. Who's the typical renter profile here, and what's been the actual vacancy rate?
- What's the average days-on-market for RENTAL listings here right now (not sales)? A rising rental-DOM trend means longer vacancies and softer asking-rent achievability than the comps imply.
- What's the recent tenant-quality profile in this submarket — average credit score on applications, eviction rate, late-payment / NSF rate, and stable-employment percentage? A property-management company in the area should have these aggregated.
- How much new for-sale + rental construction is in the pipeline within 1–3 miles? Heavy new supply typically softens prices + rents 12–24 months out; constrained supply supports both.
Investment metrics
- 1% rule
- 0.96% ✗
- Cap rate
- 8.33%
- Cash-on-cash
- 7.26%
- DSCR
- 1.32
- GRM
- 8.7
CMA / ARV
- ARV (on-the-fly)
- $375,840
- Comps found
- 2
Show comp detail 2 sales within ~0.75 mi
| Address | Dist | Beds/Ba | Sqft | Sold | Price | $/sf | Match |
|---|---|---|---|---|---|---|---|
| 24921 N Verdot Rd | 0.41mi | 3/2.0 | 1,500 (+4%) | 12mo | $325,000 | $217 | 64 |
| 3107 W Country Quail Trl | 0.39mi | 3/2.0 | 1,297 (-10%) | 2mo | $338,500 | $261 | 63 |
Match score weights: distance 35% · size 25% · config 20% · recency 20%. Top-matched comps best support the ARV.
Projected returns pro-forma
-3.0% appreciation · 3.0% rent growth · sell at horizon
- IRR
- -5.2%
- Equity multiple
- 0.81×
- Total profit
- $-10,909
- Equity at exit
- $29,806
- IRR
- 4.4%
- Equity multiple
- 1.32×
- Total profit
- $17,900
- Equity at exit
- $17,284
Cash invested: $55,972 (down + closing). Projections, not guarantees.
Landlord ↔ Tenant lean methodology
- Overall (STATE)
- 87 Strongly Landlord-Friendly
- State Arizona
- 87 Strongly Landlord-Friendly · R+3
- County
- — inherits STATE
- City
- — inherits STATE
ZIP-level market 86334
- Home prices YoY
- -1.2%
- Active inventory
- 192
- Price-to-rent
- 8.7×
Monthly cashflow live
- Estimated rent
- $1,923 medium interval (Pro) →
- Mortgage (P&I)
- −$1,048
- Tax from tax record
- −$48 /mo · $581/yr
- Insurance
- −$83
- HOA
- −$0
- Vacancy / Maint / Mgmt
- −$404
- Net cashflow
- $339
Break-even live
UW: 25.0% down · 7.5% · 30yr · 1.5% tax · 5.0% vac · 8.0% maint · 8.0% mgmt
Financing live
Cash to close
- Down payment
- $49,975
- Closing costs
- $5,997
- Reserves months
- —
- Total cash needed
- —
Loan-product check · same deal, 3 products live
Conventional
25% down · 7.5% · 30yr
- Down + closing
- —
- Monthly P&I
- —
- Monthly cashflow
- —
- DSCR
- —
- Eligible?
- —
Personal DTI + credit; lowest rate.
DSCR
20% down · 8.5% · 30yr
- Down + closing
- —
- Monthly P&I
- —
- Monthly cashflow
- —
- DSCR
- —
- Eligible?
- —
No personal income docs; deal must DSCR.
Hard money
10% down · 12.0% · 12mo
- Down + closing
- —
- Monthly P&I
- —
- Monthly cashflow
- —
- DSCR
- —
- Eligible?
- —
Short-term bridge; refi at stabilization.
Listing history 6 events
-
2026-04-25status Pending
-
2026-04-15$199,900 Active
-
2026-03-26historical
-
2026-02-26$199,900 Active
-
2018-04-03soldstatus $125,000
-
2004-02-20soldstatus $91,000
ⓘ Source: listings_history table (triggers on properties + properties_extension) + one-shot
backfill from property_details.listing_events for pre-trigger history.
Tax reassessment forecast AZ · Resets to sale price
- Current annual tax
- $581 · $48/mo
- Projected year-2 tax
- $1,319 · $110/mo
- Expected delta
- +$738/yr (+$62/mo · 127.0%)
ⓘ Screening estimate from a state-policy table — verify with the county assessor before closing.
Climate risk First Street
- Flood 1/10 Low FEMA zone X (shaded) · 0% chance over 30 yrs
- Wildfire 5/10 Major
- Heat 5/10 Major 7 d/yr ≥97°F today · 19 d/yr by 30 yrs out
- Wind 1/10 Low
- Air quality 1/10 Low 0 unhealthy d/yr today · 0 by 30 yrs out
Nearby sold comps map
Loading sold comps map…
Walkable amenities ~0.75 mi
Loading nearby amenities…
Taxation est. · year 1
- Rental income
- $23,071
- − Mortgage interest
- −$11,198
- − Property taxes
- −$581
- − Insurance
- −$1,000
- − Repairs & maintenance
- −$1,846
- − Management
- −$1,846
- − Depreciation
- −$5,815
- Taxable income
- $786
- Est. tax owed @ 24.0%
- −$189
- After-tax cash flow
- $3,877/yr
For passive investors: Depreciation is non-cash, so a rental often shows a tax loss while cash-flowing — sheltering income. Rental losses are passive: they offset passive income freely, and up to $25,000/yr can offset ordinary (W-2) income if you actively participate and your MAGI is under $100k (phasing out to $0 by $150k); unused losses carry forward. On sale, claimed depreciation is recaptured at up to 25%, and gains may owe capital-gains tax (a 1031 exchange can defer both). Figures are a year-1 estimate at your 24.0% rate — not tax advice; consult a CPA.
Schools (NCES district)
- District
- Chino Valley Unified District (4474)
- NCES district ID
- 0400003
- Math proficiency
- 24% ▼ -19.00%
- Reading proficiency
- 35% ▼ -13.00%
- Median HH income
- $44,429
- Composite
- 25.22/100
- National rank
- #7505
- State rank
- #112 of 249 in AZ
Livability — Paulden
- Score
- 59/100
- State rank
- #202
- US rank
- #20477
Category grades
Schools grade is shown separately in the Schools card above.
Census & demographics
- Census place
- Paulden, AZ
- City population
- 4,309
- Population (ZIP)
- 4,309
Population outlook (Yavapai County) Hauer SSP2
- Today (2025)
- 241,389 people
- By 2030
- 249,523 · +3.4%
- By 2040
- 259,966 · +7.7%
- By 2050
- 264,736 · +9.7%
- By 2075
- 269,334 · +11.6%
- By 2100
- 256,505 · +6.3%
Race, ethnicity, and origin ACS 2023
- Neighborhood character
- Predominantly White (83%)
- Race & ethnicity
- White 83% Hispanic / Latino 13% Two or more races 5%
- Hispanic origin (detail)
- Mexican 12%
- Common ancestry
- Slovak 5% Italian 5% Lithuanian 3%
- Foreign-born
- 6% · Canada, China
- Languages at home
- 90% English-only · Spanish 6% German/W. Germanic 3% Other Asian/Pacific 1%
Political lean MEDSL · Yavapai
- 2024 margin
- Solid R (+33.9) · D 32.6% · R 66.5%
- 2008→2024 swing
- -9.5pp toward R · 2008: -24.4pp · 2024: -33.9pp
- All cycles
- 2024: R+33.9 2020: R+29.3 2016: R+31.4 2012: R+30.7 2008: R+24.4
Not yet ingested
- Civics
- —
Market trends
- HPI YoY
- ▼ -5.07%
- Current HPI
- 433.9478
- Rent YoY
- —
- Metro
- —
- State GDP YoY
- ▲ 4.54%
- F500 in state
- 20
Industry mix (Fortune 500 HQ in AZ)
| Industry | F500 HQs | Revenue |
|---|---|---|
| Technology | 2 | $13B |
|
||
| Mining / Metals | 1 | $23B |
|
||
| Environmental Services | 1 | $16B |
|
||
| Metals / Steel | 1 | $14B |
|
||
| Technology Distribution | 1 | $9B |
|
||
| Homebuilding | 1 | $8B |
|
||
Price history
+119.7% since first listed6 events — show timeline
- 2026-04-25 Pending — PAARMLS as Distributed by MLS Grid
- 2026-04-15 Listed $199,900 PAARMLS as Distributed by MLS Grid
- 2026-03-26 Listing Removed — PAARMLS as Distributed by MLS Grid
- 2026-02-26 Listed $199,900 PAARMLS as Distributed by MLS Grid
- 2018-04-03 Sold (Public Records) $125,000 Public Records
- 2004-02-20 Sold (Public Records) $91,000 Public Records
Property tax history
+1.7%/yrLatest (2025): $581 · +4.5% YoY. Source: county tax records.
Cash-flow waterfall
monthlySold comps — $/sqft
last 12 mo · ≤1 miLoading sold comps…