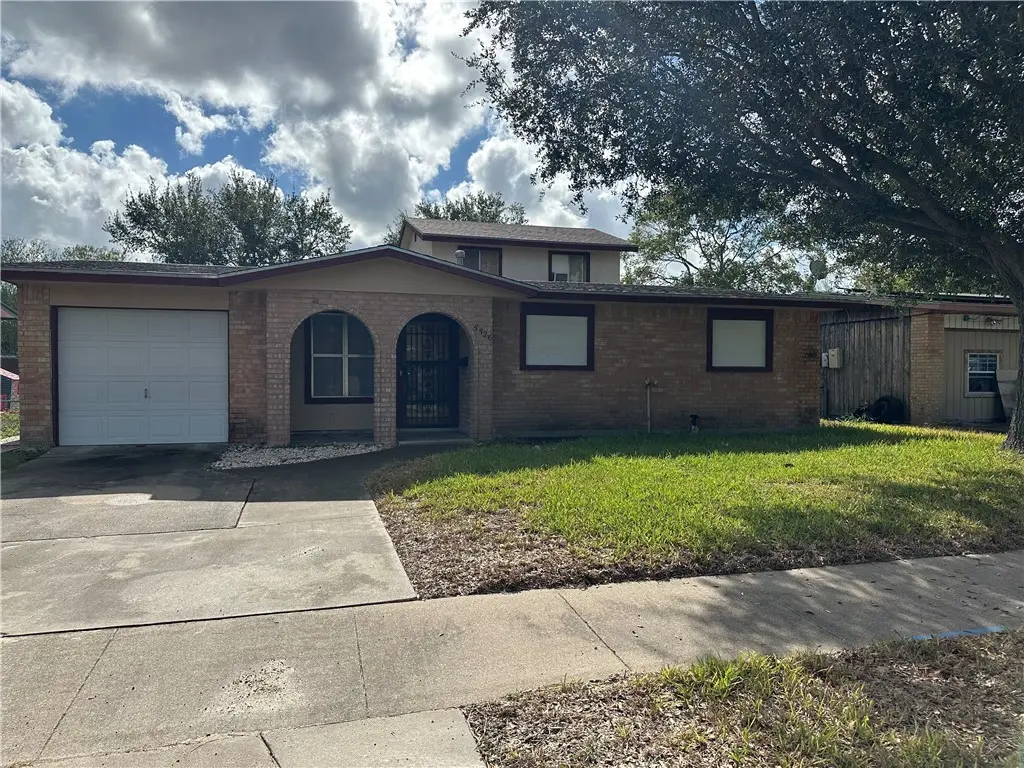
5326 Alejandro St · Corpus Christi, TX
Flood risk 1/10 · Minimal
- FEMA flood zone
- X (unshaded)
- Chance of flooding over 30 yrs
- 0.0%
- Est. flood insurance / yr
- $507 – $1,088
Fire risk 1/10 · Minimal
- Est. fire insurance / yr
- $1,222 – $2,270
Heat risk 10/10 · Severe
- Hot days now (above 107°F)
- 7 days/yr
- Hot days in 30 yrs
- 25 days/yr
Wind risk 9/10 · Severe
- Chance of severe wind over 30 yrs
- 99.0%
Air-quality risk 1/10 · Minimal
- Unhealthy air days now
- 0 days/yr
- Unhealthy air days in 30 yrs
- 0 days/yr
Risk factors via First Street. Map © Google.
Why this score? — see what drove the C- grade
The composite is a weighted blend of 9 inputs, each scored 0–100. Each bar is that input's sub-score; the figure is the points it added to the 100-point composite (weight × sub-score).
- Cash flow +17.2/30.0
- ARV discount +12.5/15.0
- DSCR +5.4/10.0
- 1% rule +5.2/10.0
- Livability +3.9/5.0
- Rent growth +3.1/5.0
- Schools +2.8/10.0
- Condition / age +2.5/5.0
- Appreciation +0.0/10.0
$178,000
🖨 Deal sheet (PDF) 📄 Offer letter ✓ Due diligence
Listing remarks
What a fabulous home! Step into this aimless charm with an inviting 4 bedroom, 2.5 bathroom, 2 car garage home that offers warmth, personality and plenty of space to make your own. Two living areas and one with a nice fireplace and wet bar area for entertaining. The upstairs bedroom is very very large with it's own bathroom. Priced to sell, this is a wonderful opportunity to own a home with charm, space and value all in one package! Reach out to your favorite realtor and go check it out!
Key facts
- 7,296 sq ft lot
- Garage
- Built 1970
Property features AI
Exterior
- Parking: Garage (1 car)
- Utilities: Public water; Public sewer; Sewer available; Water available
- Home design: Two-story; Slab foundation; Brick construction; Shingle roof
- Construction: Built with brick
- Exterior features: Storage; Chain link fencing; Interior lot
Interior
- Kitchen: Free-standing range; Gas cooktop; Microwave
- Flooring: Carpet; Tile
- Bathrooms: Two full bathrooms; One half bathroom
- Heating & cooling: Central heating; Electric heating; Window unit heating; Central air conditioning; Window unit air conditioning
- Interior features: Skylights; Wet bar
- Laundry & utility: Washer hookup; Dryer hookup
Neighborhood map
What this means for you Summary
Snapshot
- This is a 4-bed/2.5-bath single-family listed at $178k.
Deal economics
- At list price, monthly cash flow is $127 ($2k/yr) — positive.
- The deal already cash-flows at list — no discount required.
- Meets the 1% rule at list price ($2k rent vs $178k).
- Recommended offer: $175k (1.5% below list) — sets the bar for market timing.
- Cap rate 7.1% vs local median 3.6% in Corpus Christi — top-decile yield for the area; either an underpriced asset or a hidden risk that comps aren't pricing in. Stress-test before assuming the spread holds.
Location & tenants
- Location reads 78/100 on livability (#66 in TX, #2,404 nationally) — a middle-class / working-renter tenant base. Strengths: commute A+, cost of living A+, housing A+; Watch: crime F.
- Corpus Christi ISD (urban): math 31% / reading 35% proficiency, ranked #562 of 826 in TX (top 68%) — families likely to look elsewhere, expect single-tenant / working-renter base with shorter leases; 63% free/reduced lunch — lower-income household profile, screen leases tightly.
- Zoned schools: Windsor Park G/T (math 85% / reading 90%, grade A+, #6 of 4,322 statewide, top 0%, 609 students, 29% FRL); Adkins Middle (math 40% / reading 39%, grade F, #660 of 1,662 statewide, top 41%, 956 students, 48% FRL); Carroll H S (math 33% / reading 29%, grade F, #1,077 of 1,632 statewide, top 66%, 1,851 students, 68% FRL).
- Zoned-school proficiency averages 53% at this address vs 33% district-wide (+20 pts) — the actual schools serving this property are materially stronger than the Corpus Christi ISD average implies; a family-tenant draw the district grade alone would hide.
- Market conditions: Rents rising (+2.3%/yr); 434 active listings in the ZIP; 12 comparable units currently listed for rent nearby; rentals lingering (median 46d on market — plan ~5-8 weeks vacancy on turnover, expect pricing pressure); 58% of comp listings sitting > 30 days — soft ceiling on asking rent; 1,397 units permitted in Nueces County in 2024 (47 in 5+ unit buildings).
- This rent runs 39% of the median local income ($55k/yr) — at the standard rent-burdened threshold; future hikes will face affordability resistance.
Forward outlook
- Local home prices are declining (-3.0%/yr); year-one equity from $1k of loan paydown is wiped out by about $5k of value loss. Plan a longer hold.
- Nueces County population projected at +36% by 2050 — long-run rental-demand tailwind backs the buy-and-hold thesis.
Negotiation context
- It's been on market 16 days — a 2% lower offer ($175k) is reasonable based on typical stale-listing flexibility.
- 2 sale attempts with the ask held roughly flat each time — persistent listings suggest the price (not the market) is what's stuck; bring a comps-based counter.
Risks & watch-outs
- Climate carrying-cost: severe wind risk, 99% chance of damaging wind over 30y; extreme-heat days projected 7→25/yr by 2055 (HVAC capex compounding) — expect insurance premiums to compound above CPI over the hold.
Questions for the listing agent
- Built in 1970 — when were the roof, HVAC, electrical panel, plumbing, and water heater last replaced?
- Is there a deadline driving the sale (1031 exchange, divorce, estate, relocation)? That informs how much negotiation room exists.
- Crime grade is F in this area — have there been break-ins, vandalism, or insurance claims at this property in the last 3 years? What carrier currently insures it and at what premium?
- What's the average days-on-market for RENTAL listings here right now (not sales)? A rising rental-DOM trend means longer vacancies and softer asking-rent achievability than the comps imply.
- What's the recent tenant-quality profile in this submarket — average credit score on applications, eviction rate, late-payment / NSF rate, and stable-employment percentage? A property-management company in the area should have these aggregated.
- How much new for-sale + rental construction is in the pipeline within 1–3 miles? Heavy new supply typically softens prices + rents 12–24 months out; constrained supply supports both.
Investment metrics
- 1% rule
- 1.02% ✓
- Cap rate
- 7.15%
- Cash-on-cash
- 3.05%
- DSCR
- 1.14
- GRM
- 8.2
CMA / ARV
- ARV (median comp)
- $200,213
- List price
- $178,000
- Delta
- -5.15%
- Verdict
- FAIR
- Comps
- 20 within 1.0 mi
Show comp detail 12 sales within ~0.75 mi
| Address | Dist | Beds/Ba | Sqft | Sold | Price | $/sf | Match |
|---|---|---|---|---|---|---|---|
| 5338 Alejandro St | 0.03mi | 4/2.0 | 1,591 (-7%) | 8mo | $120,000 | $75 | 78 |
| 5320 Hitching Post | 0.51mi | 4/3.0 | 1,723 (+0%) | 4mo | $211,000 | $122 | 70 |
| 5206 Larcade Dr | 0.20mi | 5/2.0 (+1) | 1,776 (+4%) | 12mo | $184,900 | $104 | 67 |
| 2737 Milo St | 0.18mi | 4/2.0 | 1,561 (-9%) | 12mo | $259,900 | $166 | 64 |
| 5809 Crest Cir | 0.71mi | 3/2.0 (-1) | 1,691 (-1%) | 3mo | $240,000 | $142 | 55 |
| 5217 Bonham St | 0.27mi | 3/2.0 (-1) | 1,495 (-13%) | 11mo | $229,900 | $154 | 50 |
| 2910 Water Lily Dr | 0.68mi | 4/2.0 | 1,552 (-10%) | 10mo | $100,000 | $64 | 42 |
| 3141 Sylvan Crest Dr | 0.66mi | 3/2.5 (-1) | 1,496 (-13%) | 3mo | $225,000 | $150 | 41 |
| 4910 Hakel Dr | 0.75mi | 3/2.0 (-1) | 1,748 (+2%) | 17mo | $229,000 | $131 | 41 |
| 2918 River Bend Ct | 0.73mi | 3/2.0 (-1) | 1,498 (-13%) | 3mo | $235,000 | $157 | 35 |
| 4946 Blundell Dr | 0.63mi | 3/2.0 (-1) | 1,520 (-11%) | 15mo | $125,000 | $82 | 32 |
| 4821 Nesbitt Dr | 0.65mi | 3/1.5 (-1) | 1,562 (-9%) | 18mo | $184,900 | $118 | 30 |
Match score weights: distance 35% · size 25% · config 20% · recency 20%. Top-matched comps best support the ARV.
Projected returns pro-forma
-3.0% appreciation · 2.32% rent growth · sell at horizon
- IRR
- -12.3%
- Equity multiple
- 0.56×
- Total profit
- $-21,936
- Equity at exit
- $26,540
- IRR
- -4.2%
- Equity multiple
- 0.73×
- Total profit
- $-13,401
- Equity at exit
- $15,390
Cash invested: $49,840 (down + closing). Projections, not guarantees.
Landlord ↔ Tenant lean methodology
- Overall (STATE)
- 87 Strongly Landlord-Friendly
- State Texas
- 87 Strongly Landlord-Friendly · R+5
- County
- — inherits STATE
- City
- — inherits STATE
ZIP-level market 78415
- Rents YoY
- 2.3%
- Active inventory
- 434
- Price-to-rent
- 8.2×
Monthly cashflow live
- Estimated rent
- $1,809 high interval (Pro) →
- Mortgage (P&I)
- −$933
- Tax from tax record
- −$294 /mo · $3,534/yr
- Insurance
- −$74
- HOA
- −$0
- Vacancy / Maint / Mgmt
- −$380
- Net cashflow
- $127
Break-even live
Sensitivity live
| Price | -10% $227 | -5% $177 | +0% $127 | +5% $76 | +10% $26 |
|---|---|---|---|---|---|
| Rent | -10% $-16 | -5% $55 | +0% $127 | +5% $198 | +10% $270 |
| Rate | -1.0pp $216 | -0.5pp $172 | base $127 | +0.5pp $81 | +1.0pp $34 |
UW: 25.0% down · 7.5% · 30yr · 1.5% tax · 5.0% vac · 8.0% maint · 8.0% mgmt
Financing live
Cash to close
- Down payment
- $44,500
- Closing costs
- $5,340
- Reserves months
- —
- Total cash needed
- —
Loan-product check · same deal, 3 products live
Conventional
25% down · 7.5% · 30yr
- Down + closing
- —
- Monthly P&I
- —
- Monthly cashflow
- —
- DSCR
- —
- Eligible?
- —
Personal DTI + credit; lowest rate.
DSCR
20% down · 8.5% · 30yr
- Down + closing
- —
- Monthly P&I
- —
- Monthly cashflow
- —
- DSCR
- —
- Eligible?
- —
No personal income docs; deal must DSCR.
Hard money
10% down · 12.0% · 12mo
- Down + closing
- —
- Monthly P&I
- —
- Monthly cashflow
- —
- DSCR
- —
- Eligible?
- —
Short-term bridge; refi at stabilization.
Rent comps 12 comps
| Address | Beds | Baths | Sqft | Rent | $/sqft | DOM | Units | Dist |
|---|---|---|---|---|---|---|---|---|
| 2709 Milo St Corpus Christi, TX | 3.0 | 2.0 | 1122 | $1,700 | $1.52 | 15d | 1 | 0.27mi |
| 5541 Candace St Corpus Christi, TX | 3.0 | 2.0 | 1484 | $1,795 | $1.21 | 15d | 1 | 0.34mi |
| 3102 Crestwater Dr Corpus Christi, TX | 3.0 | 2.0 | 1173 | $1,550 | $1.32 | 46d | 1 | 0.65mi |
| 5902 Ayers St Corpus Christi, TX | 3.0 | 2.0 | 1152 | $1,349 | $1.17 | 46d | 1 | 0.79mi |
| 6013 Beardmore Dr Corpus Christi, TX | 3.0 | 2.0 | 1104 | $1,700 | $1.54 | 23d | 1 | 0.90mi |
| 2509 Persimmon St Corpus Christi, TX | 3.0 | 2.0 | 1295 | $1,550 | $1.20 | 46d | 1 | 0.97mi |
| 2510 Cresterrace Dr Corpus Christi, TX | 3.0 | 2.0 | 1300 | $1,495 | $1.15 | 46d | 1 | 1.05mi |
| 4845 Concord St Corpus Christi, TX | 4.0 | 2.0 | 1437 | $1,750 | $1.22 | 15d | 1 | 1.21mi |
| 4241 Green Grove Dr Corpus Christi, TX | 3.0 | 2.0 | 1345 | $1,700 | $1.26 | 46d | 1 | 1.33mi |
| 3738 Marion St Corpus Christi, TX | 3.0 | 1.0 | 1100 | $1,295 | $1.18 | 46d | 1 | 1.38mi |
| 4006 Panama Dr Corpus Christi, TX | 3.0 | 2.0 | 1816 | $1,949 | $1.07 | 23d | 1 | 1.41mi |
| 4013 Kingston Dr Corpus Christi, TX | 3.0 | 2.0 | 1451 | $2,500 | $1.72 | 46d | 1 | 1.44mi |
Listing history 17 events
-
2026-06-21days on market $178,000 Active 16 DOM
-
2026-06-18days on market $178,000 Active 13 DOM
-
2026-06-17days on market $178,000 Active 12 DOM
-
2026-06-16days on market $178,000 Active 11 DOM
-
2026-06-15days on market $178,000 Active 10 DOM
-
2026-06-14days on market $178,000 Active 8 DOM
-
2026-06-10days on market $178,000 Active 5 DOM
-
2026-06-09days on market $178,000 Active 4 DOM
-
2026-06-08days on market $178,000 Active 3 DOM
-
2026-06-07remarks 493-char remark
-
2026-06-07pricedays on market $178,000 Active 2 DOM
-
2026-05-31days on market $189,900 Active 237 DOM
-
2026-05-30days on market $189,900 Active 236 DOM
-
2026-05-09price $189,900 454-char remark
-
2026-01-16price $204,900 454-char remark
-
2025-11-18price $218,000 454-char remark
-
2025-10-06$224,900 Active 454-char remark
ⓘ Source: listings_history table (triggers on properties + properties_extension) + one-shot
backfill from property_details.listing_events for pre-trigger history.
Tax reassessment forecast TX · Resets to sale price
- Current annual tax
- $3,534 · $294/mo
- Projected year-2 tax
- $3,534 · $294/mo
- Expected delta
- $0/yr ($0/mo · 0.0%)
ⓘ Screening estimate from a state-policy table — verify with the county assessor before closing.
Climate risk First Street
- Flood 1/10 Low FEMA zone X (unshaded) · 0% chance over 30 yrs
- Wildfire 1/10 Low
- Heat 10/10 Extreme 7 d/yr ≥107°F today · 25 d/yr by 30 yrs out
- Wind 9/10 Extreme 99% chance of damaging wind over 30 yrs
- Air quality 1/10 Low 0 unhealthy d/yr today · 0 by 30 yrs out
Nearby sold comps map
Loading sold comps map…
Walkable amenities ~0.75 mi
Loading nearby amenities…
Taxation est. · year 1
- Rental income
- $21,702
- − Mortgage interest
- −$9,971
- − Property taxes
- −$3,534
- − Insurance
- −$890
- − Repairs & maintenance
- −$1,736
- − Management
- −$1,736
- − Depreciation
- −$5,178
- Taxable loss
- −$1,343
- Est. tax savings @ 24.0%
- +$322
- After-tax cash flow
- $1,842/yr
For passive investors: Depreciation is non-cash, so a rental often shows a tax loss while cash-flowing — sheltering income. Rental losses are passive: they offset passive income freely, and up to $25,000/yr can offset ordinary (W-2) income if you actively participate and your MAGI is under $100k (phasing out to $0 by $150k); unused losses carry forward. On sale, claimed depreciation is recaptured at up to 25%, and gains may owe capital-gains tax (a 1031 exchange can defer both). Figures are a year-1 estimate at your 24.0% rate — not tax advice; consult a CPA.
Schools (NCES district)
- District
- Corpus Christi ISD
- NCES district ID
- 4815270
- Math proficiency
- 31% ▼ -18.00%
- Reading proficiency
- 35% ▼ -7.00%
- Median HH income
- $45,672
- Composite
- 28.27/100
- National rank
- #6793
- State rank
- #562 of 826 in TX
Livability — Corpus Christi
- Score
- 78/100
- State rank
- #66
- US rank
- #2404
Category grades
Schools grade is shown separately in the Schools card above.
Census & demographics
- Census place
- Corpus Christi, TX
- County
- Nueces County · 296,836 people
- City population
- 296,836
- Metro
- Corpus Christi, TX
- Population (ZIP)
- 43,080
- Household income
- $54,990
- Rent vs Own
- Severe rent burden
- 1730.0
Population outlook (Nueces County) Hauer SSP2
- Today (2025)
- 418,037 people
- By 2030
- 447,123 · +7.0%
- By 2040
- 505,911 · +21.0%
- By 2050
- 567,522 · +35.8%
- By 2075
- 729,686 · +74.6%
- By 2100
- 847,087 · +102.6%
Race, ethnicity, and origin ACS 2023
- Neighborhood character
- Predominantly Hispanic (83%)
- Race & ethnicity
- Hispanic / Latino 83% Two or more races 41% White 12% Black 3%
- Hispanic origin (detail)
- Mexican 75%
- Foreign-born
- 9% · Canada
- Languages at home
- 59% English-only · Spanish 40%
Political lean MEDSL · Nueces
- 2024 margin
- R (+11.5) · D 43.8% · R 55.3%
- 2008→2024 swing
- -7.1pp toward R · 2008: -4.4pp · 2024: -11.5pp
- All cycles
- 2024: R+11.5 2020: R+2.9 2016: R+1.5 2012: R+3.2 2008: R+4.4
Not yet ingested
- Civics
- —
Market trends
- HPI YoY
- ▼ -173.20%
- Current HPI
- 158.011
- Rent YoY
- ▲ 2.32%
- Metro
- Corpus Christi, TX
- State GDP YoY
- ▲ 3.95%
- F500 in state
- 110
Industry mix (Fortune 500 HQ in TX)
| Industry | F500 HQs | Revenue |
|---|---|---|
| Energy | 16 | $1,198B |
|
||
| Technology | 5 | $198B |
|
||
| Engineering / Construction | 4 | $72B |
|
||
| Energy Services | 3 | $60B |
|
||
| Utilities | 3 | $41B |
|
||
| Healthcare | 2 | $330B |
|
||
Price history
-20.9% since first listed6 events — show timeline
- 2026-06-03 Listed $178,000 CBMLS
- 2026-06-01 Delisted — CBMLS
- 2026-05-09 Price Changed $189,900 CBMLS
- 2026-01-16 Price Changed $204,900 CBMLS
- 2025-11-18 Price Changed $218,000 CBMLS
- 2025-10-06 Listed $224,900 CBMLS
Property tax history
+3.4%/yrLatest (2025): $3,534 · +12.0% YoY. Source: county tax records.
Cash-flow waterfall
monthlySold comps — $/sqft
last 12 mo · ≤1 miLoading sold comps…