 Duplex
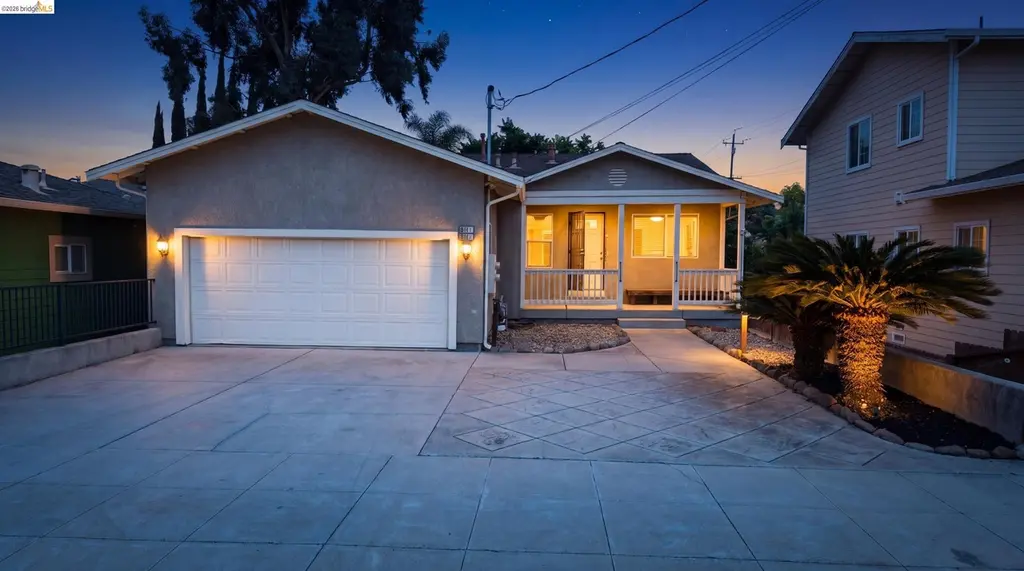
811 G St · Antioch, CA
Flood risk 5/10 · Moderate
- FEMA flood zone
- X (unshaded)
- Chance of flooding over 30 yrs
- 0.24%
- Est. flood insurance / yr
- $473 – $860
Fire risk 5/10 · Moderate
- Est. fire insurance / yr
- $659 – $1,223
Heat risk 6/10 · Moderate
- Hot days now (above 100°F)
- 7 days/yr
- Hot days in 30 yrs
- 14 days/yr
Wind risk 1/10 · Minimal
- Chance of severe wind over 30 yrs
- —
Air-quality risk 9/10 · Severe
- Unhealthy air days now
- 16 days/yr
- Unhealthy air days in 30 yrs
- 19 days/yr
Risk factors via First Street. Map © Google.
Why this score? — see what drove the C- grade
The composite is a weighted blend of 9 inputs, each scored 0–100. Each bar is that input's sub-score; the figure is the points it added to the 100-point composite (weight × sub-score).
- Cash flow +18.2/30.0
- ARV discount +15.0/15.0
- DSCR +5.7/10.0
- 1% rule +4.1/10.0
- Schools +3.8/10.0
- Rent growth +2.8/5.0
- Livability +2.8/5.0
- Condition / age +2.5/5.0
- Appreciation +0.0/10.0
$599,000
🖨 Deal sheet 📄 Offer letter ✓ Due diligence
Multi-family units
County records classify this as Multi-Family (2-4 Unit). Listing-text estimate: 2 units. confirmed
Listing remarks
Welcome to 811 G St, Antioch, CA 94509 — a rare and beautifully maintained duplex offering exceptional versatility, modern upgrades, and an unbeatable location. This impressive property features two spacious units designed for both comfort and style. The first-floor residence boasts 4 generously sized bedrooms and 2 full bathrooms, complemented by a brand-new, thoughtfully designed kitchen and a dedicated laundry area—perfect for modern living and effortless entertaining. Lower level, Is the second unit offers a well-appointed 3-bedroom, 1-bath layout complete with its own full kitchen and private laundry, creating an ideal setup for extended family, rental income, or multi-gene
Key facts
- 5,000 sq ft lot
- Garage
- Built 2004
Property features AI
Exterior
- Parking: Attached parking (2 spaces)
- Utilities: Public water; Public sewer
- Home design: Duplex (residential income); Built in 2004
- Construction: Stucco construction
- Exterior features: Back yard
Interior
- Bedrooms: Duplex with 2 total units
- Flooring: Laminate flooring; Carpet flooring
- Heating & cooling: Forced air heating; Central air conditioning
- Interior features: Washer and dryer included; Laminate and carpet floors
- Laundry & utility: Washer; Dryer
Neighborhood map
What this means for you Summary
Snapshot
- This is a 1×4bd/2ba + 1×3bd/1ba units multifamily listed at $599k.
Deal economics
- At list price, monthly cash flow is $533 ($6k/yr) — positive. Per door: $266/mo.
- The deal already cash-flows at list — no discount required.
- To meet the 1% rule (rent ≥ 1% of price), the offer needs to be $548k (8.6% below list).
- Recommended offer: $548k (8.6% below list) — sets the bar for 1% rule.
- Cap rate 7.4% vs local median 3.9% in Antioch — top-decile yield for the area; either an underpriced asset or a hidden risk that comps aren't pricing in. Stress-test before assuming the spread holds.
Location & tenants
- Location reads 56/100 on livability (#782 in CA) — a working-class tenant base; expect higher turnover. Strengths: employment A+, housing A+, health & safety A; Watch: schools F, crime F, amenities F.
- Antioch Unified (suburban): math 29% / reading 55% proficiency, ranked #200 of 517 in CA (top 39%) — families likely to look elsewhere, expect single-tenant / working-renter base with shorter leases.
- Market conditions: Rents rising (+1.1%/yr); 206 active listings in the ZIP; solid renter incomes; 2,169 units permitted in Contra Costa County in 2024 (896 in 5+ unit buildings).
- At $5,476/mo this rent would consume 76% of the median local household income ($86k/yr) (locally 3063% of renters already pay >50% of income on rent) — very limited rent-growth headroom before tenants either downsize or default.
Forward outlook
- Local home prices are declining (-3.0%/yr); year-one equity from $4k of loan paydown is wiped out by about $18k of value loss. Plan a longer hold.
- Contra Costa County population projected at +26% by 2050 — long-run rental-demand tailwind backs the buy-and-hold thesis.
Negotiation context
- Only 9 days on market — expect competitive offers; lowballing is unlikely to land.
- 4 sale attempts since 22y ago with the ask held roughly flat each time — persistent listings suggest the price (not the market) is what's stuck; bring a comps-based counter.
- Current owner paid $258k; list at $599k implies a 132% gain — meaningful room to come down on a strong offer.
Risks & watch-outs
- Climate carrying-cost: moderate flood risk; moderate wildfire risk; extreme-heat days projected 7→14/yr by 2055 (HVAC capex compounding) — expect insurance premiums to compound above CPI over the hold.
Questions for the listing agent
- Can we see the unit-by-unit rent roll, current vacancy, and any below-market leases? What's the average tenancy length?
- What capital expenditures (roof, boiler, parking lot, exteriors) have been made in the last 5 years, and what's planned in the next 2?
- Is there a deadline driving the sale (1031 exchange, divorce, estate, relocation)? That informs how much negotiation room exists.
- Schools are F-rated, which usually means shorter tenancies and higher turnover. Who's the typical renter profile here, and what's been the actual vacancy rate?
- Crime grade is F in this area — have there been break-ins, vandalism, or insurance claims at this property in the last 3 years? What carrier currently insures it and at what premium?
- What's the average days-on-market for RENTAL listings here right now (not sales)? A rising rental-DOM trend means longer vacancies and softer asking-rent achievability than the comps imply.
- What's the recent tenant-quality profile in this submarket — average credit score on applications, eviction rate, late-payment / NSF rate, and stable-employment percentage? A property-management company in the area should have these aggregated.
- How much new apartment / multifamily construction is in the pipeline within 1–3 miles? Heavy new supply (>2% of stock underway) typically softens rents 12–24 months out; light construction supports rent growth.
Investment metrics
- 1% rule
- 0.91% ✗
- Cap rate
- 7.36%
- Cash-on-cash
- 3.81%
- DSCR
- 1.17
- GRM
- 9.1
CMA / ARV
- ARV (median comp)
- $799,178
- List price
- $599,000
- Delta
- -25.05%
- Verdict
- UNDERPRICED
- Comps
- 12 within 1.0 mi
Show comp detail 1 sale within ~0.75 mi
| Address | Dist | Beds/Ba | Sqft | Sold | Price | $/sf | Match |
|---|---|---|---|---|---|---|---|
| 806 W 7th St | 0.18mi | 5/2.5 (-1) | 2,009 (-13%) | 2mo | $540,000 | $269 | 62 |
Match score weights: distance 35% · size 25% · config 20% · recency 20%. Top-matched comps best support the ARV.
Projected returns pro-forma
-3.0% appreciation · 1.09% rent growth · sell at horizon
- IRR
- -12.4%
- Equity multiple
- 0.56×
- Total profit
- $-73,592
- Equity at exit
- $89,313
- IRR
- -6.2%
- Equity multiple
- 0.63×
- Total profit
- $-61,705
- Equity at exit
- $51,791
Cash invested: $167,720 (down + closing). Projections, not guarantees.
Landlord ↔ Tenant lean methodology
- Overall (STATE)
- 18 Strongly Tenant-Friendly
- State California
- 18 Strongly Tenant-Friendly · D+13
- County
- — inherits STATE
- City
- — inherits STATE
ZIP-level market 94509
- Rents YoY
- 1.1%
- Active inventory
- 206
- Price-to-rent
- 16.2×
Monthly cashflow live
- Estimated rent
- $5,476 high interval (Pro) →
- Mortgage (P&I)
- −$3,141
- Tax from tax record
- −$403 /mo · $4,830/yr
- Insurance
- −$250
- HOA
- −$0
- Vacancy / Maint / Mgmt
- −$1,150
- Net cashflow
- $533
Break-even live
2-unit breakdown (identical units grouped — click to expand)
| Units | Beds | Baths | Est. rent |
|---|---|---|---|
| 1× unit | 4 | 2 | $3,075 |
| 1× unit | 3 | 1 | $2,401 |
| Total (2 units) | $5,476 | ||
UW: 25.0% down · 7.5% · 30yr · 1.5% tax · 5.0% vac · 8.0% maint · 8.0% mgmt
Financing live
Cash to close
- Down payment
- $149,750
- Closing costs
- $17,970
- Reserves months
- —
- Total cash needed
- —
Loan-product check · same deal, 3 products live
Conventional
25% down · 7.5% · 30yr
- Down + closing
- —
- Monthly P&I
- —
- Monthly cashflow
- —
- DSCR
- —
- Eligible?
- —
Personal DTI + credit; lowest rate.
DSCR
20% down · 8.5% · 30yr
- Down + closing
- —
- Monthly P&I
- —
- Monthly cashflow
- —
- DSCR
- —
- Eligible?
- —
No personal income docs; deal must DSCR.
Hard money
10% down · 12.0% · 12mo
- Down + closing
- —
- Monthly P&I
- —
- Monthly cashflow
- —
- DSCR
- —
- Eligible?
- —
Short-term bridge; refi at stabilization.
Listing history 16 events
-
2026-05-15status Pending 1405-char remark
-
2026-05-06$599,000 Active 1405-char remark
-
2026-05-04historical $599,000 1405-char remark
-
2026-05-03historical
-
2026-03-08price
-
2026-01-14Active
-
2018-06-08historical
-
2008-10-29soldstatus $258,000 Sold
-
2008-10-23soldstatus $258,000
-
2008-09-15historical
-
2008-08-20$276,000
-
2005-02-17soldstatus $600,000
-
2005-02-17soldstatus $600,000
-
2005-01-13historical
-
2004-12-10$599,000
-
2003-05-29soldstatus $70,000
ⓘ Source: listings_history table (triggers on properties + properties_extension) + one-shot
backfill from property_details.listing_events for pre-trigger history.
Tax reassessment forecast CA · Resets to sale price
- Current annual tax
- $4,830 · $403/mo
- Projected year-2 tax
- $4,830 · $403/mo
- Expected delta
- $0/yr ($0/mo · 0.0%)
ⓘ Screening estimate from a state-policy table — verify with the county assessor before closing.
Climate risk First Street
- Flood 5/10 Major FEMA zone X (unshaded) · 24% chance over 30 yrs
- Wildfire 5/10 Major
- Heat 6/10 Major 7 d/yr ≥100°F today · 14 d/yr by 30 yrs out
- Wind 1/10 Low
- Air quality 9/10 Extreme 16 unhealthy d/yr today · 19 by 30 yrs out
Nearby sold comps map
Loading sold comps map…
Walkable amenities ~0.75 mi
Loading nearby amenities…
Taxation est. · year 1
- Rental income
- $65,712
- − Mortgage interest
- −$33,553
- − Property taxes
- −$4,830
- − Insurance
- −$2,995
- − Repairs & maintenance
- −$5,257
- − Management
- −$5,257
- − Depreciation
- −$17,425
- Taxable loss
- −$3,606
- Est. tax savings @ 24.0%
- +$865
- After-tax cash flow
- $7,258/yr
For passive investors: Depreciation is non-cash, so a rental often shows a tax loss while cash-flowing — sheltering income. Rental losses are passive: they offset passive income freely, and up to $25,000/yr can offset ordinary (W-2) income if you actively participate and your MAGI is under $100k (phasing out to $0 by $150k); unused losses carry forward. On sale, claimed depreciation is recaptured at up to 25%, and gains may owe capital-gains tax (a 1031 exchange can defer both). Figures are a year-1 estimate at your 24.0% rate — not tax advice; consult a CPA.
Schools (NCES district)
- District
- Antioch Unified
- NCES district ID
- 0602850
- Math proficiency
- 29% ▲ 12.00%
- Reading proficiency
- 55% ▲ 25.00%
- Median HH income
- $65,935
- Composite
- 37.57/100
- National rank
- #4386
- State rank
- #200 of 517 in CA
Livability — Antioch
- Score
- 56/100
- State rank
- #782
- US rank
- #22472
Category grades
Schools grade is shown separately in the Schools card above.
Census & demographics
- Census place
- Antioch, CA
- County
- Contra Costa County · 1,059,880 people
- City population
- 116,477
- Metro
- San Francisco-Oakland-Berkeley, CA
- Population (ZIP)
- 70,090
- Household income
- $86,196
- Rent vs Own
- Severe rent burden
- 3063.0
Population outlook (Contra Costa County) Hauer SSP2
- Today (2025)
- 1,287,720 people
- By 2030
- 1,364,937 · +6.0%
- By 2040
- 1,506,209 · +17.0%
- By 2050
- 1,624,373 · +26.1%
- By 2075
- 1,853,193 · +43.9%
- By 2100
- 1,901,231 · +47.6%
Race, ethnicity, and origin ACS 2023
- Neighborhood character
- Highly diverse neighborhood (Simpson 0.72)
- Race & ethnicity
- Hispanic / Latino 43% White 25% Two or more races 18% Black 16% Asian 9% Native American 2% Pacific Islander 2%
- Hispanic origin (detail)
- Mexican 30%
- Common ancestry
- Russian 2% Italian 2% Lithuanian 1%
- Foreign-born
- 23% · Canada, China, Vietnam
- Languages at home
- 62% English-only · Spanish 29% Tagalog/Filipino 3% Other Asian/Pacific 1%
Political lean MEDSL · Contra Costa
- 2024 margin
- Solid D (+38.0) · D 67.3% · R 29.4% · Other 3.3%
- 2008→2024 swing
- +0.2pp no change · 2008: 37.8pp · 2024: 38.0pp
- All cycles
- 2024: D+38.0 2020: D+45.3 2016: D+43.5 2012: D+33.7 2008: D+37.8
Not yet ingested
- Civics
- —
Market trends
- HPI YoY
- ▼ -477.30%
- Current HPI
- 309.3499
- Rent YoY
- ▲ 1.09%
- Metro
- San Francisco-Oakland-Berkeley, CA
- State GDP YoY
- ▲ 3.21%
- F500 in state
- 116
Industry mix (Fortune 500 HQ in CA)
| Industry | F500 HQs | Revenue |
|---|---|---|
| Technology | 27 | $1,492B |
|
||
| Financial Services | 3 | $174B |
|
||
| Retail | 3 | $44B |
|
||
| Insurance | 3 | $26B |
|
||
| Media / Entertainment | 2 | $115B |
|
||
| Pharmaceuticals / Biotech | 2 | $62B |
|
||
Price history
+755.7% since first listed16 events — show timeline
- 2026-05-15 Pending — bridgeMLS, Bay East AOR, or Contra Costa AOR
- 2026-05-06 Listed $599,000 bridgeMLS, Bay East AOR, or Contra Costa AOR
- 2026-05-04 Coming Soon $599,000 bridgeMLS, Bay East AOR, or Contra Costa AOR
- 2026-05-03 Listing Removed — bridgeMLS, Bay East AOR, or Contra Costa AOR
- 2026-03-08 Price Changed — bridgeMLS, Bay East AOR, or Contra Costa AOR
- 2026-01-14 Listed — bridgeMLS, Bay East AOR, or Contra Costa AOR
- 2018-06-08 Listing Removed — bridgeMLS, Bay East AOR, or Contra Costa AOR
- 2008-10-29 Sold (MLS) $258,000 bridgeMLS, Bay East AOR, or Contra Costa AOR
- 2008-10-23 Sold (Public Records) $258,000 Public Records
- 2008-09-15 Listing Removed — bridgeMLS, Bay East AOR, or Contra Costa AOR
- 2008-08-20 Listed $276,000 bridgeMLS, Bay East AOR, or Contra Costa AOR
- 2005-02-17 Sold (Public Records) $600,000 Public Records
- 2005-02-17 Sold (MLS) $600,000 bridgeMLS, Bay East AOR, or Contra Costa AOR
- 2005-01-13 Listing Removed — bridgeMLS, Bay East AOR, or Contra Costa AOR
- 2004-12-10 Listed $599,000 bridgeMLS, Bay East AOR, or Contra Costa AOR
- 2003-05-29 Sold (Public Records) $70,000 Public Records
Property tax history
-2.2%/yrLatest (2025): $4,830 · +3.2% YoY. Source: county tax records.
Cash-flow waterfall
monthlySold comps — $/sqft
last 12 mo · ≤1 miLoading sold comps…