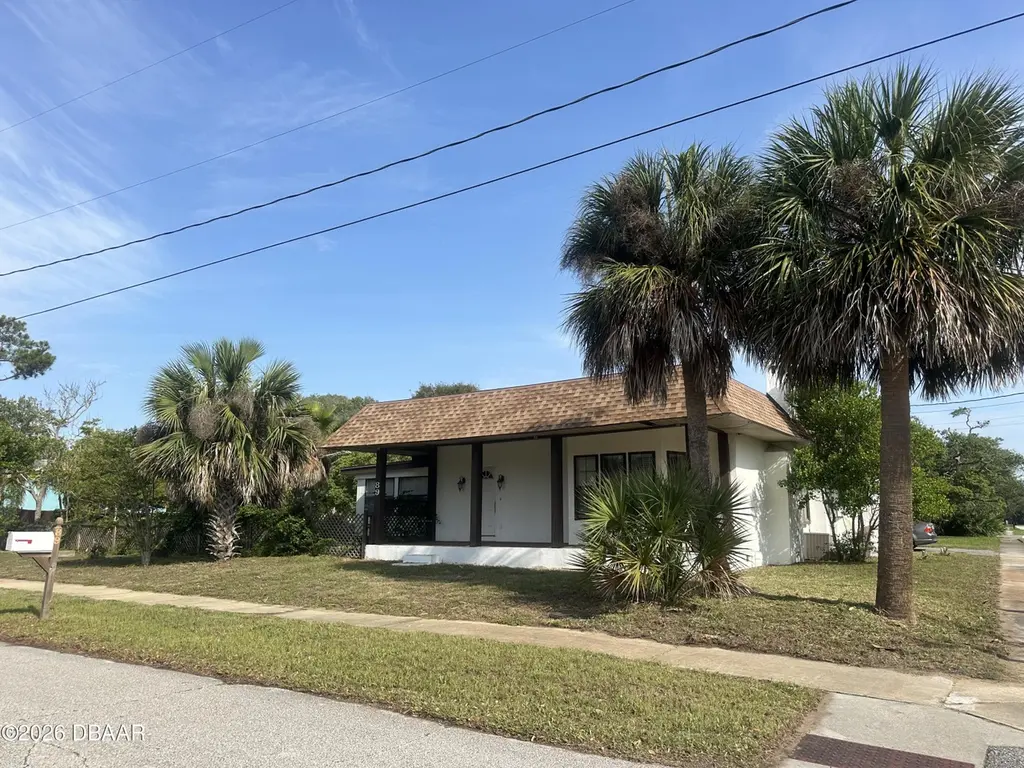
89 Ormond Shores Dr · Ormond Beach, FL
Flood risk 4/10 · Minor
- FEMA flood zone
- X (unshaded)
- Chance of flooding over 30 yrs
- 0.13%
- Est. flood insurance / yr
- $507 – $1,088
Fire risk 1/10 · Minimal
- Est. fire insurance / yr
- $947 – $1,759
Heat risk 10/10 · Severe
- Hot days now (above 104°F)
- 7 days/yr
- Hot days in 30 yrs
- 20 days/yr
Wind risk 10/10 · Severe
- Chance of severe wind over 30 yrs
- 99.0%
Air-quality risk 2/10 · Minimal
- Unhealthy air days now
- 1 days/yr
- Unhealthy air days in 30 yrs
- 2 days/yr
Risk factors via First Street. Map © Google.
Why this score? — see what drove the D grade
The composite is a weighted blend of 9 inputs, each scored 0–100. Each bar is that input's sub-score; the figure is the points it added to the 100-point composite (weight × sub-score).
- Cash flow +13.3/30.0
- ARV discount +7.5/15.0
- Livability +4.2/5.0
- DSCR +4.0/10.0
- Schools +3.9/10.0
- Rent growth +3.8/5.0
- 1% rule +3.1/10.0
- Condition / age +2.5/5.0
- Appreciation +0.0/10.0
$300,000
🖨 Deal sheet (PDF) 📄 Offer letter ✓ Due diligence
Listing remarks MLS
New Roof March 2019. Spacious 2/2 with pool and fireplace on beach-side. Private driveway near detached structure with power, which could be easily converted into a mother-in-law suite. Well maintained vintage charm on 12,500 sq ft lot with huge back yard. Outdoor deck & shower with two lanai, in peaceful Ormond Beach Park. All information recorded in the MLS is intended to be accurate but cannot be guaranteed.
Key facts
- Enclosed sunroom
- Beachside pool home
- Cozy fireplace
Tags
Property features AI
Finance
- Other: Pets allowed: cats and dogs
Exterior
- Parking: Additional parking
- Utilities: Cable available; Electricity connected; Water available; Sewer available; Public sewer; Water sources: private, public, and well
- Home design: Single family residence; One story; Property is attached
- Construction: Block foundation; Block, frame and stucco construction
- Exterior features: Covered porch; Wood fencing; In-ground pool; In-ground spa; Corner lot; Asphalt road frontage on a public maintained city street
Interior
- Kitchen: Tankless water heater
- Flooring: Hardwood; Wood; Other
- Bathrooms: Two full bathrooms
- Heating & cooling: Central heating; Central air; Ceiling fans
- Interior features: Built-in features; Ceiling fans; Entrance foyer; Wood-burning fireplace
- Laundry & utility: Washer hookup; Electric dryer hookup
Neighborhood map
What this means for you Summary
Snapshot
- This is a 2-bed/2.0-bath single-family listed at $300k.
Deal economics
- At list price, monthly cash flow is $3 ($32/yr) — positive.
- The deal already cash-flows at list — no discount required.
- To meet the 1% rule (rent ≥ 1% of price), the offer needs to be $244k (18.8% below list).
- Recommended offer: $244k (18.8% below list) — sets the bar for 1% rule.
- Cap rate 6.3% vs local median 3.8% in Ormond Beach — top-decile yield for the area; either an underpriced asset or a hidden risk that comps aren't pricing in. Stress-test before assuming the spread holds.
Location & tenants
- Location reads 83/100 on livability (#55 in FL, #965 nationally) — a professional / high-income tenant draw. Strengths: amenities A+, housing A+, health & safety A+; Watch: commute F.
- Volusia (suburban): math 44% / reading 49% proficiency, ranked #47 of 73 in FL (top 64%) — families likely to look elsewhere, expect single-tenant / working-renter base with shorter leases.
- Zoned schools: Beachside Elementary School (math 57% / reading 52%, grade C, #892 of 2,144 statewide, top 44%, 556 students, 66% FRL); Ormond Beach Middle School (math 57% / reading 55%, grade B-, #175 of 571 statewide, top 31%, 990 students, 48% FRL); Seabreeze High School (math 31% / reading 56%, grade F, #248 of 667 statewide, top 38%, 1,654 students, 41% FRL) — zoned schools at 52% FRL track the district average.
- Market conditions: Rents rising fast (+5.2%/yr); 411 active listings in the ZIP; 19 comparable units currently listed for rent nearby; rentals at typical pace (median 26d on market — plan ~3-4 weeks tenant-placement turnaround); solid renter incomes; 3,402 units permitted in Volusia County in 2024 (681 in 5+ unit buildings).
- This rent runs 37% of the median local income ($78k/yr) — at the standard rent-burdened threshold; future hikes will face affordability resistance.
Forward outlook
- Local home prices are declining (-3.0%/yr); year-one equity from $2k of loan paydown is wiped out by about $9k of value loss. Plan a longer hold.
- Volusia County population projected at +19% by 2050 — long-run rental-demand tailwind backs the buy-and-hold thesis.
Negotiation context
- It's been on market 16 days — a 2% lower offer ($296k) is reasonable based on typical stale-listing flexibility.
- 5 sale attempts since 18y ago; this cycle's ask has dropped $25k (8%) from the opening price — seller is motivated, your offer sets the floor, not the list.
- Current owner paid $236k; 27% above their basis — modest negotiation headroom, anchor on the comps not their cost.
Risks & watch-outs
- Watch-outs: built in 1927 — expect roof / HVAC / electrical / plumbing capex.
- Climate carrying-cost: severe wind risk, 99% chance of damaging wind over 30y; extreme-heat days projected 7→20/yr by 2055 (HVAC capex compounding) — expect insurance premiums to compound above CPI over the hold.
Questions for the listing agent
- Built in 1927 — when were the roof, HVAC, electrical panel, plumbing, and water heater last replaced?
- Is there a deadline driving the sale (1031 exchange, divorce, estate, relocation)? That informs how much negotiation room exists.
- Schools are B-rated — typically a magnet for longer-tenancy family renters. What's the average tenant stay here, and is there a school-zone premium baked into asking?
- The area grade is low — what's the realistic commute time and amenity access for the typical tenant pool here? Any planned neighborhood developments (good or bad) we should know about?
- What's the average days-on-market for RENTAL listings here right now (not sales)? A rising rental-DOM trend means longer vacancies and softer asking-rent achievability than the comps imply.
- What's the recent tenant-quality profile in this submarket — average credit score on applications, eviction rate, late-payment / NSF rate, and stable-employment percentage? A property-management company in the area should have these aggregated.
- How much new for-sale + rental construction is in the pipeline within 1–3 miles? Heavy new supply typically softens prices + rents 12–24 months out; constrained supply supports both.
Investment metrics
- 1% rule
- 0.81% ✗
- Cap rate
- 6.30%
- Cash-on-cash
- 0.04%
- DSCR
- 1.00
- GRM
- 10.3
CMA / ARV
No comps found within radius.
Projected returns pro-forma
-3.0% appreciation · 5.22% rent growth · sell at horizon
- IRR
- -14.0%
- Equity multiple
- 0.49×
- Total profit
- $-42,932
- Equity at exit
- $44,731
- IRR
- -2.2%
- Equity multiple
- 0.84×
- Total profit
- $-13,494
- Equity at exit
- $25,939
Cash invested: $84,000 (down + closing). Projections, not guarantees.
Landlord ↔ Tenant lean methodology
- Overall (STATE)
- 87 Strongly Landlord-Friendly
- State Florida
- 87 Strongly Landlord-Friendly · R+3
- County
- — inherits STATE
- City
- — inherits STATE
ZIP-level market 32176
- Rents YoY
- 5.2%
- Active inventory
- 411
- Price-to-rent
- 10.3×
Monthly cashflow live
- Estimated rent
- $2,437 high interval (Pro) →
- Mortgage (P&I)
- −$1,573
- Tax from tax record
- −$224 /mo · $2,694/yr
- Insurance
- −$125
- HOA
- −$0
- Vacancy / Maint / Mgmt
- −$512
- Net cashflow
- $3
Break-even live
Sensitivity live
| Price | -10% $173 | -5% $88 | +0% $3 | +5% $-82 | +10% $-167 |
|---|---|---|---|---|---|
| Rent | -10% $-190 | -5% $-94 | +0% $3 | +5% $99 | +10% $195 |
| Rate | -1.0pp $154 | -0.5pp $79 | base $3 | +0.5pp $-75 | +1.0pp $-154 |
UW: 25.0% down · 7.5% · 30yr · 1.5% tax · 5.0% vac · 8.0% maint · 8.0% mgmt
Financing live
Cash to close
- Down payment
- $75,000
- Closing costs
- $9,000
- Reserves months
- —
- Total cash needed
- —
Loan-product check · same deal, 3 products live
Conventional
25% down · 7.5% · 30yr
- Down + closing
- —
- Monthly P&I
- —
- Monthly cashflow
- —
- DSCR
- —
- Eligible?
- —
Personal DTI + credit; lowest rate.
DSCR
20% down · 8.5% · 30yr
- Down + closing
- —
- Monthly P&I
- —
- Monthly cashflow
- —
- DSCR
- —
- Eligible?
- —
No personal income docs; deal must DSCR.
Hard money
10% down · 12.0% · 12mo
- Down + closing
- —
- Monthly P&I
- —
- Monthly cashflow
- —
- DSCR
- —
- Eligible?
- —
Short-term bridge; refi at stabilization.
Rent comps 19 comps
| Address | Beds | Baths | Sqft | Rent | $/sqft | DOM | Units | Dist |
|---|---|---|---|---|---|---|---|---|
| 462 Magnolia St Ormond Beach, FL | 3.0 | 2.0 | 1502 | $2,100 | $1.40 | 16d | 1 | 0.20mi |
| 56 Chippingwood Ln Ormond Beach, FL | 2.0 | 2.5 | 1292 | $2,200 | $1.70 | 25d | 1 | 0.23mi |
| 497 Grandview Ave Ormond Beach, FL | 3.0 | 2.0 | 1590 | $2,800 | $1.76 | 25d | 1 | 0.29mi |
| 122 Magnolia Dr Ormond Beach, FL | 3.0 | 2.0 | 1484 | $2,275 | $1.53 | 25d | 1 | 0.45mi |
| 2900 N Atlantic Ave Apt 702 Daytona Beach, FL | 2.0 | 2.0 | 1360 | $3,300 | $2.43 | 23d | 1 | 0.84mi |
| 2900 N Atlantic Ave Unit 703 Daytona Beach, FL | 2.0 | 2.0 | 1274 | $3,150 | $2.47 | 25d | 1 | 0.85mi |
| 2900 N Atlantic Ave #1805 Daytona Beach, FL | 2.0 | 2.0 | 1360 | $3,000 | $2.21 | 25d | 1 | 0.85mi |
| 2900 N Atlantic Ave #1401 Daytona Beach, FL | 2.0 | 2.0 | 1360 | $3,500 | $2.57 | 25d | 1 | 0.85mi |
| 2828 N Atlantic Ave #1601 Daytona Beach, FL | 2.0 | 2.0 | 1295 | $4,350 | $3.36 | 25d | 1 | 0.89mi |
| 2828 N Atlantic Ave #1504 Daytona Beach, FL | 2.0 | 2.0 | 1240 | $2,800 | $2.26 | 13d | 1 | 0.89mi |
| 2828 N Atlantic Ave #1104 Daytona Beach, FL | 2.0 | 2.0 | 1178 | $2,500 | $2.12 | 25d | 1 | 0.89mi |
| 733 Buena Vista Ave Ormond Beach, FL | 3.0 | 2.0 | 1485 | $2,400 | $1.62 | 25d | 1 | 0.92mi |
| 55 Vining Ct Apt 204 Ormond Beach, FL | 2.0 | 1.5 | 930 | $1,450 | $1.56 | 25d | 1 | 0.98mi |
| 2609 N Oleander Ave Unit 17 Daytona Beach, FL | 2.0 | 1.5 | 950 | $1,180 | $1.24 | 16d | 1 | 1.01mi |
| 400 Auburn Dr #3 Daytona Beach, FL | 2.0 | 1.0 | 945 | $1,350 | $1.43 | 25d | 1 | 1.23mi |
| 288 Boylston Ave Daytona Beach, FL | 3.0 | 2.0 | 1320 | $2,200 | $1.67 | 25d | 1 | 1.25mi |
| 81 Tomoka Ave Ormond Beach, FL | 2.0 | 2.5 | 1500 | $1,950 | $1.30 | 25d | 1 | 1.28mi |
| 432 Auburn Dr #204 Daytona Beach, FL | 2.0 | 1.0 | 992 | $1,350 | $1.36 | 25d | 1 | 1.29mi |
| 402 Fleming Ave Ormond Beach, FL | 3.0 | 2.0 | 1495 | $2,560 | $1.71 | 23d | 1 | 1.47mi |
Listing history 13 events
-
2026-06-19status $300,000 Pending 16 DOM
-
2026-06-18days on market $300,000 Active 16 DOM
-
2026-06-17days on market $300,000 Active 15 DOM
-
2026-06-16days on market $300,000 Active 14 DOM
-
2026-06-15days on market $300,000 Active 13 DOM
-
2026-06-14pricedays on market $300,000 Active 11 DOM
-
2026-06-10days on market $325,000 Active 8 DOM
-
2026-06-09days on market $325,000 Active 7 DOM
-
2026-06-08days on market $325,000 Active 6 DOM
-
2026-06-07days on market $325,000 Active 5 DOM
-
2026-06-05days on market $325,000 Active 2 DOM
-
2026-06-03remarks 687-char remark
-
2026-06-03$325,000 Active 1 DOM
ⓘ Source: listings_history table (triggers on properties + properties_extension) + one-shot
backfill from property_details.listing_events for pre-trigger history.
Tax reassessment forecast FL · Resets to sale price
- Current annual tax
- $2,694 · $224/mo
- Projected year-2 tax
- $2,694 · $224/mo
- Expected delta
- $0/yr ($0/mo · 0.0%)
ⓘ Screening estimate from a state-policy table — verify with the county assessor before closing.
Climate risk First Street
- Flood 4/10 Moderate FEMA zone X (unshaded) · 13% chance over 30 yrs
- Wildfire 1/10 Low
- Heat 10/10 Extreme 7 d/yr ≥104°F today · 20 d/yr by 30 yrs out
- Wind 10/10 Extreme 99% chance of damaging wind over 30 yrs
- Air quality 2/10 Low 1 unhealthy d/yr today · 2 by 30 yrs out
Nearby sold comps map
Loading sold comps map…
Walkable amenities ~0.75 mi
Loading nearby amenities…
Taxation est. · year 1
- Rental income
- $29,247
- − Mortgage interest
- −$16,805
- − Property taxes
- −$2,694
- − Insurance
- −$1,500
- − Repairs & maintenance
- −$2,340
- − Management
- −$2,340
- − Depreciation
- −$8,727
- Taxable loss
- −$5,158
- Est. tax savings @ 24.0%
- +$1,238
- After-tax cash flow
- $1,270/yr
For passive investors: Depreciation is non-cash, so a rental often shows a tax loss while cash-flowing — sheltering income. Rental losses are passive: they offset passive income freely, and up to $25,000/yr can offset ordinary (W-2) income if you actively participate and your MAGI is under $100k (phasing out to $0 by $150k); unused losses carry forward. On sale, claimed depreciation is recaptured at up to 25%, and gains may owe capital-gains tax (a 1031 exchange can defer both). Figures are a year-1 estimate at your 24.0% rate — not tax advice; consult a CPA.
Schools (NCES district)
- District
- Volusia
- NCES district ID
- 1201920
- Math proficiency
- 44% ▼ -9.00%
- Reading proficiency
- 49% ▼ -3.00%
- Median HH income
- $42,946
- Composite
- 39.2/100
- National rank
- #4019
- State rank
- #47 of 73 in FL
Livability — Ormond Beach
- Score
- 83/100
- State rank
- #55
- US rank
- #965
Category grades
Schools grade is shown separately in the Schools card above.
Census & demographics
- Census place
- Ormond Beach, FL
- County
- Volusia County · 556,871 people
- City population
- 69,624
- Metro
- Deltona-Daytona Beach-Ormond Beach, FL
- Population (ZIP)
- 14,841
- Household income
- $78,410
- Rent vs Own
- Severe rent burden
- 298.0
Population outlook (Volusia County) Hauer SSP2
- Today (2025)
- 572,749 people
- By 2030
- 598,695 · +4.5%
- By 2040
- 644,880 · +12.6%
- By 2050
- 681,451 · +19.0%
- By 2075
- 759,957 · +32.7%
- By 2100
- 778,902 · +36.0%
Race, ethnicity, and origin ACS 2023
- Neighborhood character
- Predominantly White (88%)
- Race & ethnicity
- White 88% Two or more races 5% Hispanic / Latino 5% Black 2% Asian 2%
- Common ancestry
- Slovak 5% Romanian 4% Lithuanian 3%
- Foreign-born
- 6% · Canada, China
- Languages at home
- 93% English-only · Spanish 2% Other Indo-European 1% Russian/Polish/Slavic 1%
Political lean MEDSL · Volusia
- 2024 margin
- Strong R (+21.8) · D 38.7% · R 60.5%
- 2008→2024 swing
- -27.4pp toward R · 2008: 5.7pp · 2024: -21.8pp
- All cycles
- 2024: R+21.8 2020: R+14.1 2016: R+13.1 2012: R+1.2 2008: D+5.7
Not yet ingested
- Civics
- —
Market trends
- HPI YoY
- ▼ -476.64%
- Current HPI
- 319.6419
- Rent YoY
- ▲ 5.22%
- Metro
- Deltona-Daytona Beach-Ormond Beach, FL
- State GDP YoY
- ▲ 3.28%
- F500 in state
- 36
Industry mix (Fortune 500 HQ in FL)
| Industry | F500 HQs | Revenue |
|---|---|---|
| Industrial Technology | 2 | $29B |
|
||
| Insurance | 2 | $17B |
|
||
| Retail | 1 | $60B |
|
||
| Technology Distribution | 1 | $58B |
|
||
| Homebuilding | 1 | $35B |
|
||
| Technology Manufacturing | 1 | $35B |
|
||
Price history
+712.5% since first listed14 events — show timeline
- 2026-06-02 Listed $325,000 Daytona MLS
- 2019-04-23 Sold (Public Records) $236,500 Public Records
- 2019-04-22 Sold (MLS) $236,500 Daytona MLS
- 2019-04-12 Contingent — Daytona MLS
- 2019-04-10 Listing Removed — Daytona MLS
- 2019-04-10 Listed $239,000 Daytona MLS
- 2019-02-14 Contingent — Daytona MLS
- 2018-08-27 Listed $239,000 Daytona MLS
- 2012-01-23 Sold (MLS) $120,000 Stellar MLS as Distributed by MLS Grid
- 2011-12-12 Listing Removed — Stellar MLS as Distributed by MLS Grid
- 2011-09-01 Listed $130,000 Stellar MLS as Distributed by MLS Grid
- 2009-09-30 Listing Removed — Stellar MLS as Distributed by MLS Grid
- 2008-12-15 Listed $179,300 Stellar MLS as Distributed by MLS Grid
- 1980-03-01 Sold (Public Records) $40,000 Public Records
Property tax history
+3.6%/yrLatest (2025): $2,694 · +4.7% YoY. Source: county tax records.
Cash-flow waterfall
monthlySold comps — $/sqft
last 12 mo · ≤1 miLoading sold comps…