 🏗️ New Construction
MANA "A" Plan · South Highpoint, FL
Flood risk 4/10 · Minor
- FEMA flood zone
- X (unshaded)
- Chance of flooding over 30 yrs
- 0.13%
- Est. flood insurance / yr
- $507 – $1,088
Fire risk 1/10 · Minimal
- Est. fire insurance / yr
- $947 – $1,759
Heat risk 10/10 · Severe
- Hot days now (above 107°F)
- 6 days/yr
- Hot days in 30 yrs
- 20 days/yr
Wind risk 10/10 · Severe
- Chance of severe wind over 30 yrs
- 99.0%
Air-quality risk 3/10 · Minor
- Unhealthy air days now
- 3 days/yr
- Unhealthy air days in 30 yrs
- 3 days/yr
Risk factors via First Street. Map © Google.
Why this score? — see what drove the D grade
The composite is a weighted blend of 9 inputs, each scored 0–100. Each bar is that input's sub-score; the figure is the points it added to the 100-point composite (weight × sub-score).
- Cash flow +15.0/30.0
- ARV discount +7.5/15.0
- 1% rule +5.0/10.0
- DSCR +5.0/10.0
- Schools +4.3/10.0
- Livability +3.8/5.0
- Condition / age +2.5/5.0
- Rent growth +0.7/5.0
- Appreciation +0.0/10.0
$4,900
🖨 Deal sheet (PDF) 📄 Offer letter ✓ Due diligence
Listing remarks
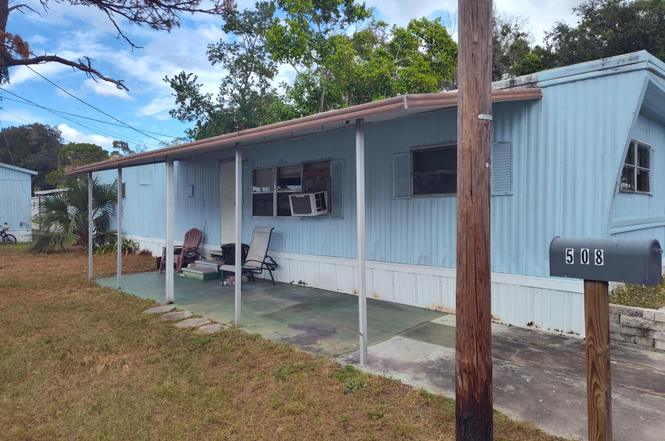
Opportunity knocks in Clearwater, Florida! This 1973 manufactured home offers approximately 784 square feet of space with a 14' x 56' footprint, featuring 2 bedrooms and 2 bathrooms ready for a full renovation. This is a true handyman special and ideal for buyers looking to add value through repairs and updates. The home has a functional layout with an open living area, dedicated kitchen space, and a split-bedroom feel that can be modernized to fit today's style.
Key facts
- Listed 138 days
Property features AI
Finance
- Other:
- Financial info: List price: 4900
- HOA & community:
Exterior
- Parking:
- Security:
- Utilities:
- Home design: Single-family plan (MANA "A" Plan); Active status
- Construction: Living area approximately 784 (listed as living area)
- Exterior features: Shake roof
Interior
- Kitchen:
- Bedrooms: 2 bedrooms
- Flooring:
- Bathrooms: 2 full bathrooms
- Heating & cooling: Forced air heating; Other heating; Other cooling; Has heating and cooling
- Interior features: Plan-based new construction (MANA "A" Plan)
- Laundry & utility:
Neighborhood map
What this means for you Summary
Snapshot
- This is a 2-bed/2.0-bath manufactured listed at $5k.
Deal economics
- At list price, monthly cash flow is $1k ($16k/yr) — positive.
- The deal already cash-flows at list — no discount required.
- Meets the 1% rule at list price ($2k rent vs $5k).
- Recommended offer: $4k (12.0% below list) — sets the bar for market timing.
Location & tenants
- Location reads 75/100 on livability (#267 in FL, #4,332 nationally) — a middle-class / working-renter tenant base. Strengths: commute A+, cost of living A+, housing A; Watch: amenities F, employment D-.
- Pinellas (suburban): math 51% / reading 51% proficiency, ranked #31 of 73 in FL (top 42%) — acceptable for families but not a draw, mixed tenant base, ~2y average lease.
- Zoned schools: High Point Elementary School (math 54% / reading 48%, grade C-, #1,043 of 2,144 statewide, top 49%, 609 students, 80% FRL); Fitzgerald Middle School (math 50% / reading 47%, grade C-, #274 of 571 statewide, top 50%, 1,033 students, 62% FRL); Pinellas Park High School (math 28% / reading 35%, grade F, #424 of 667 statewide, top 64%, 1,919 students, 57% FRL) — zoned schools average 66% FRL vs 48% district-wide (18 pts higher); higher-poverty schools than district average — tighter screening recommended.
- Market conditions: Rents falling (-7.1%/yr); 129 active listings in the ZIP; 40 comparable units currently listed for rent nearby; rentals leasing fast (median 9d on market — plan ~1-2 weeks tenant-placement turnaround); 2,676 units permitted in Pinellas County in 2024 (1,422 in 5+ unit buildings).
Forward outlook
- Local home prices are declining (-3.0%/yr); year-one equity from $34 of loan paydown is wiped out by about $147 of value loss. Plan a longer hold.
- Pinellas County population projected at +14% by 2050 — modest demand growth; plan on rents tracking national, not racing it.
- At projected returns (-3.0% appreciation + 0.0% rent growth), your $1k cash investment doubles in ~1 year — after that, you're playing with house money.
Negotiation context
- It's been on market 139 days — a 12% lower offer ($4k) is reasonable based on typical stale-listing flexibility.
Risks & watch-outs
- Climate carrying-cost: severe wind risk, 99% chance of damaging wind over 30y; extreme-heat days projected 6→20/yr by 2055 (HVAC capex compounding) — expect insurance premiums to compound above CPI over the hold.
Questions for the listing agent
- It's been on market 139 days. Have you received any prior offers? Is the seller open to a 12% concession, seller financing, or rate buy-down credit?
- Why hasn't it sold? Are there any deal-killer items the seller is aware of (foundation, flood, title, zoning, code violations)?
- Is there a deadline driving the sale (1031 exchange, divorce, estate, relocation)? That informs how much negotiation room exists.
- The area grade is low — what's the realistic commute time and amenity access for the typical tenant pool here? Any planned neighborhood developments (good or bad) we should know about?
- What's the average days-on-market for RENTAL listings here right now (not sales)? A rising rental-DOM trend means longer vacancies and softer asking-rent achievability than the comps imply.
- What's the recent tenant-quality profile in this submarket — average credit score on applications, eviction rate, late-payment / NSF rate, and stable-employment percentage? A property-management company in the area should have these aggregated.
- How much new for-sale + rental construction is in the pipeline within 1–3 miles? Heavy new supply typically softens prices + rents 12–24 months out; constrained supply supports both.
Investment metrics
- 1% rule
- 35.05% ✓
- Cap rate
- 330.31%
- Cash-on-cash
- 1157.19%
- DSCR
- 52.49
- GRM
- 0.2
CMA / ARV
No comps found within radius.
Projected returns pro-forma
-3.0% appreciation · 0.0% rent growth · sell at horizon
- IRR
- —
- Equity multiple
- 58.19×
- Total profit
- $78,464
- Equity at exit
- $731
- IRR
- —
- Equity multiple
- 115.78×
- Total profit
- $157,484
- Equity at exit
- $424
Cash invested: $1,372 (down + closing). Projections, not guarantees.
Landlord ↔ Tenant lean methodology
- Overall (STATE)
- 87 Strongly Landlord-Friendly
- State Florida
- 87 Strongly Landlord-Friendly · R+3
- County
- — inherits STATE
- City
- — inherits STATE
ZIP-level market 33760
- Rents YoY
- -7.1%
- Active inventory
- 129
- Price-to-rent
- 0.2×
Monthly cashflow live
- Estimated rent
- $1,718 high interval (Pro) →
- Mortgage (P&I)
- −$26
- Tax est. 1.5%
- −$6 /mo · $74/yr
- Insurance
- −$2
- HOA
- −$0
- Vacancy / Maint / Mgmt
- −$361
- Net cashflow
- $1,323
Break-even live
Sensitivity live
| Price | -10% $1,326 | -5% $1,325 | +0% $1,323 | +5% $1,321 | +10% $1,320 |
|---|---|---|---|---|---|
| Rent | -10% $1,187 | -5% $1,255 | +0% $1,323 | +5% $1,391 | +10% $1,459 |
| Rate | -1.0pp $1,326 | -0.5pp $1,324 | base $1,323 | +0.5pp $1,322 | +1.0pp $1,320 |
UW: 25.0% down · 7.5% · 30yr · 1.5% tax · 5.0% vac · 8.0% maint · 8.0% mgmt
Financing live
Cash to close
- Down payment
- $1,225
- Closing costs
- $147
- Reserves months
- —
- Total cash needed
- —
Loan-product check · same deal, 3 products live
Conventional
25% down · 7.5% · 30yr
- Down + closing
- —
- Monthly P&I
- —
- Monthly cashflow
- —
- DSCR
- —
- Eligible?
- —
Personal DTI + credit; lowest rate.
DSCR
20% down · 8.5% · 30yr
- Down + closing
- —
- Monthly P&I
- —
- Monthly cashflow
- —
- DSCR
- —
- Eligible?
- —
No personal income docs; deal must DSCR.
Hard money
10% down · 12.0% · 12mo
- Down + closing
- —
- Monthly P&I
- —
- Monthly cashflow
- —
- DSCR
- —
- Eligible?
- —
Short-term bridge; refi at stabilization.
Rent comps 40 comps
| Address | Beds | Baths | Sqft | Rent | $/sqft | DOM | Units | Dist |
|---|---|---|---|---|---|---|---|---|
| 15301 58th St N Unit A Clearwater, FL | 2.0 | 2.0 | 1000 | $1,900 | $1.90 | 18d | 1 | 0.25mi |
| 15000 Westminister Ave Unit A Clearwater, FL | 2.0 | 1.0 | 840 | $1,300 | $1.55 | 26d | 1 | 0.31mi |
| 15149 Westminister Ave Unit A Clearwater, FL | 3.0 | 1.0 | 1000 | $1,775 | $1.77 | 26d | 1 | 0.36mi |
| 14330 58th St N Clearwater, FL | 1.0–3.0 | 1.0–2.0 | 1161 | $2,242 | $1.93 | 0d | 19 | 0.37mi |
| 15406 Avalon Ave Unit 3 Clearwater, FL | 2.0 | 1.0 | 850 | $1,650 | $1.94 | 4d | 1 | 0.39mi |
| 15406 Avalon Ave Unit 4 Clearwater, FL | 2.0 | 1.0 | 850 | $1,800 | $2.12 | 6d | 1 | 0.39mi |
| 15414 Avalon Ave Unit 2 Clearwater, FL | 2.0 | 1.0 | 830 | $1,700 | $2.05 | 6d | 1 | 0.39mi |
| 15581 58th St N Apt B Clearwater, FL | 2.0 | 1.0 | 1050 | $1,850 | $1.76 | 0d | 1 | 0.42mi |
| 15648 Morgan St Unit B Clearwater, FL | 2.0 | 1.0 | 825 | $1,595 | $1.93 | 0d | 1 | 0.49mi |
| 15648 Morgan St Unit B Clearwater, FL | 2.0 | 1.0 | 825 | $1,595 | $1.93 | 12d | 1 | 0.49mi |
| 15616 Avalon Ave #1 Clearwater, FL | 2.0 | 1.0 | 850 | $1,525 | $1.79 | 4d | 1 | 0.50mi |
| 15616 Avalon Ave #1 Clearwater, FL | 2.0 | 1.0 | 804 | $1,525 | $1.90 | 0d | 1 | 0.50mi |
| 15616 Avalon Ave Unit 2 Clearwater, FL | 2.0 | 1.0 | 804 | $1,595 | $1.98 | 15d | 1 | 0.50mi |
| 15616 Avalon Ave Unit 2 Clearwater, FL | 2.0 | 1.0 | 804 | $1,595 | $1.98 | 5d | 1 | 0.50mi |
| 14603 64th St N Clearwater, FL | 3.0 | 2.0 | 1080 | $1,900 | $1.76 | 5d | 1 | 0.66mi |
| 6262 142nd Ave N Clearwater, FL | 2.0 | 1.5–2.0 | 1183 | $1,725 | $1.46 | 26d | 2 | 0.70mi |
| 15950 Bay Vista Dr Unit 201 Clearwater, FL | 2.0 | 2.0 | 950 | $2,495 | $2.63 | 9d | 1 | 0.71mi |
| 15950 Bay Vista Dr Unit 206 Clearwater, FL | 2.0 | 2.0 | 800 | $2,000 | $2.50 | 9d | 1 | 0.71mi |
| 15950 Bay Vista Dr Unit 207 Clearwater, FL | 1.0 | 1.0 | 565 | $1,700 | $3.01 | 9d | 1 | 0.71mi |
| 15950 Bay Vista Dr Unit 203 Clearwater, FL | 2.0 | 2.0 | 896 | $2,295 | $2.56 | 26d | 1 | 0.71mi |
| 15696 Bolesta Rd Unit A Clearwater, FL | 2.0 | 1.0 | 845 | $1,350 | $1.60 | 26d | 1 | 0.74mi |
| 15696 Bolesta Rd Unit B Clearwater, FL | 2.0 | 1.0 | 845 | $1,325 | $1.57 | 26d | 1 | 0.74mi |
| 6430 142nd Ave N Clearwater, FL | 1.0–3.0 | 1.0–2.0 | 1216 | $2,832 | $2.33 | 0d | 68 | 0.87mi |
| 2770 Roosevelt Blvd Clearwater, FL | 1.0–2.0 | 1.0 | 795 | $1,636 | $2.06 | 16d | 10 | 0.94mi |
| 19137 US Highway 19 N Unit 2 Clearwater, FL | 2.0 | 2.0 | 1062 | $1,738 | $1.64 | 26d | 1 | 0.97mi |
| 2878 Whitney Rd Unit A Clearwater, FL | 2.0 | 2.0 | 1120 | $1,695 | $1.51 | 0d | 1 | 1.14mi |
| 16321 Bolesta Rd Clearwater, FL | 1.0–3.0 | 1.0–2.0 | 925 | $1,545 | $1.67 | 0d | 39 | 1.18mi |
| 7001 142nd Ave Largo, FL | 2.0 | 2.0 | 1100 | $1,700 | $1.55 | 26d | 1 | 1.33mi |
| 2913 Lichen Ln Unit A Clearwater, FL | 2.0 | 1.0 | 752 | $1,695 | $2.25 | 9d | 1 | 1.36mi |
| 13200 49th St N Clearwater, FL | 2.0 | 1.0–2.0 | 592 | $1,671 | $2.82 | 0d | 20 | 1.36mi |
| 7001 142nd Ave N Lot 179 Largo, FL | 2.0 | 2.0 | 1100 | $2,495 | $2.27 | 18d | 1 | 1.36mi |
| 7001 142nd Ave N #157 Largo, FL | 2.0 | 1.0 | 800 | $1,795 | $2.24 | 19d | 1 | 1.37mi |
| 16485 US Highway 19 N Clearwater, FL | 3.0 | 1.0–2.0 | 984 | $3,006 | $3.06 | 19d | 100 | 1.39mi |
| 16485 US Highway 19 N Clearwater, FL | 3.0 | 1.0–2.0 | 984 | $2,877 | $2.92 | 0d | 247 | 1.39mi |
| 2906 Lichen Ln Unit B Clearwater, FL | 2.0 | 2.0 | 853 | $1,900 | $2.23 | 0d | 1 | 1.40mi |
| 2900 Lichen Ln Unit B Clearwater, FL | 2.0 | 1.5 | 853 | $2,500 | $2.93 | 26d | 1 | 1.41mi |
| 1839 Bough Ave Unit B Clearwater, FL | 2.0 | 1.5 | 852 | $1,675 | $1.97 | 6d | 1 | 1.45mi |
| 1839 Bough Ave Clearwater, FL | 2.0 | 2.0 | 852 | $1,675 | $1.97 | 26d | 1 | 1.45mi |
| 13500 Rodgers Ave Largo, FL | 1.0 | 1.0 | 700 | $1,474 | $2.11 | 3d | 5 | 1.46mi |
| 1834 Bough Ave #1 Clearwater, FL | 2.0 | 1.0 | 758 | $1,550 | $2.04 | 12d | 1 | 1.48mi |
Listing history 13 events
-
2026-06-22days on market $4,900 Active 139 DOM
-
2026-06-18days on market $4,900 Active 136 DOM
-
2026-06-17days on market $4,900 Active 135 DOM
-
2026-06-16days on market $4,900 Active 134 DOM
-
2026-06-15days on market $4,900 Active 133 DOM
-
2026-06-13days on market $4,900 Active 131 DOM
-
2026-06-09days on market $4,900 Active 127 DOM
-
2026-06-08days on market $4,900 Active 126 DOM
-
2026-06-07days on market $4,900 Active 125 DOM
-
2026-06-04days on market $4,900 Active 122 DOM
-
2026-06-03days on market $4,900 Active 121 DOM
-
2026-06-01days on market $4,900 Active 119 DOM
-
2026-05-31days on market $4,900 Active 118 DOM
ⓘ Source: listings_history table (triggers on properties + properties_extension) + one-shot
backfill from property_details.listing_events for pre-trigger history.
Climate risk First Street
- Flood 4/10 Moderate FEMA zone X (unshaded) · 13% chance over 30 yrs
- Wildfire 1/10 Low
- Heat 10/10 Extreme 6 d/yr ≥107°F today · 20 d/yr by 30 yrs out
- Wind 10/10 Extreme 99% chance of damaging wind over 30 yrs
- Air quality 3/10 Moderate 3 unhealthy d/yr today · 3 by 30 yrs out
Nearby sold comps map
Loading sold comps map…
Walkable amenities ~0.75 mi
Loading nearby amenities…
Taxation est. · year 1
- Rental income
- $20,611
- − Mortgage interest
- −$274
- − Property taxes
- −$74
- − Insurance
- −$24
- − Repairs & maintenance
- −$1,649
- − Management
- −$1,649
- − Depreciation
- −$143
- Taxable income
- $16,799
- Est. tax owed @ 24.0%
- −$4,032
- After-tax cash flow
- $11,845/yr
For passive investors: Depreciation is non-cash, so a rental often shows a tax loss while cash-flowing — sheltering income. Rental losses are passive: they offset passive income freely, and up to $25,000/yr can offset ordinary (W-2) income if you actively participate and your MAGI is under $100k (phasing out to $0 by $150k); unused losses carry forward. On sale, claimed depreciation is recaptured at up to 25%, and gains may owe capital-gains tax (a 1031 exchange can defer both). Figures are a year-1 estimate at your 24.0% rate — not tax advice; consult a CPA.
Schools (NCES district)
- District
- Pinellas
- NCES district ID
- 1201560
- Math proficiency
- 51% ▼ -5.00%
- Reading proficiency
- 51% ▼ -3.00%
- Median HH income
- $46,270
- Composite
- 43.27/100
- National rank
- #3046
- State rank
- #31 of 73 in FL
Livability — South Highpoint
- Score
- 75/100
- State rank
- #267
- US rank
- #4332
Category grades
Schools grade is shown separately in the Schools card above.
Census & demographics
- Census place
- South Highpoint, FL
- County
- Pinellas County · 939,478 people
- City population
- 20,501
- Metro
- Tampa-St. Petersburg-Clearwater, FL
- Population (ZIP)
- 20,501
- Household income
- $69,596
- Rent vs Own
- Severe rent burden
- 1311.0
Population outlook (Pinellas County) Hauer SSP2
- Today (2025)
- 1,027,532 people
- By 2030
- 1,063,586 · +3.5%
- By 2040
- 1,125,020 · +9.5%
- By 2050
- 1,168,637 · +13.7%
- By 2075
- 1,265,188 · +23.1%
- By 2100
- 1,260,357 · +22.7%
Race, ethnicity, and origin ACS 2023
- Neighborhood character
- Diverse neighborhood (Simpson 0.63)
- Race & ethnicity
- White 56% Hispanic / Latino 17% Black 17% Two or more races 10% Asian 6%
- Hispanic origin (detail)
- Mexican 8% Puerto Rican 5% Cuban 1%
- Common ancestry
- Lithuanian 2% American 2% Romanian 2%
- Foreign-born
- 16% · Canada, Vietnam
- Languages at home
- 79% English-only · Spanish 10% Russian/Polish/Slavic 4% Other Indo-European 2%
Political lean MEDSL · Pinellas
- 2024 margin
- Lean R (+5.2) · D 46.9% · R 52.1%
- 2008→2024 swing
- -13.5pp toward R · 2008: 8.3pp · 2024: -5.2pp
- All cycles
- 2024: R+5.2 2020: D+0.2 2016: R+1.1 2012: D+5.6 2008: D+8.3
Not yet ingested
- Civics
- —
Market trends
- HPI YoY
- ▼ -143.13%
- Current HPI
- 258.297
- Rent YoY
- ▼ -7.07%
- Metro
- Tampa-St. Petersburg-Clearwater, FL
- State GDP YoY
- ▲ 3.28%
- F500 in state
- 36
Industry mix (Fortune 500 HQ in FL)
| Industry | F500 HQs | Revenue |
|---|---|---|
| Industrial Technology | 2 | $29B |
|
||
| Insurance | 2 | $17B |
|
||
| Retail | 1 | $60B |
|
||
| Technology Distribution | 1 | $58B |
|
||
| Homebuilding | 1 | $35B |
|
||
| Technology Manufacturing | 1 | $35B |
|
||
Cash-flow waterfall
monthlySold comps — $/sqft
last 12 mo · ≤1 miLoading sold comps…