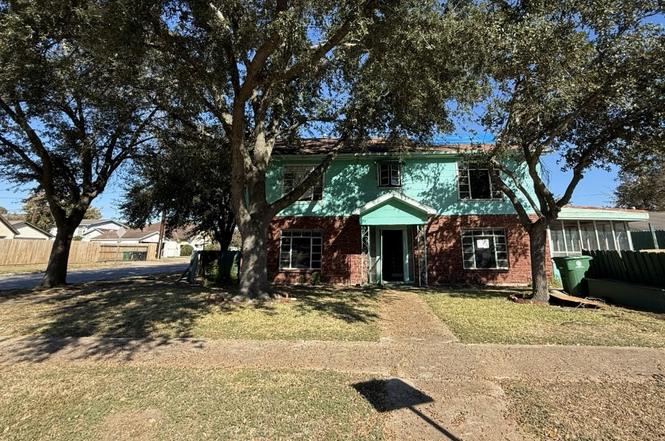
3401 Wentworth St · Houston, TX
Flood risk 1/10 · Minimal
- FEMA flood zone
- X (unshaded)
- Chance of flooding over 30 yrs
- 0.0%
- Est. flood insurance / yr
- $507 – $1,088
Fire risk 1/10 · Minimal
- Est. fire insurance / yr
- $1,222 – $2,270
Heat risk 9/10 · Severe
- Hot days now (above 109°F)
- 7 days/yr
- Hot days in 30 yrs
- 24 days/yr
Wind risk 9/10 · Severe
- Chance of severe wind over 30 yrs
- 99.0%
Air-quality risk 2/10 · Minimal
- Unhealthy air days now
- 2 days/yr
- Unhealthy air days in 30 yrs
- 2 days/yr
Risk factors via First Street. Map © Google.
Why this score? — see what drove the B- grade
The composite is a weighted blend of 9 inputs, each scored 0–100. Each bar is that input's sub-score; the figure is the points it added to the 100-point composite (weight × sub-score).
- Cash flow +26.3/30.0
- ARV discount +15.0/15.0
- DSCR +8.9/10.0
- 1% rule +8.0/10.0
- Livability +3.7/5.0
- Schools +2.7/10.0
- Condition / age +2.5/5.0
- Rent growth +2.4/5.0
- Appreciation +0.0/10.0
$285,600
🖨 Deal sheet 📄 Offer letter ✓ Due diligence
Listing remarks
Make this spacious traditional 4 bedroom, 2 and a half bathroom your own. Conveniently located a block from Texas Southern university and minutes from University of Houston. Enjoy cooling off in the pool and relaxing in the garage apartment game room.
Key facts
- 7,148 sq ft lot
- 2 garage spots
- Pool
Tags
Neighborhood map
What this means for you Summary
Snapshot
- This is a 4-bed/2.5-bath single-family listed at $286k.
Deal economics
- At list price, monthly cash flow is $741 ($9k/yr) — positive.
- The deal already cash-flows at list — no discount required.
- Meets the 1% rule at list price ($4k rent vs $286k).
- Recommended offer: $268k (6.0% below list) — sets the bar for market timing.
- Cap rate 9.4% vs local median 3.2% in Houston — top-decile yield for the area; either an underpriced asset or a hidden risk that comps aren't pricing in. Stress-test before assuming the spread holds.
Location & tenants
- Location reads 74/100 on livability (#184 in TX, #4,771 nationally) — a middle-class / working-renter tenant base. Strengths: amenities A+, cost of living A+, housing A+; Watch: crime F.
- Houston ISD (urban): math 27% / reading 35% proficiency, ranked #593 of 826 in TX (top 72%) — families likely to look elsewhere, expect single-tenant / working-renter base with shorter leases; 71% free/reduced lunch — lower-income household profile, screen leases tightly.
- Zoned schools: Cullen Middle (math 6% / reading 14%, grade F, #1,641 of 1,662 statewide, top 99%, 324 students, 100% FRL); Yates H S (math 12% / reading 23%, grade F, #1,451 of 1,632 statewide, top 89%, 851 students, 96% FRL) — zoned schools average 98% FRL vs 71% district-wide (27 pts higher); higher-poverty schools than district average — tighter screening recommended.
- Zoned-school proficiency averages 14% at this address vs 31% district-wide (-17 pts) — the specific schools serving this property underperform the Houston ISD average; the district grade overstates school quality for this exact location.
- Market conditions: Rents soft (-0.3%/yr); 581 active listings in the ZIP; 40 comparable units currently listed for rent nearby; rentals at typical pace (median 14d on market — plan ~3-4 weeks tenant-placement turnaround); 29,883 units permitted in Harris County in 2024 (8,621 in 5+ unit buildings).
- At $3,724/mo this rent would consume 63% of the median local household income ($71k/yr) (locally 3072% of renters already pay >50% of income on rent) — very limited rent-growth headroom before tenants either downsize or default.
Forward outlook
- Local home prices are declining (-3.0%/yr); year-one equity from $2k of loan paydown is wiped out by about $9k of value loss. Plan a longer hold.
- Harris County population projected at +47% by 2050 — long-run rental-demand tailwind backs the buy-and-hold thesis.
Negotiation context
- It's been on market 81 days — a 6% lower offer ($268k) is reasonable based on typical stale-listing flexibility.
- 4 sale attempts since 2y ago; this cycle's ask has dropped $54k (16%) from the opening price — seller is motivated, your offer sets the floor, not the list.
Risks & watch-outs
- Watch-outs: built in 1954 — expect roof / HVAC / electrical / plumbing capex.
- Climate carrying-cost: severe wind risk, 99% chance of damaging wind over 30y; extreme-heat days projected 7→24/yr by 2055 (HVAC capex compounding) — expect insurance premiums to compound above CPI over the hold.
Questions for the listing agent
- It's been on market 81 days. Have you received any prior offers? Is the seller open to a 6% concession, seller financing, or rate buy-down credit?
- Built in 1954 — when were the roof, HVAC, electrical panel, plumbing, and water heater last replaced?
- Why hasn't it sold? Are there any deal-killer items the seller is aware of (foundation, flood, title, zoning, code violations)?
- Is there a deadline driving the sale (1031 exchange, divorce, estate, relocation)? That informs how much negotiation room exists.
- Schools are D-rated, which usually means shorter tenancies and higher turnover. Who's the typical renter profile here, and what's been the actual vacancy rate?
- Crime grade is F in this area — have there been break-ins, vandalism, or insurance claims at this property in the last 3 years? What carrier currently insures it and at what premium?
- What's the average days-on-market for RENTAL listings here right now (not sales)? A rising rental-DOM trend means longer vacancies and softer asking-rent achievability than the comps imply.
- What's the recent tenant-quality profile in this submarket — average credit score on applications, eviction rate, late-payment / NSF rate, and stable-employment percentage? A property-management company in the area should have these aggregated.
- How much new for-sale + rental construction is in the pipeline within 1–3 miles? Heavy new supply typically softens prices + rents 12–24 months out; constrained supply supports both.
Investment metrics
- 1% rule
- 1.30% ✓
- Cap rate
- 9.41%
- Cash-on-cash
- 11.12%
- DSCR
- 1.49
- GRM
- 6.4
CMA / ARV
- ARV (on-the-fly)
- $481,000
- Comps found
- 12
Show comp detail 12 sales within ~0.75 mi
| Address | Dist | Beds/Ba | Sqft | Sold | Price | $/sf | Match |
|---|---|---|---|---|---|---|---|
| 3217 Calumet St | 0.48mi | 4/2.5 | 2,754 (+6%) | 3mo | $289,999 | $105 | 65 |
| 2904 Palm St | 0.53mi | 4/2.5 | 2,446 (-6%) | 2mo | $279,000 | $114 | 63 |
| 5416 Palmer St | 0.58mi | 4/3.5 | 2,512 (-3%) | 1mo | $459,000 | $183 | 63 |
| 3314 Arbor St | 0.16mi | 4/4.0 | 2,892 (+11%) | 7mo | $715,000 | $247 | 62 |
| 3615 Rosedale St | 0.37mi | 4/3.0 | 2,300 (-12%) | 4mo | $485,000 | $211 | 58 |
| 3209 Binz St | 0.54mi | 4/4.5 | 2,745 (+6%) | 2mo | $715,000 | $260 | 56 |
| 3202 Binz St | 0.57mi | 4/3.5 | 2,519 (-3%) | 10mo | $466,000 | $185 | 56 |
| 2811 Barbee St | 0.56mi | 4/3.0 | 2,386 (-8%) | 9mo | $399,990 | $168 | 51 |
| 5121 Grantwood St | 0.50mi | 3/3.5 (-1) | 2,372 (-9%) | 6mo | $400,000 | $169 | 48 |
| 3002 Prospect St | 0.60mi | 4/2.5 | 2,300 (-12%) | 7mo | $400,000 | $174 | 47 |
| 2618 Cleburne St | 0.69mi | 3/3.5 (-1) | 2,793 (+7%) | 1mo | $599,900 | $215 | 46 |
| 3019 Wichita St | 0.45mi | 5/3.5 (+1) | 2,235 (-14%) | 8mo | $530,000 | $237 | 40 |
Match score weights: distance 35% · size 25% · config 20% · recency 20%. Top-matched comps best support the ARV.
Projected returns pro-forma
-3.0% appreciation · 0.0% rent growth · sell at horizon
- IRR
- -3.4%
- Equity multiple
- 0.88×
- Total profit
- $-9,820
- Equity at exit
- $42,584
- IRR
- 2.2%
- Equity multiple
- 1.14×
- Total profit
- $10,820
- Equity at exit
- $24,693
Cash invested: $79,968 (down + closing). Projections, not guarantees.
Landlord ↔ Tenant lean methodology
- Overall (STATE)
- 87 Strongly Landlord-Friendly
- State Texas
- 87 Strongly Landlord-Friendly · R+5
- County
- — inherits STATE
- City
- — inherits STATE
ZIP-level market 77004
- Rents YoY
- -0.3%
- Active inventory
- 581
- Price-to-rent
- 6.4×
Monthly cashflow live
- Estimated rent
- $3,724 high interval (Pro) →
- Mortgage (P&I)
- −$1,498
- Tax from tax record
- −$584 /mo · $7,010/yr
- Insurance
- −$119
- HOA
- −$0
- Vacancy / Maint / Mgmt
- −$782
- Net cashflow
- $741
Break-even live
UW: 25.0% down · 7.5% · 30yr · 1.5% tax · 5.0% vac · 8.0% maint · 8.0% mgmt
Financing live
Cash to close
- Down payment
- $71,400
- Closing costs
- $8,568
- Reserves months
- —
- Total cash needed
- —
Loan-product check · same deal, 3 products live
Conventional
25% down · 7.5% · 30yr
- Down + closing
- —
- Monthly P&I
- —
- Monthly cashflow
- —
- DSCR
- —
- Eligible?
- —
Personal DTI + credit; lowest rate.
DSCR
20% down · 8.5% · 30yr
- Down + closing
- —
- Monthly P&I
- —
- Monthly cashflow
- —
- DSCR
- —
- Eligible?
- —
No personal income docs; deal must DSCR.
Hard money
10% down · 12.0% · 12mo
- Down + closing
- —
- Monthly P&I
- —
- Monthly cashflow
- —
- DSCR
- —
- Eligible?
- —
Short-term bridge; refi at stabilization.
Rent comps 40 comps
| Address | Beds | Baths | Sqft | Rent | $/sqft | DOM | Units | Dist |
|---|---|---|---|---|---|---|---|---|
| 3535 Wentworth St Houston, TX | 4.0 | 3.0 | 2600 | $2,650 | $1.02 | 22d | 1 | 0.26mi |
| 4306 Ennis St Houston, TX | 3.0 | 3.0 | 1989 | $2,500 | $1.26 | 43d | 1 | 0.47mi |
| 2703 Blodgett St Unit 1047952P Houston, TX | 1.0–5.0 | 1.5–5.5 | 2497 | $12,783 | $5.12 | 1d | 2 | 0.61mi |
| 3507 Canfield St Houston, TX | 3.0 | 2.5 | 2200 | $2,350 | $1.07 | 24d | 1 | 0.66mi |
| 2403 Arbor St Houston, TX | 3.0 | 2.5 | 2344 | $2,800 | $1.19 | 43d | 1 | 0.81mi |
| 5505 Zoemark Ln Houston, TX | 3.0 | 3.5 | 2477 | $2,850 | $1.15 | 43d | 1 | 0.82mi |
| 2311 Eagle St Houston, TX | 3.0 | 4.0 | 1783 | $2,500 | $1.40 | 43d | 1 | 0.89mi |
| 2209 Alabama St Unit B Houston, TX | 3.0 | 2.5 | 2074 | $2,350 | $1.13 | 43d | 1 | 1.00mi |
| 3122 Lucinda St Houston, TX | 5.0 | 5.0 | 1984 | $999 | $0.50 | 24d | 1 | 1.01mi |
| 3719 Elgin St Houston, TX | 1.0–5.0 | 1.0–5.0 | 1241 | $1,636 | $1.32 | 24d | 14 | 1.04mi |
| 3518 Dennis St Unit 1387517P Houston, TX | 4.0 | 4.0 | 2271 | $5,110 | $2.25 | 14d | 1 | 1.15mi |
| 3405 St Emanuel St Houston, TX | 4.0 | 5.0 | 2388 | $2,900 | $1.21 | 43d | 1 | 1.16mi |
| 1910 Oakdale St Unit A Houston, TX | 3.0 | 3.5 | 2452 | $3,890 | $1.59 | 12d | 1 | 1.18mi |
| 3213 Saint Emanuel St Houston, TX | 4.0 | 3.5 | 2100 | $3,300 | $1.57 | 17d | 1 | 1.20mi |
| 6334 Culberson St Houston, TX | 3.0 | 3.5 | 1822 | $2,311 | $1.27 | 2d | 1 | 1.20mi |
| 6336 Culberson St Houston, TX | 3.0 | 3.5 | 1822 | $2,361 | $1.30 | 5d | 1 | 1.21mi |
| 5927 Almeda Rd Unit AHP3 Houston, TX | 4.0 | 4.5 | 3055 | $7,635 | $2.50 | 4d | 1 | 1.22mi |
| 5927 Almeda Rd Houston, TX | 2.0–4.0 | 2.5–4.0 | 3055 | $7,635 | $2.50 | 12d | 2 | 1.22mi |
| 5927 Almeda Rd Houston, TX | 2.0–4.0 | 2.5–4.0 | 3055 | $7,635 | $2.50 | 1d | 3 | 1.22mi |
| 5927 Almeda Rd Houston, TX | 4.0 | 4.0 | 3055 | $7,635 | $2.50 | 43d | 1 | 1.23mi |
| 5927 Almeda Rd Houston, TX | 4.0 | 4.0 | 3055 | $7,635 | $2.50 | 24d | 1 | 1.23mi |
| 1818 Prospect St Houston, TX | 3.0 | 2.0 | 2923 | $3,400 | $1.16 | 4d | 1 | 1.23mi |
| 4135 DuPont St Houston, TX | 3.0 | 4.0 | 2395 | $2,499 | $1.04 | 43d | 1 | 1.26mi |
| 6318 Grand Blvd Houston, TX | 3.0 | 3.5 | 2325 | $2,999 | $1.29 | 4d | 1 | 1.28mi |
| 5933 Almeda Rd Unit 2-1405 Houston, TX | 4.0 | 4.0 | 3055 | $7,442 | $2.44 | 43d | 1 | 1.28mi |
| 3517 McIlhenny St Houston, TX | 3.0 | 3.5 | 2000 | $3,200 | $1.60 | 3d | 1 | 1.31mi |
| 4908 Crawford St Houston, TX | 3.0 | 2.0 | 2526 | $3,250 | $1.29 | 43d | 1 | 1.34mi |
| 3731 Alsace St Unit 1560804P Houston, TX | 3.0 | 2.0 | 2002 | $3,387 | $1.69 | 3d | 1 | 1.38mi |
| 3034 Gray St Houston, TX | 3.0 | 3.0 | 2081 | $3,000 | $1.44 | 43d | 1 | 1.40mi |
| 5350 Crawford St Unit 3165 Houston, TX | 3.0 | 2.0 | 1991 | $4,428 | $2.22 | 3d | 1 | 1.41mi |
| 5350 Crawford St Unit 5383 Houston, TX | 3.0 | 2.0 | 1991 | $4,460 | $2.24 | 11d | 1 | 1.41mi |
| 2105 McGowen St Unit 1244936P Houston, TX | 3.0 | 3.5 | 2497 | $4,836 | $1.94 | 5d | 1 | 1.43mi |
| 2109 McGowen St Unit 1244934P Houston, TX | 3.0 | 3.5 | 2497 | $4,734 | $1.90 | 5d | 1 | 1.44mi |
| 2107 McGowen St Unit 1244935P Houston, TX | 3.0 | 3.5 | 2497 | $4,711 | $1.89 | 3d | 1 | 1.44mi |
| 4606 Austin St Houston, TX | 3.0 | 3.5 | 2950 | $3,000 | $1.02 | 43d | 1 | 1.44mi |
| 2521 Saint Emanuel St Unit 1047945P Houston, TX | 3.0 | 3.0 | 2292 | $3,010 | $1.31 | 3d | 1 | 1.45mi |
| 2519 Saint Emanuel St Unit 1241246P Houston, TX | 3.0 | 3.0 | 2389 | $2,670 | $1.12 | 2d | 1 | 1.45mi |
| 2103 McGowen St Unit 1244937P Houston, TX | 3.0 | 3.5 | 2292 | $4,758 | $2.08 | 2d | 1 | 1.45mi |
| 3010 Chenevert St Unit 3010 Houston, TX | 3.0 | 3.5 | 3203 | $8,000 | $2.50 | 43d | 1 | 1.46mi |
| 3010 Chenevert St Unit 1019638P Houston, TX | 3.0 | 3.5 | 3196 | $7,988 | $2.50 | 7d | 1 | 1.46mi |
Listing history 14 events
-
2026-03-24status Pending
-
2026-03-23price $285,600
-
2026-03-20status Active
-
2026-03-13status Pending
-
2026-02-11price $312,800
-
2025-12-26$340,000 Active
-
2025-05-24historical
-
2025-05-07$440,000 Active
-
2025-05-06soldstatus
-
2025-04-14soldstatus
-
2025-04-10historical
-
2024-12-11$430,000 Active
-
2024-07-16soldstatus
-
1996-09-13soldstatus
ⓘ Source: listings_history table (triggers on properties + properties_extension) + one-shot
backfill from property_details.listing_events for pre-trigger history.
Tax reassessment forecast TX · Resets to sale price
- Current annual tax
- $7,010 · $584/mo
- Projected year-2 tax
- $7,010 · $584/mo
- Expected delta
- $0/yr ($0/mo · 0.0%)
ⓘ Screening estimate from a state-policy table — verify with the county assessor before closing.
Climate risk First Street
- Flood 1/10 Low FEMA zone X (unshaded) · 0% chance over 30 yrs
- Wildfire 1/10 Low
- Heat 9/10 Extreme 7 d/yr ≥109°F today · 24 d/yr by 30 yrs out
- Wind 9/10 Extreme 99% chance of damaging wind over 30 yrs
- Air quality 2/10 Low 2 unhealthy d/yr today · 2 by 30 yrs out
Nearby sold comps map
Loading sold comps map…
Walkable amenities ~0.75 mi
Loading nearby amenities…
Taxation est. · year 1
- Rental income
- $44,682
- − Mortgage interest
- −$15,998
- − Property taxes
- −$7,010
- − Insurance
- −$1,428
- − Repairs & maintenance
- −$3,575
- − Management
- −$3,575
- − Depreciation
- −$8,308
- Taxable income
- $4,789
- Est. tax owed @ 24.0%
- −$1,149
- After-tax cash flow
- $7,739/yr
For passive investors: Depreciation is non-cash, so a rental often shows a tax loss while cash-flowing — sheltering income. Rental losses are passive: they offset passive income freely, and up to $25,000/yr can offset ordinary (W-2) income if you actively participate and your MAGI is under $100k (phasing out to $0 by $150k); unused losses carry forward. On sale, claimed depreciation is recaptured at up to 25%, and gains may owe capital-gains tax (a 1031 exchange can defer both). Figures are a year-1 estimate at your 24.0% rate — not tax advice; consult a CPA.
Schools (NCES district)
- District
- Houston ISD
- NCES district ID
- 4823640
- Math proficiency
- 27% ▼ -18.00%
- Reading proficiency
- 35% ▼ -6.00%
- Median HH income
- $46,054
- Composite
- 26.63/100
- National rank
- #7173
- State rank
- #593 of 826 in TX
Livability — Houston
- Score
- 74/100
- State rank
- #184
- US rank
- #4771
Category grades
Schools grade is shown separately in the Schools card above.
Census & demographics
- Census place
- Houston, TX
- County
- Harris County · 4,702,590 people
- City population
- 3,226,434
- Metro
- Houston-The Woodlands-Sugar Land, TX
- Population (ZIP)
- 35,997
- Household income
- $71,199
- Rent vs Own
- Severe rent burden
- 3072.0
Population outlook (Harris County) Hauer SSP2
- Today (2025)
- 5,571,493 people
- By 2030
- 6,089,821 · +9.3%
- By 2040
- 7,142,806 · +28.2%
- By 2050
- 8,185,864 · +46.9%
- By 2075
- 10,574,329 · +89.8%
- By 2100
- 12,109,958 · +117.4%
Race, ethnicity, and origin ACS 2023
- Neighborhood character
- Diverse neighborhood (Simpson 0.68)
- Race & ethnicity
- Black 48% White 27% Hispanic / Latino 13% Two or more races 11% Asian 8%
- Hispanic origin (detail)
- Mexican 9%
- Common ancestry
- Lithuanian 1% Romanian 1% Italian 1%
- Foreign-born
- 14% · Canada, China, South Korea
- Languages at home
- 82% English-only · Spanish 10% Chinese 2% Other Indo-European 2%
Political lean MEDSL · Harris
- 2024 margin
- Lean D (+5.5) · D 52.0% · R 46.4% · Other 1.6%
- 2008→2024 swing
- +3.9pp toward D · 2008: 1.6pp · 2024: 5.5pp
- All cycles
- 2024: D+5.5 2020: D+13.3 2016: D+12.4 2012: D+0.1 2008: D+1.6
Not yet ingested
- Civics
- —
Market trends
- HPI YoY
- ▼ -139.34%
- Current HPI
- 199.6066
- Rent YoY
- ▼ -0.32%
- Metro
- Houston-The Woodlands-Sugar Land, TX
- State GDP YoY
- ▲ 3.95%
- F500 in state
- 110
Industry mix (Fortune 500 HQ in TX)
| Industry | F500 HQs | Revenue |
|---|---|---|
| Energy | 16 | $1,198B |
|
||
| Technology | 5 | $198B |
|
||
| Engineering / Construction | 4 | $72B |
|
||
| Energy Services | 3 | $60B |
|
||
| Utilities | 3 | $41B |
|
||
| Healthcare | 2 | $330B |
|
||
Price history
-33.6% since first listed14 events — show timeline
- 2026-03-24 Pending — HARMLS
- 2026-03-23 Price Changed $285,600 HARMLS
- 2026-03-20 Relisted — HARMLS
- 2026-03-13 Pending — HARMLS
- 2026-02-11 Price Changed $312,800 HARMLS
- 2025-12-26 Listed $340,000 HARMLS
- 2025-05-24 Listing Removed — HARMLS
- 2025-05-07 Listed $440,000 HARMLS
- 2025-05-06 Sold (Public Records) — Public Records
- 2025-04-14 Sold (Public Records) — Public Records
- 2025-04-10 Listing Removed — HARMLS
- 2024-12-11 Listed $430,000 HARMLS
- 2024-07-16 Sold (Public Records) — Public Records
- 1996-09-13 Sold (Public Records) — Public Records
Property tax history
+4.2%/yrLatest (2025): $7,010 · +8.1% YoY. Source: county tax records.
Cash-flow waterfall
monthlySold comps — $/sqft
last 12 mo · ≤1 miLoading sold comps…