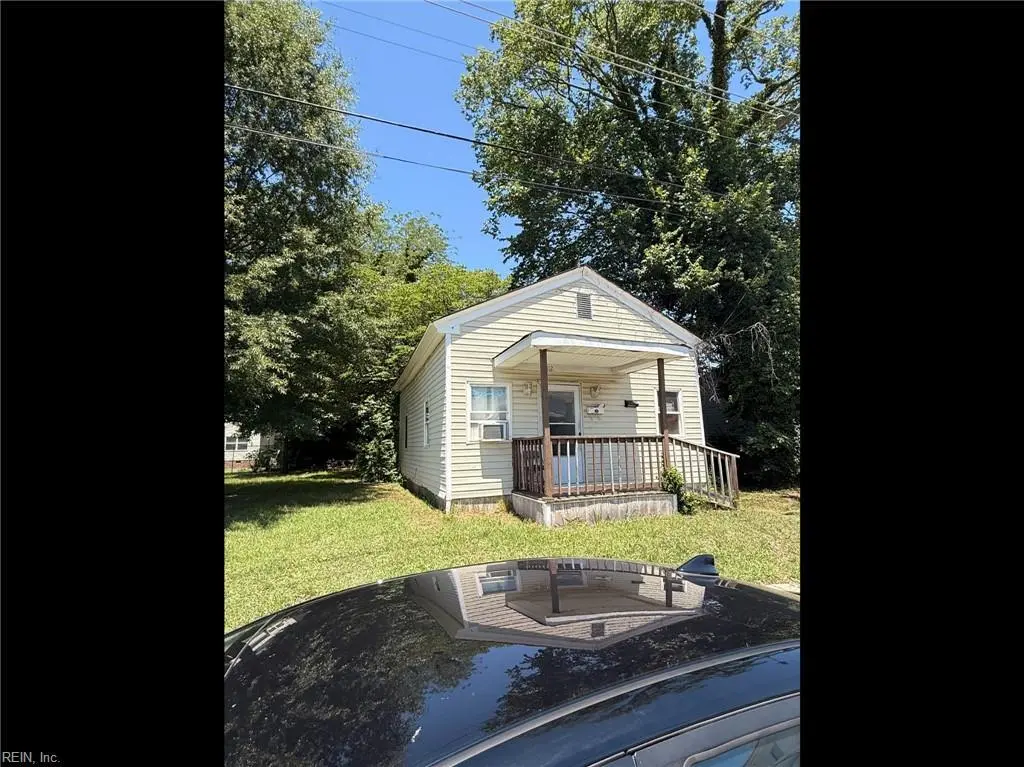
1112 Duke St · Portsmouth, VA
Flood risk 5/10 · Moderate
- FEMA flood zone
- X (shaded)
- Chance of flooding over 30 yrs
- 0.51%
- Est. flood insurance / yr
- $507 – $1,088
Fire risk 1/10 · Minimal
- Est. fire insurance / yr
- $666 – $1,236
Heat risk 9/10 · Severe
- Hot days now (above 106°F)
- 7 days/yr
- Hot days in 30 yrs
- 16 days/yr
Wind risk 8/10 · Major
- Chance of severe wind over 30 yrs
- 80.0%
Air-quality risk 5/10 · Moderate
- Unhealthy air days now
- 6 days/yr
- Unhealthy air days in 30 yrs
- 7 days/yr
Risk factors via First Street. Map © Google.
Why this score? — see what drove the B- grade
The composite is a weighted blend of 9 inputs, each scored 0–100. Each bar is that input's sub-score; the figure is the points it added to the 100-point composite (weight × sub-score).
- Cash flow +27.9/30.0
- DSCR +9.9/10.0
- ARV discount +7.5/15.0
- 1% rule +7.0/10.0
- Schools +3.9/10.0
- Livability +3.7/5.0
- Rent growth +3.3/5.0
- Condition / age +2.5/5.0
- Appreciation +0.0/10.0
$105,000
🖨 Deal sheet 📄 Offer letter ✓ Due diligence
Listing remarks
Great investment opportunity in Portsmouth! This 2-bedroom, 1-bath home is conveniently located near the naval base, shopping, dining, and major highways. Currently tenant-occupied on a month-to-month lease, with tenants planning to vacate upon 30 days’ notice. Great for investors or buyers looking for a renovation project. Sold as-is with plenty of potential to add value.
Key facts
- Tenant occupied
- Renovation project
- Add value
Tags
Property features AI
Finance
- HOA & community: No HOA (N/A)
Exterior
- Parking: Street parking
- Utilities: City/County water; City/County sewer; Gas water heater
- Home design: Detached bungalow; Single-story
- Construction: Crawl foundation; Asphalt shingle roof
- Exterior features: Vinyl siding; 50 x 30 lot (30' front x 50' depth)
Interior
- Kitchen: Gas Range; Refrigerator
- Bedrooms: Bedroom and full bathroom on the first floor
- Flooring: Carpet
- Bathrooms: 1 full bathroom
- Heating & cooling: Wall furnace heating; Window/Wall cooling
- Interior features: Carpet flooring; Fixer upper
- Laundry & utility: Washer
Neighborhood map
What this means for you Summary
Snapshot
- This is a 2-bed/1.0-bath single-family listed at $105k.
Deal economics
- At list price, monthly cash flow is $323 ($4k/yr) — positive.
- The deal already cash-flows at list — no discount required.
- Meets the 1% rule at list price ($1k rent vs $105k).
- Recommended offer: $103k (1.5% below list) — sets the bar for market timing.
- Cap rate 10.0% vs local median 4.6% in Portsmouth — top-decile yield for the area; either an underpriced asset or a hidden risk that comps aren't pricing in. Stress-test before assuming the spread holds.
Location & tenants
- Location reads 73/100 on livability (#172 in VA) — a middle-class / working-renter tenant base. Strengths: amenities A+, cost of living A+, housing A+; Watch: employment C-, crime F, commute F.
- Portsmouth City Public School District (urban): math 34% / reading 58% proficiency, ranked #107 of 131 in VA (top 82%) — families likely to look elsewhere, expect single-tenant / working-renter base with shorter leases.
- Zoned schools: Brighton Elementary (math 12% / reading 32%, grade F, #1,069 of 1,108 statewide, top 97%, 411 students, 97% FRL) — zoned schools average 97% FRL vs 60% district-wide (37 pts higher); higher-poverty schools than district average — tighter screening recommended.
- Zoned-school proficiency averages 22% at this address vs 46% district-wide (-24 pts) — the specific schools serving this property underperform the Portsmouth City Public School District average; the district grade overstates school quality for this exact location.
- Market conditions: Rents rising (+3.3%/yr); 131 active listings in the ZIP; 16 comparable units currently listed for rent nearby; rentals at typical pace (median 24d on market — plan ~3-4 weeks tenant-placement turnaround); 300 units permitted in Portsmouth city in 2024 (112 in 5+ unit buildings).
- This rent runs 30% of the median local income ($50k/yr) — at the standard rent-burdened threshold; future hikes will face affordability resistance.
Forward outlook
- Local home prices are declining (-3.0%/yr); year-one equity from $726 of loan paydown is wiped out by about $3k of value loss. Plan a longer hold.
- At projected returns (-3.0% appreciation + 3.3% rent growth), your $29k cash investment doubles in ~9 years — after that, you're playing with house money.
Negotiation context
- It's been on market 16 days — a 2% lower offer ($103k) is reasonable based on typical stale-listing flexibility.
- 2 sale attempts since 2y ago; this cycle's ask has dropped $10k (9%) from the opening price — seller is motivated, your offer sets the floor, not the list.
Risks & watch-outs
- Watch-outs: built in 1948 — expect roof / HVAC / electrical / plumbing capex.
- Climate carrying-cost: moderate flood risk; severe wind risk, 80% chance of damaging wind over 30y; extreme-heat days projected 7→16/yr by 2055 (HVAC capex compounding) — expect insurance premiums to compound above CPI over the hold.
Questions for the listing agent
- Built in 1948 — when were the roof, HVAC, electrical panel, plumbing, and water heater last replaced?
- Is there a deadline driving the sale (1031 exchange, divorce, estate, relocation)? That informs how much negotiation room exists.
- Schools are B-rated — typically a magnet for longer-tenancy family renters. What's the average tenant stay here, and is there a school-zone premium baked into asking?
- Crime grade is F in this area — have there been break-ins, vandalism, or insurance claims at this property in the last 3 years? What carrier currently insures it and at what premium?
- What's the average days-on-market for RENTAL listings here right now (not sales)? A rising rental-DOM trend means longer vacancies and softer asking-rent achievability than the comps imply.
- What's the recent tenant-quality profile in this submarket — average credit score on applications, eviction rate, late-payment / NSF rate, and stable-employment percentage? A property-management company in the area should have these aggregated.
- How much new for-sale + rental construction is in the pipeline within 1–3 miles? Heavy new supply typically softens prices + rents 12–24 months out; constrained supply supports both.
Investment metrics
- 1% rule
- 1.20% ✓
- Cap rate
- 9.98%
- Cash-on-cash
- 13.17%
- DSCR
- 1.59
- GRM
- 7.0
CMA / ARV
No comps found within radius.
Projected returns pro-forma
-3.0% appreciation · 3.31% rent growth · sell at horizon
- IRR
- 3.4%
- Equity multiple
- 1.13×
- Total profit
- $3,915
- Equity at exit
- $15,656
- IRR
- 13.2%
- Equity multiple
- 2.07×
- Total profit
- $31,438
- Equity at exit
- $9,078
Cash invested: $29,400 (down + closing). Projections, not guarantees.
Landlord ↔ Tenant lean methodology
- Overall (STATE)
- 55 Moderately Landlord-Leaning
- State Virginia
- 55 Moderately Landlord-Leaning · D+2
- County
- — inherits STATE
- City
- — inherits STATE
ZIP-level market 23704
- Home prices YoY
- -4.6%
- Rents YoY
- 3.3%
- Active inventory
- 131
- Price-to-rent
- 7.0×
Monthly cashflow live
- Estimated rent
- $1,258 high interval (Pro) →
- Mortgage (P&I)
- −$551
- Tax from tax record
- −$77 /mo · $926/yr
- Insurance
- −$44
- HOA
- −$0
- Vacancy / Maint / Mgmt
- −$264
- Net cashflow
- $323
Break-even live
UW: 25.0% down · 7.5% · 30yr · 1.5% tax · 5.0% vac · 8.0% maint · 8.0% mgmt
Financing live
Cash to close
- Down payment
- $26,250
- Closing costs
- $3,150
- Reserves months
- —
- Total cash needed
- —
Loan-product check · same deal, 3 products live
Conventional
25% down · 7.5% · 30yr
- Down + closing
- —
- Monthly P&I
- —
- Monthly cashflow
- —
- DSCR
- —
- Eligible?
- —
Personal DTI + credit; lowest rate.
DSCR
20% down · 8.5% · 30yr
- Down + closing
- —
- Monthly P&I
- —
- Monthly cashflow
- —
- DSCR
- —
- Eligible?
- —
No personal income docs; deal must DSCR.
Hard money
10% down · 12.0% · 12mo
- Down + closing
- —
- Monthly P&I
- —
- Monthly cashflow
- —
- DSCR
- —
- Eligible?
- —
Short-term bridge; refi at stabilization.
Rent comps 16 comps
| Address | Beds | Baths | Sqft | Rent | $/sqft | DOM | Units | Dist |
|---|---|---|---|---|---|---|---|---|
| 714 King St Unit 00 714204 Portsmouth, VA | 1.0 | 1.0 | 670 | $1,499 | $2.24 | 17d | 1 | 0.54mi |
| 531 County St Unit 3 Portsmouth, VA | 1.0 | 1.0 | 725 | $900 | $1.24 | 12d | 1 | 0.57mi |
| 531 County St Unit 3 Portsmouth, VA | 1.0 | 1.0 | 725 | $900 | $1.24 | 7d | 1 | 0.57mi |
| 507 High St Portsmouth, VA | 1.0 | 1.0 | 686 | $1,474 | $2.15 | 3d | 1 | 0.68mi |
| 548 Madison St Portsmouth, VA | 1.0 | 1.0 | 750 | $1,249 | $1.67 | 43d | 1 | 0.72mi |
| 548 Madison St Unit 54311--D Portsmouth, VA | 1.0 | 1.0 | 750 | $1,249 | $1.67 | 23d | 1 | 0.73mi |
| 941 Holladay St Portsmouth, VA | 1.0 | 1.0 | 720 | $900 | $1.25 | 43d | 1 | 0.75mi |
| 525 North St #1 Portsmouth, VA | 1.0 | 1.0 | 630 | $1,100 | $1.75 | 43d | 1 | 0.81mi |
| 320 Dinwiddie St Portsmouth, VA | 1.0 | 1.0 | 700 | $1,150 | $1.64 | 23d | 1 | 0.91mi |
| 303 Effingham St Unit S-4B Portsmouth, VA | 1.0 | 1.0 | 604 | $1,050 | $1.74 | 23d | 1 | 0.92mi |
| 303 Effingham St Unit S-5H Portsmouth, VA | 1.0 | 1.0 | 604 | $1,170 | $1.94 | 23d | 1 | 0.92mi |
| 303 Effingham St Portsmouth, VA | 1.0 | 1.0 | 604 | $1,350 | $2.24 | 23d | 1 | 0.92mi |
| 303 Effingham St Unit S-8B Portsmouth, VA | 1.0 | 1.0 | 604 | $1,150 | $1.90 | 23d | 1 | 0.92mi |
| 303 Effingham St Portsmouth, VA | 1.0–3.0 | 1.0–2.0 | 863 | $1,500 | $1.74 | 16d | 11 | 0.92mi |
| 359 Middle St Portsmouth, VA | 1.0 | 1.0 | 700 | $1,150 | $1.64 | 43d | 1 | 0.95mi |
| 401 Constitution Ave Unit B Portsmouth, VA | 1.0 | 1.0 | 600 | $1,100 | $1.83 | 43d | 1 | 1.02mi |
Listing history 10 events
-
2026-06-18days on market $105,000 Active 16 DOM
-
2026-06-17days on market $105,000 Active 15 DOM
-
2026-06-16days on market $105,000 Active 14 DOM
-
2026-06-15days on market $105,000 Active 13 DOM
-
2026-06-13days on market $105,000 Active 11 DOM
-
2026-06-09days on market $105,000 Active 7 DOM
-
2026-06-08days on market $105,000 Active 6 DOM
-
2026-06-07pricedays on market $105,000 Active 5 DOM
-
2026-06-03remarks 375-char remark
-
2026-06-03$114,900 Active 1 DOM
ⓘ Source: listings_history table (triggers on properties + properties_extension) + one-shot
backfill from property_details.listing_events for pre-trigger history.
Tax reassessment forecast VA · Resets to sale price
- Current annual tax
- $926 · $77/mo
- Projected year-2 tax
- $926 · $77/mo
- Expected delta
- $0/yr ($0/mo · 0.0%)
ⓘ Screening estimate from a state-policy table — verify with the county assessor before closing.
Climate risk First Street
- Flood 5/10 Major FEMA zone X (shaded) · 51% chance over 30 yrs
- Wildfire 1/10 Low
- Heat 9/10 Extreme 7 d/yr ≥106°F today · 16 d/yr by 30 yrs out
- Wind 8/10 Severe 80% chance of damaging wind over 30 yrs
- Air quality 5/10 Major 6 unhealthy d/yr today · 7 by 30 yrs out
Nearby sold comps map
Loading sold comps map…
Walkable amenities ~0.75 mi
Loading nearby amenities…
Taxation est. · year 1
- Rental income
- $15,102
- − Mortgage interest
- −$5,882
- − Property taxes
- −$926
- − Insurance
- −$525
- − Repairs & maintenance
- −$1,208
- − Management
- −$1,208
- − Depreciation
- −$3,055
- Taxable income
- $2,298
- Est. tax owed @ 24.0%
- −$552
- After-tax cash flow
- $3,320/yr
For passive investors: Depreciation is non-cash, so a rental often shows a tax loss while cash-flowing — sheltering income. Rental losses are passive: they offset passive income freely, and up to $25,000/yr can offset ordinary (W-2) income if you actively participate and your MAGI is under $100k (phasing out to $0 by $150k); unused losses carry forward. On sale, claimed depreciation is recaptured at up to 25%, and gains may owe capital-gains tax (a 1031 exchange can defer both). Figures are a year-1 estimate at your 24.0% rate — not tax advice; consult a CPA.
Schools (NCES district)
- District
- Portsmouth City Public School District
- NCES district ID
- 5103000
- Math proficiency
- 34% ▼ -40.00%
- Reading proficiency
- 58% ▼ -12.00%
- Median HH income
- $46,152
- Composite
- 39.01/100
- National rank
- #4071
- State rank
- #107 of 131 in VA
Livability — Portsmouth
- Score
- 73/100
- State rank
- #172
- US rank
- #5381
Category grades
Schools grade is shown separately in the Schools card above.
Census & demographics
- Census place
- Portsmouth, VA
- County
- Portsmouth City · 96,366 people
- City population
- 96,366
- Metro
- Virginia Beach-Norfolk-Newport News, VA-NC
- Population (ZIP)
- 19,207
- Household income
- $49,583
- Rent vs Own
- Severe rent burden
- 1727.0
Population outlook (Portsmouth County) Hauer SSP2
- Today (2025)
- 96,730 people
- By 2030
- 96,760 · +0.0%
- By 2040
- 96,573 · -0.2%
- By 2050
- 95,606 · -1.2%
- By 2075
- 93,579 · -3.3%
- By 2100
- 83,756 · -13.4%
Race, ethnicity, and origin ACS 2023
- Neighborhood character
- Predominantly Black (66%)
- Race & ethnicity
- Black 66% White 24% Two or more races 6% Hispanic / Latino 4% Asian 2%
- Common ancestry
- Slovak 1% Romanian 1% Lithuanian 1%
- Foreign-born
- 2% · Canada
- Languages at home
- 96% English-only · Spanish 2%
Political lean MEDSL · Portsmouth
- 2024 margin
- Solid D (+38.6) · D 68.6% · R 30.0% · Other 1.4%
- 2008→2024 swing
- -0.7pp no change · 2008: 39.3pp · 2024: 38.6pp
- All cycles
- 2024: D+38.6 2020: D+40.8 2016: D+36.5 2012: D+39.6 2008: D+39.3
Not yet ingested
- Civics
- —
Market trends
- HPI YoY
- ▼ -15.69%
- Current HPI
- 322.7335
- Rent YoY
- ▲ 3.31%
- Metro
- Virginia Beach-Norfolk-Newport News, VA-NC
- State GDP YoY
- ▲ 2.40%
- F500 in state
- 50
Industry mix (Fortune 500 HQ in VA)
| Industry | F500 HQs | Revenue |
|---|---|---|
| Aerospace / Defense | 4 | $236B |
|
||
| Technology / Defense | 3 | $32B |
|
||
| Financial Services | 2 | $176B |
|
||
| Utilities | 2 | $27B |
|
||
| Insurance | 2 | $25B |
|
||
| Technology | 2 | $15B |
|
||
Price history
-8.0% since first listed4 events — show timeline
- 2026-06-02 Listed $114,900 REINMLS
- 2024-09-10 Listing Removed — REINMLS
- 2024-09-02 Price Changed $114,900 REINMLS
- 2024-08-23 Listed $124,900 REINMLS
Property tax history
+2.3%/yrLatest (2025): $926 · +0.8% YoY. Source: county tax records.
Cash-flow waterfall
monthlySold comps — $/sqft
last 12 mo · ≤1 miLoading sold comps…