410 Nostrand Ave Unit 3F · New York, NY
Flood risk 8/10 · Major
- FEMA flood zone
- X (unshaded)
- Chance of flooding over 30 yrs
- 0.78%
- Est. flood insurance / yr
- $507 – $1,088
Fire risk 1/10 · Minimal
- Est. fire insurance / yr
- $691 – $1,283
Heat risk 7/10 · Major
- Hot days now (above 99°F)
- 7 days/yr
- Hot days in 30 yrs
- 15 days/yr
Wind risk 6/10 · Moderate
- Chance of severe wind over 30 yrs
- 27.0%
Air-quality risk 4/10 · Minor
- Unhealthy air days now
- 5 days/yr
- Unhealthy air days in 30 yrs
- 7 days/yr
Risk factors via First Street. Map © Google.
Why this score? — see what drove the D- grade
The composite is a weighted blend of 9 inputs, each scored 0–100. Each bar is that input's sub-score; the figure is the points it added to the 100-point composite (weight × sub-score).
- Appreciation +10.0/10.0
- ARV discount +7.5/15.0
- Cash flow +5.0/30.0
- Schools +5.0/10.0
- Rent growth +4.4/5.0
- Livability +3.8/5.0
- Condition / age +2.5/5.0
- 1% rule +0.9/10.0
- DSCR +0.0/10.0
$795,000
🖨 Deal sheet (PDF) 📄 Offer letter ✓ Due diligence
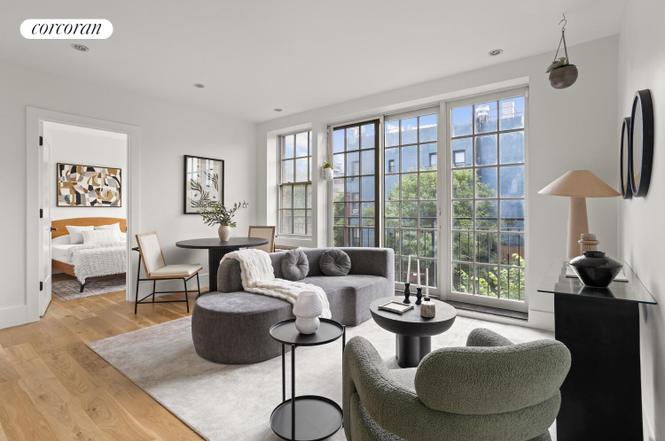
Listing remarks
Light pours into this beautifully maintained two-bedroom, one-bath condo from every angle, and it shows. Unit 3F is genuinely, relentlessly sunny, the kind of apartment where you forget to turn the lights on. At 768 square feet, the classic winged layout puts both bedrooms on opposite ends of the apartment for real privacy, while the open living space soaks up natural light all day long. Through-wall heating and A/C, in-unit washer & dryer, elevator and shared roof deck. What more could you want? The kitchen faces the sunshine, with tons of counter space, a breakfast bar, and full size appliances including a 5 burger gas range with a middle griddle. A stacked washer & dryer hav
Key facts
- Shared roof deck
- Elevator access
- Breakfast bar
Tags
Property features AI
Finance
- Other: Pets not allowed in the building
- HOA & community: Association fee of $442 monthly
Exterior
- Home design: Condo/unit on entry level 3; Single-story unit
- Exterior features: Juliet balcony; Private outdoor space under 60 sqft; East exposure
Interior
- Kitchen: Dishwasher
- Bedrooms: 5 total rooms (unit includes bedroom spaces)
- Bathrooms: 1 full bathroom
- Interior features: High ceilings; Has a view
- Laundry & utility: Washer hookup; In-unit laundry possible; Washer/dryer allowed
Neighborhood map
What this means for you Summary
Snapshot
- This is a 2-bed/1.0-bath condo listed at $795k.
Deal economics
- At list price, monthly cash flow is $-2k ($-23k/yr) — negative.
- To cash-flow at today's rent, offer at most $452k (43.1% below list).
- To meet the 1% rule (rent ≥ 1% of price), the offer needs to be $470k (40.9% below list).
- Recommended offer: $452k (43.1% below list) — sets the bar for cash-flow.
- Cap rate 3.5% vs local median 2.6% in New York — top-decile yield for the area; either an underpriced asset or a hidden risk that comps aren't pricing in. Stress-test before assuming the spread holds.
Location & tenants
- Location reads 75/100 on livability (#268 in NY, #4,188 nationally) — a middle-class / working-renter tenant base. Strengths: amenities A+, commute A+, health & safety A; Watch: crime F, cost of living F.
- Market conditions: Rents rising fast (+7.7%/yr); 120 active listings in the ZIP; 13 comparable units currently listed for rent nearby; rentals at typical pace (median 21d on market — plan ~3-4 weeks tenant-placement turnaround); solid renter incomes; 10,063 units permitted in Kings County in 2024 (9,789 in 5+ unit buildings).
- At $4,702/mo this rent would consume 56% of the median local household income ($101k/yr) (locally 4473% of renters already pay >50% of income on rent) — very limited rent-growth headroom before tenants either downsize or default.
Forward outlook
- In year one you build about $85k of equity ($5k loan paydown + $80k appreciation (10.0% local appreciation)).
- Kings County population projected at +13% by 2050 — modest demand growth; plan on rents tracking national, not racing it.
- By year 2, paydown + projected appreciation supports a ~$137k cash-out refi (75% LTV) — recoverable capital for the next deal without selling this one.
Negotiation context
- Only 2 days on market — expect competitive offers; lowballing is unlikely to land.
Risks & watch-outs
- Watch-outs: flood insurance adds $66/mo.
- Climate carrying-cost: severe flood risk; major wind risk, 27% chance of damaging wind over 30y; extreme-heat days projected 7→15/yr by 2055 (HVAC capex compounding) — expect insurance premiums to compound above CPI over the hold.
Questions for the listing agent
- What do current leases actually rent for vs. the listed asking? Can we see a recent rent roll and the last 12 months of T-12 income?
- What's the actual annual flood-insurance premium (NFIP or private), and is the property in a SFHA with mandatory coverage?
- What does the HOA fee cover, when was the last increase, and are there any pending special assessments or reserve-fund shortfalls?
- Any open or pending special assessments — roof, HVAC, plumbing, elevator, façade? What's the per-unit balance and payoff schedule, and is the seller paying it off at close or rolling it to the buyer?
- Is there a deadline driving the sale (1031 exchange, divorce, estate, relocation)? That informs how much negotiation room exists.
- Schools are B-rated — typically a magnet for longer-tenancy family renters. What's the average tenant stay here, and is there a school-zone premium baked into asking?
- Crime grade is F in this area — have there been break-ins, vandalism, or insurance claims at this property in the last 3 years? What carrier currently insures it and at what premium?
- The area grade is low — what's the realistic commute time and amenity access for the typical tenant pool here? Any planned neighborhood developments (good or bad) we should know about?
- What's the average days-on-market for RENTAL listings here right now (not sales)? A rising rental-DOM trend means longer vacancies and softer asking-rent achievability than the comps imply.
- What's the recent tenant-quality profile in this submarket — average credit score on applications, eviction rate, late-payment / NSF rate, and stable-employment percentage? A property-management company in the area should have these aggregated.
- How much new apartment / multifamily construction is in the pipeline within 1–3 miles? Heavy new supply (>2% of stock underway) typically softens rents 12–24 months out; light construction supports rent growth.
Investment metrics
- 1% rule
- 0.59% ✗
- Cap rate
- 3.46%
- Cash-on-cash
- -10.10%
- DSCR
- 0.55
- GRM
- 14.1
CMA / ARV
No comps found within radius.
Projected returns pro-forma
10.0% appreciation · 7.72% rent growth · sell at horizon
- IRR
- 18.1%
- Equity multiple
- 2.50×
- Total profit
- $332,940
- Equity at exit
- $716,199
- IRR
- 17.8%
- Equity multiple
- 6.10×
- Total profit
- $1,135,317
- Equity at exit
- $1,544,510
Cash invested: $222,600 (down + closing). Projections, not guarantees.
Landlord ↔ Tenant lean methodology
- Overall (CITY)
- 0 Strongly Tenant-Friendly
- State New York
- 15 Strongly Tenant-Friendly · D+10
- County
- — inherits STATE
- City New York
- 0 Strongly Tenant-Friendly · D+34
ZIP-level market 11216
- Home prices YoY
- 3.4%
- Rents YoY
- 7.7%
- Active inventory
- 120
- Price-to-rent
- 14.1×
Monthly cashflow live
- Estimated rent
- $4,702 high interval (Pro) →
- Mortgage (P&I)
- −$4,169
- Tax from tax record
- −$647 /mo · $7,758/yr
- Insurance
- −$331
- Flood insurance flood zone
- −$66 /mo · $798/yr
- HOA
- −$442
- Vacancy / Maint / Mgmt
- −$987
- Net cashflow
- $-1,941
Break-even live
Sensitivity live
| Price | -10% $-1,491 | -5% $-1,716 | +0% $-1,941 | +5% $-2,166 | +10% $-2,391 |
|---|---|---|---|---|---|
| Rent | -10% $-2,312 | -5% $-2,126 | +0% $-1,941 | +5% $-1,755 | +10% $-1,569 |
| Rate | -1.0pp $-1,540 | -0.5pp $-1,738 | base $-1,941 | +0.5pp $-2,147 | +1.0pp $-2,356 |
UW: 25.0% down · 7.5% · 30yr · 1.5% tax · 5.0% vac · 8.0% maint · 8.0% mgmt
Financing live
Cash to close
- Down payment
- $198,750
- Closing costs
- $23,850
- Reserves months
- —
- Total cash needed
- —
Loan-product check · same deal, 3 products live
Conventional
25% down · 7.5% · 30yr
- Down + closing
- —
- Monthly P&I
- —
- Monthly cashflow
- —
- DSCR
- —
- Eligible?
- —
Personal DTI + credit; lowest rate.
DSCR
20% down · 8.5% · 30yr
- Down + closing
- —
- Monthly P&I
- —
- Monthly cashflow
- —
- DSCR
- —
- Eligible?
- —
No personal income docs; deal must DSCR.
Hard money
10% down · 12.0% · 12mo
- Down + closing
- —
- Monthly P&I
- —
- Monthly cashflow
- —
- DSCR
- —
- Eligible?
- —
Short-term bridge; refi at stabilization.
Rent comps 13 comps
| Address | Beds | Baths | Sqft | Rent | $/sqft | DOM | Units | Dist |
|---|---|---|---|---|---|---|---|---|
| 72 Van Buren St Brooklyn, NY | 3.0 | 1.0 | 1000 | $1,180 | $1.18 | 25d | 1 | 0.55mi |
| 1437 Pacific St Brooklyn, NY | 2.0 | 1.0 | 1000 | $3,200 | $3.20 | 25d | 1 | 0.63mi |
| 668 Nostrand Ave #1 Brooklyn, NY | 1.0 | 1.0 | 611 | $4,200 | $6.87 | 19d | 1 | 0.65mi |
| 552 Prospect Pl Unit 3A Brooklyn, NY | 1.0 | 1.0 | 676 | $4,500 | $6.66 | 25d | 1 | 0.76mi |
| 762 Park Pl Unit 3B Brooklyn, NY | 3.0 | 2.0 | 1114 | $5,400 | $4.85 | 25d | 1 | 0.81mi |
| 545 Vanderbilt Ave Brooklyn, NY | 2.0 | 1.0 | 600 | $6,280 | $10.47 | 3d | 3 | 0.88mi |
| 955 Sterling Pl Unit 415 Brooklyn, NY | 2.0 | 1.0 | 680 | $5,150 | $7.57 | 25d | 1 | 0.88mi |
| 955 Sterling Pl #1936 Brooklyn, NY | 1.0 | 1.0 | 540 | $3,170 | $5.87 | 21d | 1 | 0.89mi |
| 475 Clermont Ave Brooklyn, NY | 2.0 | 1.0–2.0 | 807 | $6,596 | $8.17 | 4d | 7 | 0.91mi |
| 755 Washington Ave Brooklyn, NY | 1.0 | 1.0 | 700 | $1,800 | $2.57 | 21d | 1 | 0.97mi |
| 1266 Park Pl Unit 1A Brooklyn, NY | 2.0 | 1.5 | 886 | $3,250 | $3.67 | 25d | 1 | 1.19mi |
| 151 S Elliott Pl Brooklyn, NY | 1.0–2.0 | 1.0–2.0 | 655 | $6,380 | $9.74 | 2d | 2 | 1.26mi |
| 461 Dean St Brooklyn, NY | 1.0 | 1.0 | 781 | $5,320 | $6.81 | 5d | 5 | 1.30mi |
HOA detail condo
- Monthly dues
- $442 · $5,304/yr
- Likely covers
- gas
- Assessments
- None detected in remarks — confirm with the listing agent.
Listing history 3 events
-
2026-06-18days on market $795,000 Active 2 DOM
-
2026-06-16remarks 691-char remark
-
2026-06-16$795,000 Active 1 DOM
ⓘ Source: listings_history table (triggers on properties + properties_extension) + one-shot
backfill from property_details.listing_events for pre-trigger history.
Tax reassessment forecast NY · Partial reset (capped growth)
- Current annual tax
- $7,758 · $647/mo
- Projected year-2 tax
- $10,597 · $883/mo
- Expected delta
- +$2,839/yr (+$237/mo · 36.6%)
ⓘ Screening estimate from a state-policy table — verify with the county assessor before closing.
Climate risk First Street
- Flood 8/10 Severe FEMA zone X (unshaded) · 78% chance over 30 yrs
- Wildfire 1/10 Low
- Heat 7/10 Severe 7 d/yr ≥99°F today · 15 d/yr by 30 yrs out
- Wind 6/10 Major 27% chance of damaging wind over 30 yrs
- Air quality 4/10 Moderate 5 unhealthy d/yr today · 7 by 30 yrs out
Nearby sold comps map
Loading sold comps map…
Walkable amenities ~0.75 mi
Loading nearby amenities…
Taxation est. · year 1
- Rental income
- $56,425
- − Mortgage interest
- −$44,532
- − Property taxes
- −$7,758
- − Insurance
- −$4,772
- − Repairs & maintenance
- −$4,514
- − Management
- −$4,514
- − HOA
- −$5,304
- − Depreciation
- −$23,127
- Taxable loss
- −$38,097
- Est. tax savings @ 24.0%
- +$9,143
- After-tax cash flow
- $-14,144/yr
For passive investors: Depreciation is non-cash, so a rental often shows a tax loss while cash-flowing — sheltering income. Rental losses are passive: they offset passive income freely, and up to $25,000/yr can offset ordinary (W-2) income if you actively participate and your MAGI is under $100k (phasing out to $0 by $150k); unused losses carry forward. On sale, claimed depreciation is recaptured at up to 25%, and gains may owe capital-gains tax (a 1031 exchange can defer both). Figures are a year-1 estimate at your 24.0% rate — not tax advice; consult a CPA.
Schools (NCES district)
No district data.
Livability — New York
- Score
- 75/100
- State rank
- #268
- US rank
- #4188
Category grades
Schools grade is shown separately in the Schools card above.
Census & demographics
- Census place
- New York, NY
- County
- Kings County · 2,614,986 people
- City population
- 7,731,280
- Metro
- New York-Newark-Jersey City, NY-NJ-PA
- Population (ZIP)
- 60,685
- Household income
- $101,277
- Rent vs Own
- Severe rent burden
- 4473.0
Population outlook (Kings County) Hauer SSP2
- Today (2025)
- 2,847,441 people
- By 2030
- 2,937,006 · +3.1%
- By 2040
- 3,095,491 · +8.7%
- By 2050
- 3,228,968 · +13.4%
- By 2075
- 3,321,723 · +16.7%
- By 2100
- 3,111,387 · +9.3%
Race, ethnicity, and origin ACS 2023
- Neighborhood character
- Diverse neighborhood (Simpson 0.69)
- Race & ethnicity
- Black 46% White 29% Hispanic / Latino 12% Two or more races 11% Asian 5%
- Hispanic origin (detail)
- Mexican 1% Puerto Rican 3% Dominican 2%
- Common ancestry
- Romanian 2% Lithuanian 2% Hispanic 2%
- Foreign-born
- 22% · Canada, Mexico, China
- Languages at home
- 80% English-only · Spanish 8% French/Haitian/Cajun 3% Other Indo-European 2%
Political lean MEDSL · Kings
- 2024 margin
- Solid D (+44.0) · D 72.0% · R 28.0%
- 2008→2024 swing
- -15.5pp toward R · 2008: 59.4pp · 2024: 44.0pp
- All cycles
- 2024: D+44.0 2020: D+54.8 2016: D+61.8 2012: D+63.9 2008: D+59.4
Not yet ingested
- Civics
- —
Market trends
- HPI YoY
- ▲ 27.76%
- Current HPI
- 849.9392
- Rent YoY
- ▲ 7.72%
- Metro
- New York-Newark-Jersey City, NY-NJ-PA
- State GDP YoY
- ▲ 2.60%
- F500 in state
- 92
Industry mix (Fortune 500 HQ in NY)
| Industry | F500 HQs | Revenue |
|---|---|---|
| Financial Services | 10 | $950B |
|
||
| Consumer Goods | 9 | $162B |
|
||
| Insurance | 4 | $225B |
|
||
| Telecommunications | 2 | $144B |
|
||
| Pharmaceuticals | 2 | $112B |
|
||
| Media / Entertainment | 2 | $69B |
|
||
Price history
1 event — show timeline
- 2026-06-16 Listed $795,000 RLS at REBNY
Property tax history
+1.5%/yrLatest (2025): $7,758 · +6.9% YoY. Source: county tax records.
Cash-flow waterfall
monthlySold comps — $/sqft
last 12 mo · ≤1 miLoading sold comps…