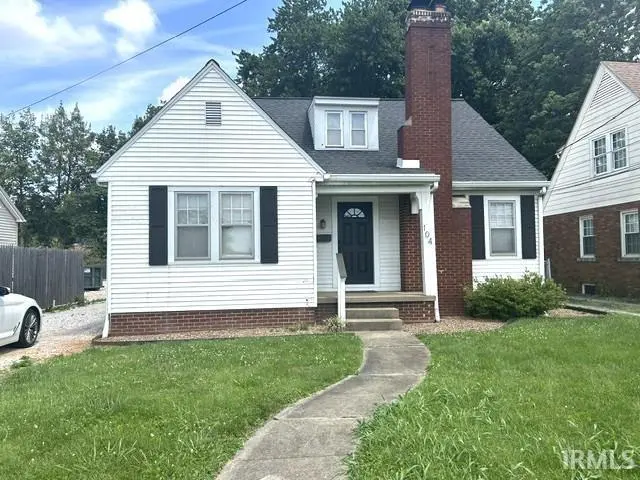
104 S Weinbach Ave · Evansville, IN
Flood risk 1/10 · Minimal
- FEMA flood zone
- X (unshaded)
- Chance of flooding over 30 yrs
- 0.0%
- Est. flood insurance / yr
- $473 – $860
Fire risk 1/10 · Minimal
- Est. fire insurance / yr
- $717 – $1,331
Heat risk 5/10 · Moderate
- Hot days now (above 107°F)
- 7 days/yr
- Hot days in 30 yrs
- 19 days/yr
Wind risk 2/10 · Minimal
- Chance of severe wind over 30 yrs
- 3.0%
Air-quality risk 3/10 · Minor
- Unhealthy air days now
- 3 days/yr
- Unhealthy air days in 30 yrs
- 4 days/yr
Risk factors via First Street. Map © Google.
Why this score? — see what drove the D grade
The composite is a weighted blend of 9 inputs, each scored 0–100. Each bar is that input's sub-score; the figure is the points it added to the 100-point composite (weight × sub-score).
- ARV discount +13.8/15.0
- Cash flow +10.2/30.0
- Rent growth +4.5/5.0
- Schools +3.3/10.0
- Livability +3.2/5.0
- 1% rule +2.9/10.0
- DSCR +2.9/10.0
- Condition / age +2.5/5.0
- Appreciation +0.0/10.0
$168,500
🖨 Deal sheet (PDF) 📄 Offer letter ✓ Due diligence
Listing remarks
Great Investment Opportunity! Students just moved out and it was Last Leased for $1,760.00 per month i. e. $440.00 per bedrooms. Within walking distance of U of E, Plenty of Off Street Parking behind the home. 4 Bedrooms 1 Bath with a partial Basement. Recent updates include Kitchen Remodeled new cabinets, Counters, Electric Range/Oven, Microwave Oven/Hood Combo, dishwasher and a Refrigerator. The Roof is 8 years old plus there is a Newer Electric Water Heater and a High efficiency Gas Furnace and Central Air System. Also Included is a Washer & Dryer a Sump Pump and a Stand up Shower all in the basement.
Key facts
- Off street parking
- Electric range oven
- Kitchen remodeled
Tags
Property features AI
Exterior
- Parking: Gravel and aggregate off-street parking
- Security: Smoke detectors; Carbon monoxide detectors
- Utilities: Public water; Public sewer; Cable available and connected
- Home design: Single-family residence; Site-built home; One story
- Construction: Aluminum siding; Block foundation; Built as a site-built home
- Exterior features: Shingle roof; Level lot
Interior
- Kitchen: Disposal; Dishwasher; Microwave; Refrigerator; Electric oven; Electric range
- Bedrooms: Total rooms: 6
- Flooring: Hardwood; Carpet; Ceramic tile
- Bathrooms: 1 full bathroom (main level)
- Heating & cooling: Central air conditioning; Natural gas heating; Forced air; Floor furnace
- Interior features: Eat-in kitchen; Laminate counters; Living room wood-burning fireplace
- Laundry & utility: Washer hookup; Electric dryer hookup; Washer and dryer included; Laundry in basement; Electric water heater
Neighborhood map
What this means for you Summary
Snapshot
- This is a 3-bed/1.0-bath single-family listed at $168k.
Deal economics
- At list price, monthly cash flow is $-96 ($-1k/yr) — negative.
- To cash-flow at today's rent, offer at most $152k (10.1% below list).
- To meet the 1% rule (rent ≥ 1% of price), the offer needs to be $134k (20.6% below list).
- Recommended offer: $134k (20.6% below list) — sets the bar for 1% rule.
- Cap rate 5.6% vs local median 4.6% in Evansville — meaningfully above typical; check what's discounted (condition, days-on-market, listing class) to confirm the premium yield is real.
Location & tenants
- Location reads 63/100 on livability (#416 in IN) — a middle-class / working-renter tenant base. Strengths: cost of living A+, housing A+, health & safety A+; Watch: crime F, commute F, employment D-.
- Evansville Vanderburgh School Corporation (urban): math 36% / reading 43% proficiency, ranked #153 of 301 in IN (top 51%) — families likely to look elsewhere, expect single-tenant / working-renter base with shorter leases.
- Zoned schools: Harper Elementary School (math 32% / reading 27%, grade F, #697 of 994 statewide, top 73%, 337 students, 74% FRL); Washington Middle School (math 14% / reading 24%, grade F, #274 of 330 statewide, top 83%, 353 students, 70% FRL); New Tech Institute (math 34% / reading 74%, grade C-, #79 of 369 statewide, top 26%, 275 students, 40% FRL).
- Market conditions: Rents rising fast (+7.9%/yr); 191 active listings in the ZIP; 9 comparable units currently listed for rent nearby; rentals at typical pace (median 23d on market — plan ~3-4 weeks tenant-placement turnaround); 508 units permitted in Vanderburgh County in 2024 (32 in 5+ unit buildings).
Forward outlook
- Local home prices are declining (-3.0%/yr); year-one equity from $1k of loan paydown is wiped out by about $5k of value loss. Plan a longer hold.
Negotiation context
- Only 9 days on market — expect competitive offers; lowballing is unlikely to land.
Risks & watch-outs
- Watch-outs: built in 1934 — expect roof / HVAC / electrical / plumbing capex.
- Climate carrying-cost: extreme-heat days projected 7→19/yr by 2055 (HVAC capex compounding) — expect insurance premiums to compound above CPI over the hold.
Questions for the listing agent
- What do current leases actually rent for vs. the listed asking? Can we see a recent rent roll and the last 12 months of T-12 income?
- Built in 1934 — when were the roof, HVAC, electrical panel, plumbing, and water heater last replaced?
- Is there a deadline driving the sale (1031 exchange, divorce, estate, relocation)? That informs how much negotiation room exists.
- Schools are D-rated, which usually means shorter tenancies and higher turnover. Who's the typical renter profile here, and what's been the actual vacancy rate?
- Crime grade is F in this area — have there been break-ins, vandalism, or insurance claims at this property in the last 3 years? What carrier currently insures it and at what premium?
- The area grade is low — what's the realistic commute time and amenity access for the typical tenant pool here? Any planned neighborhood developments (good or bad) we should know about?
- What's the average days-on-market for RENTAL listings here right now (not sales)? A rising rental-DOM trend means longer vacancies and softer asking-rent achievability than the comps imply.
- What's the recent tenant-quality profile in this submarket — average credit score on applications, eviction rate, late-payment / NSF rate, and stable-employment percentage? A property-management company in the area should have these aggregated.
- How much new for-sale + rental construction is in the pipeline within 1–3 miles? Heavy new supply typically softens prices + rents 12–24 months out; constrained supply supports both.
Investment metrics
- 1% rule
- 0.79% ✗
- Cap rate
- 5.61%
- Cash-on-cash
- -2.44%
- DSCR
- 0.89
- GRM
- 10.5
CMA / ARV
- ARV (on-the-fly)
- $196,053
- Comps found
- 12
Show comp detail 12 sales within ~0.75 mi
| Address | Dist | Beds/Ba | Sqft | Sold | Price | $/sf | Match |
|---|---|---|---|---|---|---|---|
| 2051 John St | 0.06mi | 2/1.0 (-1) | 1,316 (-4%) | 4mo | $135,000 | $103 | 82 |
| 39 N Kelsey Ave | 0.25mi | 3/1.0 | 1,402 (+2%) | 3mo | $49,820 | $36 | 82 |
| 117 S Boeke Rd | 0.47mi | 3/1.0 | 1,396 (+2%) | 4mo | $200,000 | $143 | 72 |
| 2101 E Franklin St | 0.30mi | 2/1.0 (-1) | 1,440 (+5%) | 2mo | $164,900 | $115 | 71 |
| 424 S Kelsey Ave | 0.31mi | 4/2.0 (+1) | 1,364 (-0%) | 5mo | $205,000 | $150 | 71 |
| 2108 Bellemeade Ave | 0.55mi | 3/1.0 | 1,330 (-3%) | 4mo | $235,000 | $177 | 66 |
| 2157 E Mulberry St | 0.54mi | 3/2.0 | 1,313 (-4%) | 6mo | $218,000 | $166 | 59 |
| 219 N Rotherwood Ave | 0.37mi | 3/2.0 | 1,200 (-12%) | 2mo | $189,900 | $158 | 57 |
| 2333 E Illinois St | 0.50mi | 3/1.0 | 1,194 (-13%) | 6mo | $155,000 | $130 | 50 |
| 911 Oak Hill Rd | 0.73mi | 2/1.0 (-1) | 1,512 (+10%) | 2mo | $145,000 | $96 | 42 |
| 732 S Norman Ave | 0.66mi | 2/1.5 (-1) | 1,540 (+12%) | 2mo | $230,000 | $149 | 40 |
| 2305 Bellemeade Ave | 0.68mi | 2/2.0 (-1) | 1,574 (+15%) | 2mo | $221,000 | $140 | 33 |
Match score weights: distance 35% · size 25% · config 20% · recency 20%. Top-matched comps best support the ARV.
Projected returns pro-forma
-3.0% appreciation · 7.86% rent growth · sell at horizon
- IRR
- -15.1%
- Equity multiple
- 0.44×
- Total profit
- $-26,538
- Equity at exit
- $25,124
- IRR
- 0.1%
- Equity multiple
- 1.00×
- Total profit
- $225
- Equity at exit
- $14,569
Cash invested: $47,180 (down + closing). Projections, not guarantees.
Landlord ↔ Tenant lean methodology
- Overall (STATE)
- 90 Strongly Landlord-Friendly
- State Indiana
- 90 Strongly Landlord-Friendly · R+11
- County
- — inherits STATE
- City
- — inherits STATE
ZIP-level market 47714
- Rents YoY
- 7.9%
- Active inventory
- 191
- Price-to-rent
- 10.5×
Monthly cashflow live
- Estimated rent
- $1,338 high interval (Pro) →
- Mortgage (P&I)
- −$884
- Tax from tax record
- −$199 /mo · $2,391/yr
- Insurance
- −$70
- HOA
- −$0
- Vacancy / Maint / Mgmt
- −$281
- Net cashflow
- $-96
Break-even live
Sensitivity live
| Price | -10% $-1 | -5% $-48 | +0% $-96 | +5% $-144 | +10% $-191 |
|---|---|---|---|---|---|
| Rent | -10% $-202 | -5% $-149 | +0% $-96 | +5% $-43 | +10% $10 |
| Rate | -1.0pp $-11 | -0.5pp $-53 | base $-96 | +0.5pp $-140 | +1.0pp $-184 |
UW: 25.0% down · 7.5% · 30yr · 1.5% tax · 5.0% vac · 8.0% maint · 8.0% mgmt
Financing live
Cash to close
- Down payment
- $42,125
- Closing costs
- $5,055
- Reserves months
- —
- Total cash needed
- —
Loan-product check · same deal, 3 products live
Conventional
25% down · 7.5% · 30yr
- Down + closing
- —
- Monthly P&I
- —
- Monthly cashflow
- —
- DSCR
- —
- Eligible?
- —
Personal DTI + credit; lowest rate.
DSCR
20% down · 8.5% · 30yr
- Down + closing
- —
- Monthly P&I
- —
- Monthly cashflow
- —
- DSCR
- —
- Eligible?
- —
No personal income docs; deal must DSCR.
Hard money
10% down · 12.0% · 12mo
- Down + closing
- —
- Monthly P&I
- —
- Monthly cashflow
- —
- DSCR
- —
- Eligible?
- —
Short-term bridge; refi at stabilization.
Rent comps 9 comps
| Address | Beds | Baths | Sqft | Rent | $/sqft | DOM | Units | Dist |
|---|---|---|---|---|---|---|---|---|
| 210 S Weinbach Ave Evansville, IN | 3.0 | 1.0 | 1080 | $1,450 | $1.34 | 23d | 1 | 0.07mi |
| 1321 E Indiana St Evansville, IN | 2.0 | 1.0 | 964 | $1,050 | $1.09 | 15d | 1 | 0.61mi |
| 1303 E Indiana St Evansville, IN | 2.0 | 1.0 | 975 | $1,195 | $1.23 | 15d | 1 | 0.64mi |
| 913 N Spring St Evansville, IN | 3.0 | 1.5 | 1232 | $1,350 | $1.10 | 15d | 1 | 0.69mi |
| 900 S Saint James Blvd Evansville, IN | 3.0 | 2.0 | 1118 | $1,450 | $1.30 | 23d | 1 | 1.04mi |
| 1133 Bayard Park Dr Unit B Evansville, IN | 2.0 | 1.0 | 990 | $800 | $0.81 | 23d | 1 | 1.06mi |
| 304 S Grand Ave Evansville, IN | 2.0 | 1.0 | 967 | $955 | $0.99 | 23d | 1 | 1.09mi |
| 2015 N Weinbach Ave Evansville, IN | 2.0 | 2.0 | 1200 | $1,200 | $1.00 | 23d | 1 | 1.40mi |
| 734 Bayard Park Dr Evansville, IN | 3.0 | 2.0 | 1000 | $1,425 | $1.43 | 23d | 1 | 1.47mi |
Listing history 7 events
-
2026-06-22days on market $168,500 Active 9 DOM
-
2026-06-18days on market $168,500 Active 6 DOM
-
2026-06-17days on market $168,500 Active 5 DOM
-
2026-06-16days on market $168,500 Active 4 DOM
-
2026-06-15days on market $168,500 Active 3 DOM
-
2026-06-13remarks 613-char remark
-
2026-06-13$168,500 Active 1 DOM
ⓘ Source: listings_history table (triggers on properties + properties_extension) + one-shot
backfill from property_details.listing_events for pre-trigger history.
Tax reassessment forecast IN · Partial reset (capped growth)
- Current annual tax
- $2,391 · $199/mo
- Projected year-2 tax
- $2,391 · $199/mo
- Expected delta
- $0/yr ($0/mo · 0.0%)
ⓘ Screening estimate from a state-policy table — verify with the county assessor before closing.
Climate risk First Street
- Flood 1/10 Low FEMA zone X (unshaded) · 0% chance over 30 yrs
- Wildfire 1/10 Low
- Heat 5/10 Major 7 d/yr ≥107°F today · 19 d/yr by 30 yrs out
- Wind 2/10 Low 3% chance of damaging wind over 30 yrs
- Air quality 3/10 Moderate 3 unhealthy d/yr today · 4 by 30 yrs out
Nearby sold comps map
Loading sold comps map…
Walkable amenities ~0.75 mi
Loading nearby amenities…
Taxation est. · year 1
- Rental income
- $16,058
- − Mortgage interest
- −$9,439
- − Property taxes
- −$2,391
- − Insurance
- −$842
- − Repairs & maintenance
- −$1,285
- − Management
- −$1,285
- − Depreciation
- −$4,902
- Taxable loss
- −$4,085
- Est. tax savings @ 24.0%
- +$981
- After-tax cash flow
- $-171/yr
For passive investors: Depreciation is non-cash, so a rental often shows a tax loss while cash-flowing — sheltering income. Rental losses are passive: they offset passive income freely, and up to $25,000/yr can offset ordinary (W-2) income if you actively participate and your MAGI is under $100k (phasing out to $0 by $150k); unused losses carry forward. On sale, claimed depreciation is recaptured at up to 25%, and gains may owe capital-gains tax (a 1031 exchange can defer both). Figures are a year-1 estimate at your 24.0% rate — not tax advice; consult a CPA.
Schools (NCES district)
- District
- Evansville Vanderburgh School Corporation
- NCES district ID
- 1803450
- Math proficiency
- 36% ▼ -7.00%
- Reading proficiency
- 43% ▼ -3.00%
- Median HH income
- $43,270
- Composite
- 33.41/100
- National rank
- #5471
- State rank
- #153 of 301 in IN
Livability — Evansville
- Score
- 63/100
- State rank
- #416
- US rank
- #15047
Category grades
Schools grade is shown separately in the Schools card above.
Census & demographics
- Census place
- Evansville, IN
- County
- Vanderburgh County · 146,793 people
- City population
- 146,793
- Metro
- Evansville, IN-KY
- Population (ZIP)
- 32,132
- Household income
- $55,910
- Rent vs Own
- Severe rent burden
- 1394.0
Population outlook (Vanderburgh County) Hauer SSP2
- Today (2025)
- 187,038 people
- By 2030
- 188,907 · +1.0%
- By 2040
- 190,272 · +1.7%
- By 2050
- 188,871 · +1.0%
- By 2075
- 180,751 · -3.4%
- By 2100
- 163,015 · -12.8%
Race, ethnicity, and origin ACS 2023
- Neighborhood character
- Predominantly White (71%)
- Race & ethnicity
- White 71% Black 17% Two or more races 6% Hispanic / Latino 6% Asian 1%
- Hispanic origin (detail)
- Mexican 3%
- Common ancestry
- Italian 3% Lithuanian 2% Slovak 1%
- Foreign-born
- 6% · Canada, China
- Languages at home
- 92% English-only · Spanish 4% Other Asian/Pacific 1% French/Haitian/Cajun 1%
Political lean MEDSL · Vanderburgh
- 2024 margin
- R (+12.7) · D 43.0% · R 55.6% · Other 1.4%
- 2008→2024 swing
- -15.1pp toward R · 2008: 2.5pp · 2024: -12.7pp
- All cycles
- 2024: R+12.7 2020: R+9.6 2016: R+16.9 2012: R+10.8 2008: D+2.5
Not yet ingested
- Civics
- —
Market trends
- HPI YoY
- ▼ -124.80%
- Current HPI
- 211.1755
- Rent YoY
- ▲ 7.86%
- Metro
- Evansville, IN-KY
- State GDP YoY
- ▲ 2.90%
- F500 in state
- 18
Industry mix (Fortune 500 HQ in IN)
| Industry | F500 HQs | Revenue |
|---|---|---|
| Industrial Machinery | 2 | $37B |
|
||
| Healthcare | 1 | $177B |
|
||
| Pharmaceuticals | 1 | $45B |
|
||
| Metals / Steel | 1 | $18B |
|
||
| Agriculture | 1 | $17B |
|
||
| Packaging | 1 | $12B |
|
||
Price history
1 event — show timeline
- 2026-06-12 Listed $168,500 IRMLS
Property tax history
-0.7%/yrLatest (2024): $2,391 · +2.3% YoY. Source: county tax records.
Cash-flow waterfall
monthlySold comps — $/sqft
last 12 mo · ≤1 miLoading sold comps…