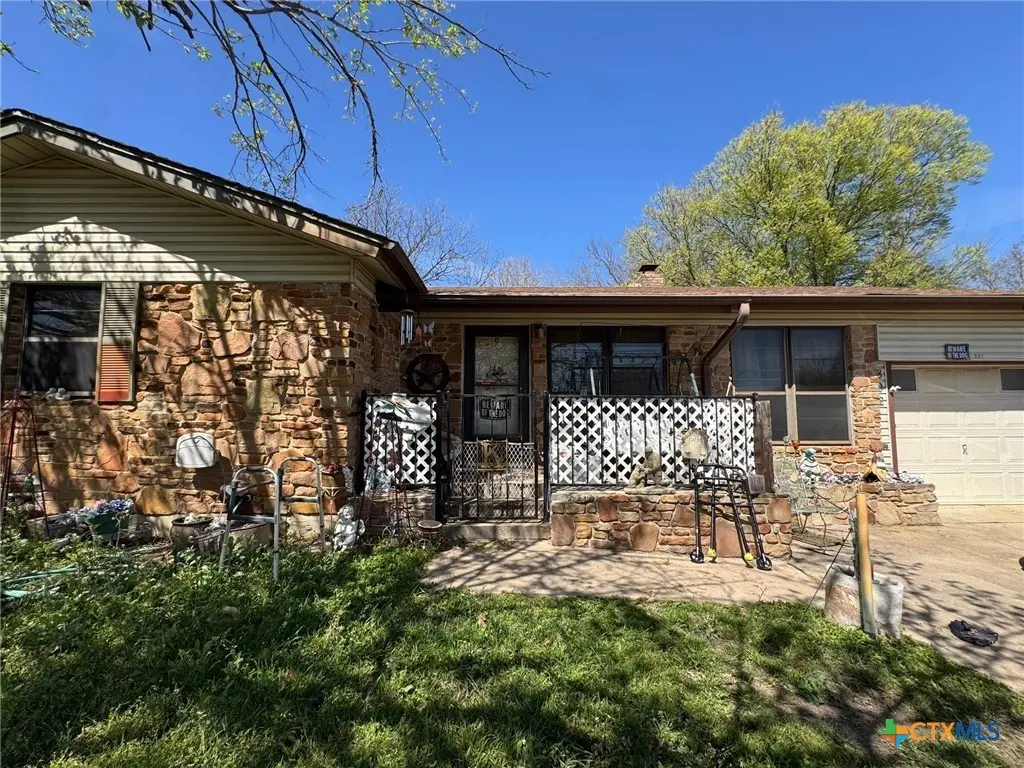
802 S 23rd St · Copperas Cove, TX
Flood risk 1/10 · Minimal
- FEMA flood zone
- X (unshaded)
- Chance of flooding over 30 yrs
- 0.0%
- Est. flood insurance / yr
- $507 – $1,088
Fire risk 5/10 · Moderate
- Est. fire insurance / yr
- $1,222 – $2,270
Heat risk 7/10 · Major
- Hot days now (above 106°F)
- 7 days/yr
- Hot days in 30 yrs
- 23 days/yr
Wind risk 6/10 · Moderate
- Chance of severe wind over 30 yrs
- 51.0%
Air-quality risk 1/10 · Minimal
- Unhealthy air days now
- 0 days/yr
- Unhealthy air days in 30 yrs
- 0 days/yr
Risk factors via First Street. Map © Google.
Why this score? — see what drove the B- grade
The composite is a weighted blend of 9 inputs, each scored 0–100. Each bar is that input's sub-score; the figure is the points it added to the 100-point composite (weight × sub-score).
- Cash flow +25.1/30.0
- ARV discount +15.0/15.0
- DSCR +8.2/10.0
- 1% rule +6.6/10.0
- Schools +3.6/10.0
- Livability +3.2/5.0
- Condition / age +2.5/5.0
- Rent growth +2.4/5.0
- Appreciation +0.0/10.0
$115,000
🖨 Deal sheet (PDF) 📄 Offer letter ✓ Due diligence
Listing remarks
This 3-bedroom, 1.5-bath home is full of potential and ready for your personal touch! Featuring a spacious den and an additional flex room just off the kitchen—perfect for a playroom, home office, or extra living space—this property offers a versatile layout with great possibilities. The backyard includes a storage shed for added convenience and functionality. Ideal for investors or buyers looking to restore and customize, this home is being sold as-is. As part of an estate, there are no seller’s disclosures available. All furniture and furnishings currently in the home will convey with the sale.
Key facts
- Storage shed
- Flex room
- Spacious den
Tags
Property features AI
Exterior
- Parking: Has garage; 1 garage space
- Utilities: Public water; Public trash collection
- Home design: Single-story; Resale property
- Construction: Brick construction; Composition/shingle roof; Pillar/post/pier and slab foundation; Built year sourced from assessor
- Exterior features: Back yard fencing; Exterior storage
Interior
- Kitchen: Water heater
- Bedrooms: Number of bedrooms not provided
- Flooring: Tile
- Bathrooms: 1 full bathroom; 1 half bathroom
- Heating & cooling: Has heating; One cooling unit
- Interior features: Ceiling fan(s); Breakfast area; Tile flooring; Den fireplace
- Laundry & utility: Laundry located inside
Neighborhood map
What this means for you Summary
Snapshot
- This is a 3-bed/2.0-bath single-family listed at $115k.
Deal economics
- At list price, monthly cash flow is $253 ($3k/yr) — positive.
- The deal already cash-flows at list — no discount required.
- Meets the 1% rule at list price ($1k rent vs $115k).
- Recommended offer: $112k (3.0% below list) — sets the bar for market timing.
- Cap rate 8.9% vs local median 3.4% in Copperas Cove — top-decile yield for the area; either an underpriced asset or a hidden risk that comps aren't pricing in. Stress-test before assuming the spread holds.
Location & tenants
- Location reads 65/100 on livability (#706 in TX) — a middle-class / working-renter tenant base. Strengths: cost of living A+, housing A+; Watch: schools C-, employment D+, amenities F.
- Copperas Cove ISD (suburban): math 41% / reading 42% proficiency, ranked #340 of 826 in TX (top 41%) — families likely to look elsewhere, expect single-tenant / working-renter base with shorter leases.
- Market conditions: Rents soft (-0.2%/yr); 608 active listings in the ZIP; 40 comparable units currently listed for rent nearby; rentals lingering (median 45d on market — plan ~5-8 weeks vacancy on turnover, expect pricing pressure); 55% of comp listings sitting > 30 days — soft ceiling on asking rent; 386 units permitted in Coryell County in 2024 (0 in 5+ unit buildings).
Forward outlook
- Local home prices are declining (-3.0%/yr); year-one equity from $795 of loan paydown is wiped out by about $3k of value loss. Plan a longer hold.
Negotiation context
- It's been on market 46 days — a 3% lower offer ($112k) is reasonable based on typical stale-listing flexibility.
Risks & watch-outs
- Climate carrying-cost: major wind risk, 51% chance of damaging wind over 30y; moderate wildfire risk; extreme-heat days projected 7→23/yr by 2055 (HVAC capex compounding) — expect insurance premiums to compound above CPI over the hold.
Questions for the listing agent
- It's been on market 46 days. Have you received any prior offers? Is the seller open to a 3% concession, seller financing, or rate buy-down credit?
- Built in 1971 — when were the roof, HVAC, electrical panel, plumbing, and water heater last replaced?
- Is there a deadline driving the sale (1031 exchange, divorce, estate, relocation)? That informs how much negotiation room exists.
- What's the average days-on-market for RENTAL listings here right now (not sales)? A rising rental-DOM trend means longer vacancies and softer asking-rent achievability than the comps imply.
- What's the recent tenant-quality profile in this submarket — average credit score on applications, eviction rate, late-payment / NSF rate, and stable-employment percentage? A property-management company in the area should have these aggregated.
- How much new for-sale + rental construction is in the pipeline within 1–3 miles? Heavy new supply typically softens prices + rents 12–24 months out; constrained supply supports both.
Investment metrics
- 1% rule
- 1.16% ✓
- Cap rate
- 8.93%
- Cash-on-cash
- 9.42%
- DSCR
- 1.42
- GRM
- 7.2
CMA / ARV
- ARV (on-the-fly)
- $171,684
- Comps found
- 12
Show comp detail 12 sales within ~0.75 mi
| Address | Dist | Beds/Ba | Sqft | Sold | Price | $/sf | Match |
|---|---|---|---|---|---|---|---|
| 802 S 23rd St | 0.00mi | 3/1.5 | 1,506 (0%) | 1mo | $93,730 | $62 | 97 |
| 802 S 13th St | 0.24mi | 3/1.5 | 1,610 (+7%) | 6mo | $190,000 | $118 | 71 |
| 609 S 11th St | 0.33mi | 2/1.0 (-1) | 1,464 (-3%) | 3mo | $83,000 | $57 | 68 |
| 514 S 11th St | 0.31mi | 2/1.0 (-1) | 1,464 (-3%) | 6mo | $112,000 | $77 | 67 |
| 2115 Urbantke Ln | 0.40mi | 2/1.5 (-1) | 1,397 (-7%) | 6mo | $159,900 | $114 | 57 |
| 2215 Terrace | 0.63mi | 3/1.5 | 1,451 (-4%) | 8mo | $209,000 | $144 | 56 |
| 2004 Veterans Ave | 0.22mi | 4/1.5 (+1) | 1,286 (-15%) | 3mo | $160,000 | $124 | 56 |
| 2110 Terrace Dr | 0.54mi | 3/1.0 | 1,377 (-9%) | 4mo | $165,000 | $120 | 53 |
| 2809 Mountain Ave | 0.74mi | 3/2.0 | 1,396 (-7%) | 0mo | $155,000 | $111 | 53 |
| 514 Mary St | 0.48mi | 3/1.5 | 1,296 (-14%) | 9mo | $49,000 | $38 | 44 |
| 505 Curry Ave | 0.60mi | 3/1.5 | 1,338 (-11%) | 8mo | $77,000 | $58 | 44 |
| 605 W Washington Ave | 0.73mi | 4/2.0 (+1) | 1,366 (-9%) | 7mo | $200,000 | $146 | 40 |
Match score weights: distance 35% · size 25% · config 20% · recency 20%. Top-matched comps best support the ARV.
Projected returns pro-forma
-3.0% appreciation · 0.0% rent growth · sell at horizon
- IRR
- -5.5%
- Equity multiple
- 0.80×
- Total profit
- $-6,435
- Equity at exit
- $17,147
- IRR
- 0.0%
- Equity multiple
- 1.00×
- Total profit
- $64
- Equity at exit
- $9,943
Cash invested: $32,200 (down + closing). Projections, not guarantees.
Landlord ↔ Tenant lean methodology
- Overall (STATE)
- 87 Strongly Landlord-Friendly
- State Texas
- 87 Strongly Landlord-Friendly · R+5
- County
- — inherits STATE
- City
- — inherits STATE
ZIP-level market 76522
- Home prices YoY
- -22.4%
- Rents YoY
- -0.2%
- Active inventory
- 608
- Price-to-rent
- 7.2×
Monthly cashflow live
- Estimated rent
- $1,340 high interval (Pro) →
- Mortgage (P&I)
- −$603
- Tax from tax record
- −$155 /mo · $1,855/yr
- Insurance
- −$48
- HOA
- −$0
- Vacancy / Maint / Mgmt
- −$281
- Net cashflow
- $253
Break-even live
Sensitivity live
| Price | -10% $318 | -5% $285 | +0% $253 | +5% $220 | +10% $188 |
|---|---|---|---|---|---|
| Rent | -10% $147 | -5% $200 | +0% $253 | +5% $306 | +10% $359 |
| Rate | -1.0pp $311 | -0.5pp $282 | base $253 | +0.5pp $223 | +1.0pp $193 |
UW: 25.0% down · 7.5% · 30yr · 1.5% tax · 5.0% vac · 8.0% maint · 8.0% mgmt
Financing live
Cash to close
- Down payment
- $28,750
- Closing costs
- $3,450
- Reserves months
- —
- Total cash needed
- —
Loan-product check · same deal, 3 products live
Conventional
25% down · 7.5% · 30yr
- Down + closing
- —
- Monthly P&I
- —
- Monthly cashflow
- —
- DSCR
- —
- Eligible?
- —
Personal DTI + credit; lowest rate.
DSCR
20% down · 8.5% · 30yr
- Down + closing
- —
- Monthly P&I
- —
- Monthly cashflow
- —
- DSCR
- —
- Eligible?
- —
No personal income docs; deal must DSCR.
Hard money
10% down · 12.0% · 12mo
- Down + closing
- —
- Monthly P&I
- —
- Monthly cashflow
- —
- DSCR
- —
- Eligible?
- —
Short-term bridge; refi at stabilization.
Rent comps 40 comps
| Address | Beds | Baths | Sqft | Rent | $/sqft | DOM | Units | Dist |
|---|---|---|---|---|---|---|---|---|
| 806 S 25th St Copperas Cove, TX | 3.0 | 2.0 | 1400 | $1,400 | $1.00 | 45d | 1 | 0.06mi |
| 1006 S 21st St Copperas Cove, TX | 4.0 | 2.0 | 1445 | $1,100 | $0.76 | 45d | 1 | 0.22mi |
| 1005 S 19th St Copperas Cove, TX | 3.0 | 1.5 | 1356 | $1,100 | $0.81 | 45d | 1 | 0.23mi |
| 1007 S 29th St Copperas Cove, TX | 3.0 | 2.0 | 1176 | $1,400 | $1.19 | 15d | 1 | 0.30mi |
| 604 S 11th St Copperas Cove, TX | 3.0 | 2.0 | 1119 | $1,300 | $1.16 | 45d | 1 | 0.32mi |
| 1005 S 11th St Copperas Cove, TX | 4.0 | 2.0 | 1236 | $1,090 | $0.88 | 45d | 1 | 0.37mi |
| 1008 S 31st St Copperas Cove, TX | 3.0 | 2.0 | 1350 | $1,145 | $0.85 | 15d | 1 | 0.38mi |
| 502 S 9th St Copperas Cove, TX | 3.0 | 1.5 | 1479 | $1,150 | $0.78 | 45d | 1 | 0.41mi |
| 309 Myra Lou Ave Copperas Cove, TX | 3.0 | 2.0 | 1269 | $1,125 | $0.89 | 45d | 1 | 0.42mi |
| 1302 S 23rd St Copperas Cove, TX | 4.0 | 1.5 | 1453 | $1,320 | $0.91 | 45d | 1 | 0.42mi |
| 2104 Brantley Ave Copperas Cove, TX | 3.0 | 1.0 | 1140 | $1,495 | $1.31 | 45d | 1 | 0.48mi |
| 504 Highway Ave Unit B Copperas Cove, TX | 2.0 | 1.0 | 1500 | $700 | $0.47 | 45d | 1 | 0.48mi |
| 903 Curry Ave Copperas Cove, TX | 3.0 | 2.5 | 1285 | $1,200 | $0.93 | 24d | 1 | 0.49mi |
| 1201 S 9th St Copperas Cove, TX | 3.0 | 2.0 | 1172 | $1,100 | $0.94 | 24d | 1 | 0.50mi |
| 1204 S 7th St Copperas Cove, TX | 3.0 | 2.0 | 1202 | $1,295 | $1.08 | 45d | 1 | 0.52mi |
| 603 Westview Cir Unit A Copperas Cove, TX | 2.0 | 1.0 | 1537 | $700 | $0.46 | 45d | 1 | 0.54mi |
| 607 Curry Ave Copperas Cove, TX | 3.0 | 1.5 | 1192 | $935 | $0.78 | 24d | 1 | 0.56mi |
| 1202 S 3rd St Copperas Cove, TX | 3.0 | 2.0 | 1056 | $1,175 | $1.11 | 45d | 1 | 0.59mi |
| 509 West Avenue B Copperas Cove, TX | 3.0 | 2.0 | 1339 | $1,175 | $0.88 | 24d | 1 | 0.63mi |
| 1307 Sherry Ln Unit B Copperas Cove, TX | 2.0 | 1.0 | 1775 | $1,299 | $0.73 | 45d | 1 | 0.64mi |
| 414 West Avenue C Unit C Copperas Cove, TX | 3.0 | 2.0 | 1343 | $1,600 | $1.19 | 45d | 1 | 0.65mi |
| 412 West Avenue C Unit C Copperas Cove, TX | 3.0 | 2.0 | 1343 | $1,600 | $1.19 | 22d | 1 | 0.65mi |
| 1002 W Avenue B Unit B Copperas Cove, TX | 2.0 | 2.0 | 1842 | $975 | $0.53 | 45d | 1 | 0.71mi |
| 605 N 11th St Copperas Cove, TX | 3.0 | 2.0 | 1432 | $1,575 | $1.10 | 45d | 1 | 0.79mi |
| 1202 S FM 116 Copperas Cove, TX | 1.0–3.0 | 1.0–2.0 | 922 | $1,560 | $1.69 | 15d | 12 | 0.89mi |
| 611 N 21st St Copperas Cove, TX | 3.0 | 2.0 | 1128 | $1,250 | $1.11 | 15d | 1 | 0.90mi |
| 614 N 21st St Copperas Cove, TX | 3.0 | 2.0 | 1683 | $1,300 | $0.77 | 24d | 1 | 0.91mi |
| 914 Chalk St Copperas Cove, TX | 3.0 | 2.0 | 1107 | $1,200 | $1.08 | 24d | 1 | 1.03mi |
| 809 Shady Ln Copperas Cove, TX | 4.0 | 1.5 | 1900 | $1,600 | $0.84 | 15d | 1 | 1.05mi |
| 806 N 3rd St Unit A Copperas Cove, TX | 3.0 | 2.0 | 1130 | $1,150 | $1.02 | 45d | 1 | 1.05mi |
| 1217 Craig St Copperas Cove, TX | 3.0 | 2.0 | 1341 | $1,575 | $1.17 | 45d | 1 | 1.06mi |
| 604 N Main St Apt D Copperas Cove, TX | 3.0 | 1.5 | 1100 | $900 | $0.82 | 45d | 1 | 1.07mi |
| 1122 Rhonda Lee St Copperas Cove, TX | 3.0 | 2.0 | 1349 | $1,300 | $0.96 | 24d | 1 | 1.09mi |
| 507 Skyline Dr Copperas Cove, TX | 3.0 | 2.0 | 1889 | $2,200 | $1.16 | 45d | 1 | 1.12mi |
| 105 E Reagan Ave Copperas Cove, TX | 2.0 | 1.0 | 1758 | $675 | $0.38 | 45d | 1 | 1.12mi |
| 3004 Sundown Ln Copperas Cove, TX | 4.0 | 2.0 | 1608 | $1,895 | $1.18 | 24d | 1 | 1.13mi |
| 902 Lynn Ln Copperas Cove, TX | 3.0 | 2.0 | 1661 | $1,600 | $0.96 | 15d | 1 | 1.23mi |
| 820 Michelle Dr Copperas Cove, TX | 3.0 | 2.0 | 1053 | $1,095 | $1.04 | 24d | 1 | 1.23mi |
| 906 Tanner Rd Copperas Cove, TX | 3.0 | 2.0 | 1725 | $1,550 | $0.90 | 15d | 1 | 1.27mi |
| 805 Stockdale Rd Copperas Cove, TX | 3.0 | 2.0 | 1501 | $1,700 | $1.13 | 15d | 1 | 1.29mi |
Listing history 3 events
-
2026-05-05status Pending
-
2026-04-26historical Active Under Contract
-
2026-03-20$115,000 Active
ⓘ Source: listings_history table (triggers on properties + properties_extension) + one-shot
backfill from property_details.listing_events for pre-trigger history.
Tax reassessment forecast TX · Resets to sale price
- Current annual tax
- $1,855 · $155/mo
- Projected year-2 tax
- $2,104 · $175/mo
- Expected delta
- +$250/yr (+$21/mo · 13.5%)
ⓘ Screening estimate from a state-policy table — verify with the county assessor before closing.
Climate risk First Street
- Flood 1/10 Low FEMA zone X (unshaded) · 0% chance over 30 yrs
- Wildfire 5/10 Major
- Heat 7/10 Severe 7 d/yr ≥106°F today · 23 d/yr by 30 yrs out
- Wind 6/10 Major 51% chance of damaging wind over 30 yrs
- Air quality 1/10 Low 0 unhealthy d/yr today · 0 by 30 yrs out
Nearby sold comps map
Loading sold comps map…
Walkable amenities ~0.75 mi
Loading nearby amenities…
Taxation est. · year 1
- Rental income
- $16,076
- − Mortgage interest
- −$6,442
- − Property taxes
- −$1,855
- − Insurance
- −$575
- − Repairs & maintenance
- −$1,286
- − Management
- −$1,286
- − Depreciation
- −$3,345
- Taxable income
- $1,287
- Est. tax owed @ 24.0%
- −$309
- After-tax cash flow
- $2,724/yr
For passive investors: Depreciation is non-cash, so a rental often shows a tax loss while cash-flowing — sheltering income. Rental losses are passive: they offset passive income freely, and up to $25,000/yr can offset ordinary (W-2) income if you actively participate and your MAGI is under $100k (phasing out to $0 by $150k); unused losses carry forward. On sale, claimed depreciation is recaptured at up to 25%, and gains may owe capital-gains tax (a 1031 exchange can defer both). Figures are a year-1 estimate at your 24.0% rate — not tax advice; consult a CPA.
Schools (NCES district)
- District
- Copperas Cove ISD
- NCES district ID
- 4815240
- Math proficiency
- 41% ▼ -6.00%
- Reading proficiency
- 42% ▼ -2.00%
- Median HH income
- $51,072
- Composite
- 35.85/100
- National rank
- #4822
- State rank
- #340 of 826 in TX
Livability — Copperas Cove
- Score
- 65/100
- State rank
- #706
- US rank
- #13158
Category grades
Schools grade is shown separately in the Schools card above.
Census & demographics
- Census place
- Copperas Cove, TX
- County
- Coryell County · 61,053 people
- City population
- 42,118
- Metro
- Killeen-Temple, TX
- Population (ZIP)
- 42,118
- Household income
- $72,206
- Rent vs Own
- Severe rent burden
- 1019.0
Population outlook (Coryell County) Hauer SSP2
- Today (2025)
- 75,485 people
- By 2030
- 75,627 · +0.2%
- By 2040
- 74,898 · -0.8%
- By 2050
- 74,221 · -1.7%
- By 2075
- 72,688 · -3.7%
- By 2100
- 66,862 · -11.4%
Race, ethnicity, and origin ACS 2023
- Neighborhood character
- Diverse neighborhood (Simpson 0.66)
- Race & ethnicity
- White 53% Hispanic / Latino 21% Two or more races 20% Black 14% Asian 2%
- Hispanic origin (detail)
- Mexican 11% Puerto Rican 6%
- Common ancestry
- Romanian 2% Italian 2% Lithuanian 2%
- Foreign-born
- 7% · Canada, South Korea
- Languages at home
- 85% English-only · Spanish 10% German/W. Germanic 2% Other Asian/Pacific 1%
Political lean MEDSL · Coryell
- 2024 margin
- Solid R (+40.7) · D 29.1% · R 69.8% · Other 1.1%
- 2008→2024 swing
- -13.8pp toward R · 2008: -26.9pp · 2024: -40.7pp
- All cycles
- 2024: R+40.7 2020: R+33.5 2016: R+39.5 2012: R+36.6 2008: R+26.9
Not yet ingested
- Civics
- —
Market trends
- HPI YoY
- ▼ -53.11%
- Current HPI
- 183.9452
- Rent YoY
- ▼ -0.25%
- Metro
- Killeen-Temple, TX
- State GDP YoY
- ▲ 3.95%
- F500 in state
- 110
Industry mix (Fortune 500 HQ in TX)
| Industry | F500 HQs | Revenue |
|---|---|---|
| Energy | 16 | $1,198B |
|
||
| Technology | 5 | $198B |
|
||
| Engineering / Construction | 4 | $72B |
|
||
| Energy Services | 3 | $60B |
|
||
| Utilities | 3 | $41B |
|
||
| Healthcare | 2 | $330B |
|
||
Price history
3 events — show timeline
- 2026-05-05 Pending — CTXMLS
- 2026-04-26 Contingent — CTXMLS
- 2026-03-20 Listed $115,000 CTXMLS
Property tax history
-0.2%/yrLatest (2025): $1,855 · +11.9% YoY. Source: county tax records.
Cash-flow waterfall
monthlySold comps — $/sqft
last 12 mo · ≤1 miLoading sold comps…