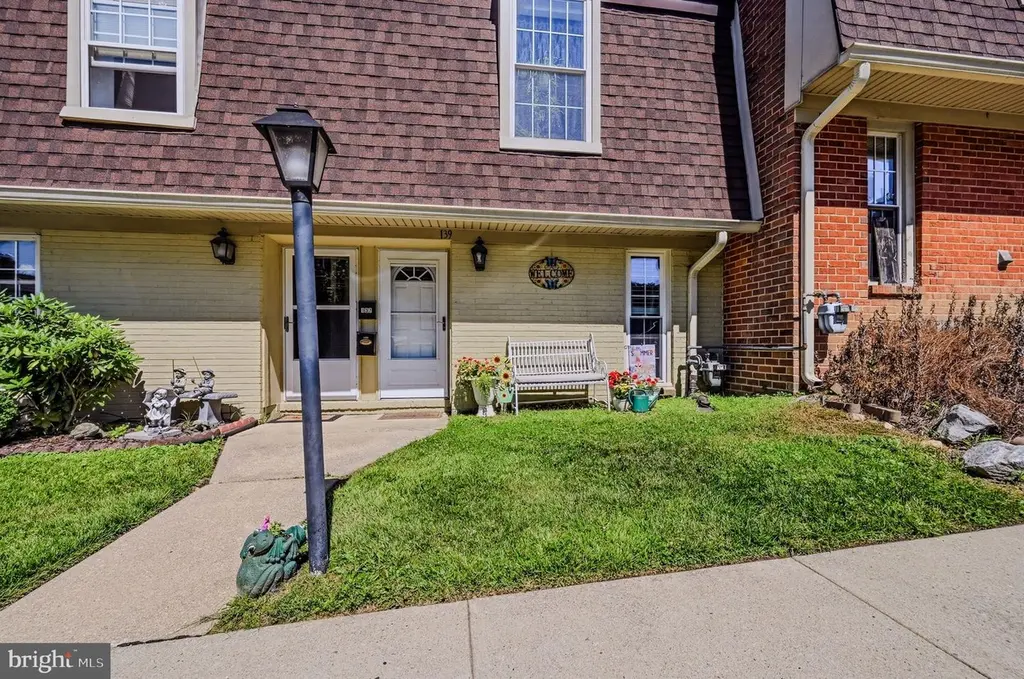
139 King William St · Newark, DE
Flood risk 1/10 · Minimal
- FEMA flood zone
- X (unshaded)
- Chance of flooding over 30 yrs
- 0.0%
- Est. flood insurance / yr
- $473 – $860
Fire risk 1/10 · Minimal
- Est. fire insurance / yr
- $476 – $884
Heat risk 7/10 · Major
- Hot days now (above 104°F)
- 7 days/yr
- Hot days in 30 yrs
- 15 days/yr
Wind risk 6/10 · Moderate
- Chance of severe wind over 30 yrs
- 27.0%
Air-quality risk 3/10 · Minor
- Unhealthy air days now
- 2 days/yr
- Unhealthy air days in 30 yrs
- 3 days/yr
Risk factors via First Street. Map © Google.
Why this score? — see what drove the D grade
The composite is a weighted blend of 9 inputs, each scored 0–100. Each bar is that input's sub-score; the figure is the points it added to the 100-point composite (weight × sub-score).
- Cash flow +15.6/30.0
- 1% rule +5.1/10.0
- DSCR +4.8/10.0
- Livability +4.2/5.0
- Rent growth +3.9/5.0
- Schools +2.5/10.0
- Condition / age +2.5/5.0
- ARV discount +1.6/15.0
- Appreciation +0.0/10.0
$215,000
🖨 Deal sheet 📄 Offer letter ✓ Due diligence
Listing remarks
Welcome to 139 King William St, a beautifully updated townhome nestled in one of Newark's most desirable locations! Backing directly to the scenic White Clay Creek State Park, this home offers a rare combination of privacy, nature, and convenience. Enjoy peaceful wooded views from your backyard and take advantage of being just a 5-minute walk to the park's extensive trail system, perfect for hiking, biking, and outdoor recreation. Inside, you'll find numerous recent updates that provide peace of mind and modern comfort, including a new roof (2026), energy-efficient windows (2023), AC unit (2024), hot water heater (2020), kitchen appliances (2020), washer/dryer (2022), kitchen and dining roo
Key facts
- Community pool
- Updated townhome
- Access to dining
Tags
Property features AI
Finance
- Financial info: Ownership is fee simple; Assessed improvement and land values recorded (assessor); Property manager present
- HOA & community: Condo/co-op fee of $300 monthly
Exterior
- Parking: Parking lot
- Utilities: Public water; Public sewer; Electric cooling fuel; Natural gas heating and hot water
- Home design: Interior townhouse/rowhouse; Entry level is 1
- Construction: Mixed construction materials; Slab foundation; Pets allowed with no pet restrictions
- Exterior features: Community pool; Above-grade and below-grade structures noted; Property located within city limits
Interior
- Bedrooms: Two bedrooms on the first upper level
- Bathrooms: One full bathroom
- Heating & cooling: Forced air heating; Central air conditioning; Hot water heated by natural gas
- Interior features: No basement; Living area measured by assessor
Neighborhood map
What this means for you Summary
Snapshot
- This is a 2-bed/1.5-bath townhouse listed at $215k.
Deal economics
- At list price, monthly cash flow is $89 ($1k/yr) — positive.
- The deal already cash-flows at list — no discount required.
- Meets the 1% rule at list price ($2k rent vs $215k).
- Cap rate 6.8% vs local median 4.4% in Newark — top-decile yield for the area; either an underpriced asset or a hidden risk that comps aren't pricing in. Stress-test before assuming the spread holds.
Location & tenants
- Location reads 85/100 on livability (#1 in DE, #569 nationally) — a professional / high-income tenant draw. Strengths: amenities A+, commute A+, health & safety A+; Watch: crime C-.
- Christina School District (suburban): math 22% / reading 33% proficiency, ranked #18 of 26 in DE (top 69%) — low school quality limits family demand, transient renter base, plan for 1-2y turnover.
- Market conditions: Rents rising fast (+5.5%/yr); 127 active listings in the ZIP; 11 comparable units currently listed for rent nearby; rentals leasing fast (median 5d on market — plan ~1-2 weeks tenant-placement turnaround); solid renter incomes; 1,367 units permitted in New Castle County in 2024 (201 in 5+ unit buildings).
Forward outlook
- Local home prices are declining (-3.0%/yr); year-one equity from $1k of loan paydown is wiped out by about $6k of value loss. Plan a longer hold.
- New Castle County population projected at +9% by 2050 — modest demand growth; plan on rents tracking national, not racing it.
Negotiation context
- Only 1 days on market — expect competitive offers; lowballing is unlikely to land.
- Current owner paid $18k; list at $215k implies a 1094% gain — meaningful room to come down on a strong offer.
Risks & watch-outs
- Climate carrying-cost: major wind risk, 27% chance of damaging wind over 30y; extreme-heat days projected 7→15/yr by 2055 (HVAC capex compounding) — expect insurance premiums to compound above CPI over the hold.
Questions for the listing agent
- Built in 1969 — when were the roof, HVAC, electrical panel, plumbing, and water heater last replaced?
- What does the HOA fee cover, when was the last increase, and are there any pending special assessments or reserve-fund shortfalls?
- Is there a deadline driving the sale (1031 exchange, divorce, estate, relocation)? That informs how much negotiation room exists.
- Schools are B-rated — typically a magnet for longer-tenancy family renters. What's the average tenant stay here, and is there a school-zone premium baked into asking?
- The area grade is low — what's the realistic commute time and amenity access for the typical tenant pool here? Any planned neighborhood developments (good or bad) we should know about?
- What's the average days-on-market for RENTAL listings here right now (not sales)? A rising rental-DOM trend means longer vacancies and softer asking-rent achievability than the comps imply.
- What's the recent tenant-quality profile in this submarket — average credit score on applications, eviction rate, late-payment / NSF rate, and stable-employment percentage? A property-management company in the area should have these aggregated.
- How much new for-sale + rental construction is in the pipeline within 1–3 miles? Heavy new supply typically softens prices + rents 12–24 months out; constrained supply supports both.
Investment metrics
- 1% rule
- 1.01% ✓
- Cap rate
- 6.79%
- Cash-on-cash
- 1.78%
- DSCR
- 1.08
- GRM
- 8.2
CMA / ARV
- ARV (on-the-fly)
- $190,000
- Comps found
- 9
Show comp detail 9 sales within ~0.75 mi
| Address | Dist | Beds/Ba | Sqft | Sold | Price | $/sf | Match |
|---|---|---|---|---|---|---|---|
| 170 King William St #170 | 0.05mi | 2/1.0 | 1,000 (0%) | 1mo | $190,000 | $190 | 95 |
| 174 King William St #174 | 0.04mi | 2/1.0 | 1,000 (0%) | 13mo | $188,000 | $188 | 85 |
| 112 King William St #112 | 0.07mi | 2/1.0 | 1,000 (0%) | 14mo | $183,000 | $183 | 83 |
| 144 King William St #144 | 0.06mi | 2/1.5 | 1,000 (0%) | 23mo | $189,900 | $190 | 78 |
| 140 King William St #140 | 0.06mi | 2/1.0 | 1,000 (0%) | 21mo | $181,500 | $182 | 78 |
| 109 Gateway Dr | 0.72mi | 2/1.5 | 1,125 (+12%) | 10mo | $260,000 | $231 | 38 |
| 180 Madison Dr | 0.73mi | 3/1.0 (+1) | 1,125 (+12%) | 4mo | $268,000 | $238 | 35 |
| 181 Madison Dr | 0.71mi | 3/1.0 (+1) | 1,125 (+12%) | 6mo | $250,000 | $222 | 34 |
| 115 Gateway Dr #8 | 0.70mi | 2/2.5 | 1,125 (+12%) | 14mo | $241,000 | $214 | 31 |
Match score weights: distance 35% · size 25% · config 20% · recency 20%. Top-matched comps best support the ARV.
Projected returns pro-forma
-3.0% appreciation · 5.45% rent growth · sell at horizon
- IRR
- -10.5%
- Equity multiple
- 0.61×
- Total profit
- $-23,547
- Equity at exit
- $32,057
- IRR
- 2.3%
- Equity multiple
- 1.18×
- Total profit
- $10,989
- Equity at exit
- $18,589
Cash invested: $60,200 (down + closing). Projections, not guarantees.
Landlord ↔ Tenant lean methodology
- Overall (STATE)
- 70 Landlord-Friendly
- State Delaware
- 70 Landlord-Friendly · D+7
- County
- — inherits STATE
- City
- — inherits STATE
ZIP-level market 19711
- Rents YoY
- 5.5%
- Active inventory
- 127
- Price-to-rent
- 8.2×
Monthly cashflow live
- Estimated rent
- $2,174 high interval (Pro) →
- Mortgage (P&I)
- −$1,127
- Tax from tax record
- −$111 /mo · $1,334/yr
- Insurance
- −$90
- HOA
- −$300
- Vacancy / Maint / Mgmt
- −$457
- Net cashflow
- $89
Break-even live
UW: 25.0% down · 7.5% · 30yr · 1.5% tax · 5.0% vac · 8.0% maint · 8.0% mgmt
Financing live
Cash to close
- Down payment
- $53,750
- Closing costs
- $6,450
- Reserves months
- —
- Total cash needed
- —
Loan-product check · same deal, 3 products live
Conventional
25% down · 7.5% · 30yr
- Down + closing
- —
- Monthly P&I
- —
- Monthly cashflow
- —
- DSCR
- —
- Eligible?
- —
Personal DTI + credit; lowest rate.
DSCR
20% down · 8.5% · 30yr
- Down + closing
- —
- Monthly P&I
- —
- Monthly cashflow
- —
- DSCR
- —
- Eligible?
- —
No personal income docs; deal must DSCR.
Hard money
10% down · 12.0% · 12mo
- Down + closing
- —
- Monthly P&I
- —
- Monthly cashflow
- —
- DSCR
- —
- Eligible?
- —
Short-term bridge; refi at stabilization.
Rent comps 11 comps
| Address | Beds | Baths | Sqft | Rent | $/sqft | DOM | Units | Dist |
|---|---|---|---|---|---|---|---|---|
| 1 Nathan Hale Ct Newark, DE | 3.0 | 2.0 | 1350 | $2,300 | $1.70 | 18d | 1 | 0.60mi |
| 100 Christina Mill Dr Newark, DE | 1.0–2.0 | 1.0–2.0 | 827 | $2,269 | $2.74 | 1d | 9 | 0.62mi |
| 54 Madison Dr Newark, DE | 3.0 | 1.0 | 1400 | $1,849 | $1.32 | 18d | 1 | 0.87mi |
| 53 Madison Dr Newark, DE | 3.0 | 1.0 | 1125 | $2,200 | $1.96 | 1d | 1 | 0.90mi |
| 650 Lehigh Rd Newark, DE | 1.0–2.0 | 1.0 | 871 | $1,794 | $2.06 | 1d | 25 | 0.93mi |
| 250 S Main St Ste 107 Newark, DE | 2.0–4.0 | 1.0–3.0 | 1567 | $1,760 | $1.12 | 1d | 1 | 1.02mi |
| 1211 Nottingham Rd Newark, DE | 2.0 | 2.0 | 1400 | $1,795 | $1.28 | 1d | 1 | 1.29mi |
| 1219 Nottingham Rd Unit 1219 Newark, DE | 2.0 | 1.0 | 1000 | $1,985 | $1.99 | 12d | 1 | 1.30mi |
| 112 W Park Pl Newark, DE | 3.0 | 2.0 | 1475 | $3,250 | $2.20 | 12d | 1 | 1.30mi |
| 112 W Park Pl Newark, DE | 3.0 | 2.0 | 1315 | $3,000 | $2.28 | 43d | 1 | 1.30mi |
| 317 Willow Dr Elkton, MD | 3.0 | 1.5 | 1125 | $1,900 | $1.69 | 5d | 1 | 1.45mi |
HOA detail
- Monthly dues
- $300 · $3,600/yr
- Likely covers
- water
Listing history 2 events
-
2026-06-18remarks 699-char remark
-
2026-06-18$215,000 Active 1 DOM
ⓘ Source: listings_history table (triggers on properties + properties_extension) + one-shot
backfill from property_details.listing_events for pre-trigger history.
Tax reassessment forecast DE · Partial reset (capped growth)
- Current annual tax
- $1,334 · $111/mo
- Projected year-2 tax
- $1,334 · $111/mo
- Expected delta
- $0/yr ($0/mo · 0.0%)
ⓘ Screening estimate from a state-policy table — verify with the county assessor before closing.
Climate risk First Street
- Flood 1/10 Low FEMA zone X (unshaded) · 0% chance over 30 yrs
- Wildfire 1/10 Low
- Heat 7/10 Severe 7 d/yr ≥104°F today · 15 d/yr by 30 yrs out
- Wind 6/10 Major 27% chance of damaging wind over 30 yrs
- Air quality 3/10 Moderate 2 unhealthy d/yr today · 3 by 30 yrs out
Nearby sold comps map
Loading sold comps map…
Walkable amenities ~0.75 mi
Loading nearby amenities…
Taxation est. · year 1
- Rental income
- $26,088
- − Mortgage interest
- −$12,043
- − Property taxes
- −$1,334
- − Insurance
- −$1,075
- − Repairs & maintenance
- −$2,087
- − Management
- −$2,087
- − HOA
- −$3,600
- − Depreciation
- −$6,255
- Taxable loss
- −$2,393
- Est. tax savings @ 24.0%
- +$574
- After-tax cash flow
- $1,645/yr
For passive investors: Depreciation is non-cash, so a rental often shows a tax loss while cash-flowing — sheltering income. Rental losses are passive: they offset passive income freely, and up to $25,000/yr can offset ordinary (W-2) income if you actively participate and your MAGI is under $100k (phasing out to $0 by $150k); unused losses carry forward. On sale, claimed depreciation is recaptured at up to 25%, and gains may owe capital-gains tax (a 1031 exchange can defer both). Figures are a year-1 estimate at your 24.0% rate — not tax advice; consult a CPA.
Schools (NCES district)
- District
- Christina School District
- NCES district ID
- 1000200
- Math proficiency
- 22% ▼ -12.00%
- Reading proficiency
- 33% ▼ -5.00%
- Median HH income
- $58,838
- Composite
- 24.93/100
- National rank
- #7567
- State rank
- #18 of 26 in DE
Livability — Newark
- Score
- 85/100
- State rank
- #1
- US rank
- #569
Category grades
Schools grade is shown separately in the Schools card above.
Census & demographics
- Census place
- Newark, DE
- County
- New Castle County · 483,412 people
- City population
- 135,862
- Metro
- Philadelphia-Camden-Wilmington, PA-NJ-DE-MD
- Population (ZIP)
- 49,432
- Household income
- $95,403
- Rent vs Own
- Severe rent burden
- 2167.0
Population outlook (New Castle County) Hauer SSP2
- Today (2025)
- 594,686 people
- By 2030
- 609,164 · +2.4%
- By 2040
- 632,154 · +6.3%
- By 2050
- 649,068 · +9.1%
- By 2075
- 687,771 · +15.7%
- By 2100
- 694,961 · +16.9%
Race, ethnicity, and origin ACS 2023
- Neighborhood character
- Predominantly White (69%)
- Race & ethnicity
- White 69% Two or more races 9% Hispanic / Latino 9% Black 9% Asian 8%
- Hispanic origin (detail)
- Mexican 3% Puerto Rican 4%
- Common ancestry
- Romanian 5% Slovak 2% Italian 2%
- Foreign-born
- 12% · China, Canada, Vietnam
- Languages at home
- 84% English-only · Spanish 5% Other Indo-European 3% Chinese 3%
Political lean MEDSL · New Castle
- 2024 margin
- Solid D (+32.6) · D 65.5% · R 32.9% · Other 1.6%
- 2008→2024 swing
- -8.1pp toward R · 2008: 40.6pp · 2024: 32.6pp
- All cycles
- 2024: D+32.6 2020: D+37.1 2016: D+29.6 2012: D+34.1 2008: D+40.6
Not yet ingested
- Civics
- —
Market trends
- HPI YoY
- ▼ -214.42%
- Current HPI
- 225.6592
- Rent YoY
- ▲ 5.45%
- Metro
- Philadelphia-Camden-Wilmington, PA-NJ-DE-MD
- State GDP YoY
- —
- F500 in state
- 0
Price history
+442.9% since first listed3 events — show timeline
- 2026-06-18 Listed $215,000 BRIGHT MLS
- 2019-11-20 Sold (Public Records) $18,000 Public Records
- 1983-03-01 Sold (Public Records) $39,600 Public Records
Property tax history
+3.9%/yrLatest (2024): $1,334 · +2.5% YoY. Source: county tax records.
Cash-flow waterfall
monthlySold comps — $/sqft
last 12 mo · ≤1 miLoading sold comps…