 Duplex
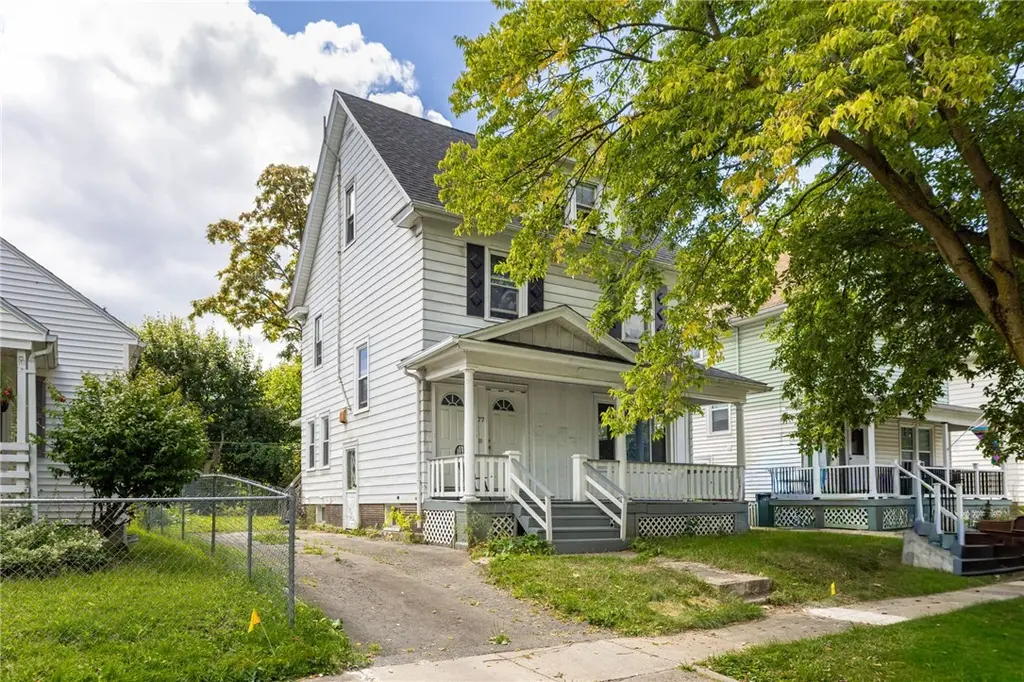
77 Jackson St · Rochester, NY
Flood risk 1/10 · Minimal
- FEMA flood zone
- X (unshaded)
- Chance of flooding over 30 yrs
- 0.0%
- Est. flood insurance / yr
- $473 – $860
Fire risk 1/10 · Minimal
- Est. fire insurance / yr
- $691 – $1,283
Heat risk 2/10 · Minimal
- Hot days now (above 95°F)
- 7 days/yr
- Hot days in 30 yrs
- 15 days/yr
Wind risk 1/10 · Minimal
- Chance of severe wind over 30 yrs
- —
Air-quality risk 2/10 · Minimal
- Unhealthy air days now
- 1 days/yr
- Unhealthy air days in 30 yrs
- 2 days/yr
Risk factors via First Street. Map © Google.
Why this score? — see what drove the B+ grade
The composite is a weighted blend of 9 inputs, each scored 0–100. Each bar is that input's sub-score; the figure is the points it added to the 100-point composite (weight × sub-score).
- Cash flow +30.0/30.0
- ARV discount +15.0/15.0
- 1% rule +10.0/10.0
- DSCR +10.0/10.0
- Rent growth +4.7/5.0
- Livability +3.8/5.0
- Condition / age +2.5/5.0
- Schools +1.9/10.0
- Appreciation +0.0/10.0
$125,000
🖨 Deal sheet (PDF) 📄 Offer letter ✓ Due diligence
Multi-family units
County records classify this as Multi-Family (2-4 Unit). Listing-text estimate: 2 units. confirmed
Listing remarks MLS
Duplex with NEW: Roof, Furnaces, Water Heaters, and Separate Elec Panels, and Vinyl Windows. This well-maintained duplex currently rents for $700 and $600 so there is room for upside. The upper unit is a 3 Bedroom with 1 bath and a partially finished attic. The lower unit is a 1 bedroom with a large walk-in closet or nursery with 1 bath.
Key facts
- 4,560 sq ft lot
- 2 garage spots
- Built 1926
Property features AI
Finance
- Financial info: Two-unit property with separate gas and electric meters; Professional management handles operating expenses; Owner pays hot water; rent includes hot water
Exterior
- Parking: Two-car garage; Two or more off-street parking spaces
- Utilities: Public water connected; Sewer connected; Cable available; Circuit breaker electrical
- Home design: Two-story building; Resale property; Existing construction
- Construction: Aluminum siding; Copper plumbing; Asphalt roof; Block foundation; Built (existing)
- Exterior features: Near public transit; Rectangular residential lot; City street frontage
Interior
- Flooring: Hardwood flooring; Laminate flooring; Varied flooring
- Bathrooms: Two full bathrooms
- Heating & cooling: Gas forced-air heating; Gas water heater
- Interior features: Attic
Neighborhood map
What this means for you Summary
Snapshot
- This is a 2 × 2-bed/1.0-bath units multifamily listed at $125k.
Deal economics
- At list price, monthly cash flow is $1k ($16k/yr) — positive. Per door: $649/mo.
- The deal already cash-flows at list — no discount required.
- Meets the 1% rule at list price ($3k rent vs $125k).
- Cap rate 18.8% vs local median 9.3% in Rochester — top-decile yield for the area; either an underpriced asset or a hidden risk that comps aren't pricing in. Stress-test before assuming the spread holds.
Location & tenants
- Location reads 76/100 on livability (#222 in NY, #3,482 nationally) — a middle-class / working-renter tenant base. Strengths: commute A+, cost of living A+, housing A+; Watch: schools D+, crime F, employment F.
- Rochester City School District (urban): math 21% / reading 26% proficiency, ranked #589 of 590 in NY (top 100%) — low school quality limits family demand, transient renter base, plan for 1-2y turnover; 82% free/reduced lunch — lower-income household profile, screen leases tightly.
- Market conditions: Rents rising fast (+8.9%/yr); 114 active listings in the ZIP; 14 comparable units currently listed for rent nearby; rentals leasing fast (median 11d on market — plan ~1-2 weeks tenant-placement turnaround); lower-income renter base — watch delinquency; 1,169 units permitted in Monroe County in 2024 (591 in 5+ unit buildings).
- At $2,670/mo this rent would consume 91% of the median local household income ($35k/yr) (locally 2756% of renters already pay >50% of income on rent) — very limited rent-growth headroom before tenants either downsize or default.
Forward outlook
- Local home prices are declining (-3.0%/yr); year-one equity from $864 of loan paydown is wiped out by about $4k of value loss. Plan a longer hold.
- Monroe County population projected to shrink 6% by 2050 — rents likely to lag national; underwrite the cash flow, not the appreciation.
- At projected returns (-3.0% appreciation + 8.0% rent growth), your $35k cash investment doubles in ~3 years — after that, you're playing with house money.
Negotiation context
- Only 7 days on market — expect competitive offers; lowballing is unlikely to land.
- 8 sale attempts since 8y ago with the ask held roughly flat each time — persistent listings suggest the price (not the market) is what's stuck; bring a comps-based counter.
Risks & watch-outs
- Watch-outs: built in 1926 — expect roof / HVAC / electrical / plumbing capex.
Questions for the listing agent
- Can we see the unit-by-unit rent roll, current vacancy, and any below-market leases? What's the average tenancy length?
- What capital expenditures (roof, boiler, parking lot, exteriors) have been made in the last 5 years, and what's planned in the next 2?
- Built in 1926 — when were the roof, HVAC, electrical panel, plumbing, and water heater last replaced?
- Is there a deadline driving the sale (1031 exchange, divorce, estate, relocation)? That informs how much negotiation room exists.
- Schools are D-rated, which usually means shorter tenancies and higher turnover. Who's the typical renter profile here, and what's been the actual vacancy rate?
- Crime grade is F in this area — have there been break-ins, vandalism, or insurance claims at this property in the last 3 years? What carrier currently insures it and at what premium?
- What's the average days-on-market for RENTAL listings here right now (not sales)? A rising rental-DOM trend means longer vacancies and softer asking-rent achievability than the comps imply.
- What's the recent tenant-quality profile in this submarket — average credit score on applications, eviction rate, late-payment / NSF rate, and stable-employment percentage? A property-management company in the area should have these aggregated.
- How much new apartment / multifamily construction is in the pipeline within 1–3 miles? Heavy new supply (>2% of stock underway) typically softens rents 12–24 months out; light construction supports rent growth.
Investment metrics
- 1% rule
- 2.14% ✓
- Cap rate
- 18.76%
- Cash-on-cash
- 44.52%
- DSCR
- 2.98
- GRM
- 3.9
CMA / ARV
- ARV (median comp)
- $194,220
- List price
- $125,000
- Delta
- -35.64%
- Verdict
- UNDERPRICED
- Comps
- 20 within 1.0 mi
Show comp detail 9 sales within ~0.75 mi
| Address | Dist | Beds/Ba | Sqft | Sold | Price | $/sf | Match |
|---|---|---|---|---|---|---|---|
| 1509 Norton St | 0.16mi | 4/2.0 | 1,888 (+5%) | 10mo | $140,000 | $74 | 77 |
| 87 Newcomb St | 0.52mi | 4/2.0 | 1,760 (-2%) | 6mo | $152,000 | $86 | 66 |
| 415 Fernwood Ave | 0.49mi | 4/2.0 | 1,636 (-9%) | 14mo | $163,000 | $100 | 49 |
| 15 Patt St | 0.48mi | 5/2.0 (+1) | 1,751 (-3%) | 23mo | $105,000 | $60 | 48 |
| 1744 Clifford Ave | 0.70mi | 5/2.5 (+1) | 1,832 (+2%) | 15mo | $72,000 | $39 | 46 |
| 546 Bernard St | 0.68mi | 4/2.5 | 1,876 (+4%) | 20mo | $140,000 | $75 | 42 |
| 115 Ernst St | 0.74mi | 4/2.0 | 2,016 (+12%) | 4mo | $59,900 | $30 | 42 |
| 72 Holbrooke St | 0.49mi | 4/2.0 | 1,580 (-12%) | 20mo | $89,900 | $57 | 40 |
| 17-19 Newcomb St | 0.62mi | 4/2.0 | 2,016 (+12%) | 24mo | $67,500 | $33 | 32 |
Match score weights: distance 35% · size 25% · config 20% · recency 20%. Top-matched comps best support the ARV.
Projected returns pro-forma
-3.0% appreciation · 8.0% rent growth · sell at horizon
- IRR
- 47.0%
- Equity multiple
- 3.19×
- Total profit
- $76,572
- Equity at exit
- $18,638
- IRR
- 54.8%
- Equity multiple
- 7.78×
- Total profit
- $237,433
- Equity at exit
- $10,808
Cash invested: $35,000 (down + closing). Projections, not guarantees.
Landlord ↔ Tenant lean methodology
- Overall (STATE)
- 15 Strongly Tenant-Friendly
- State New York
- 15 Strongly Tenant-Friendly · D+10
- County
- — inherits STATE
- City
- — inherits STATE
ZIP-level market 14621
- Home prices YoY
- -4.0%
- Rents YoY
- 8.9%
- Active inventory
- 114
- Price-to-rent
- 7.8×
Monthly cashflow live
- Estimated rent
- $2,670 high interval (Pro) →
- Mortgage (P&I)
- −$656
- Tax from tax record
- −$103 /mo · $1,237/yr
- Insurance
- −$52
- HOA
- −$0
- Vacancy / Maint / Mgmt
- −$561
- Net cashflow
- $1,299
Break-even live
Sensitivity live
| Price | -10% $1,369 | -5% $1,334 | +0% $1,299 | +5% $1,263 | +10% $1,228 |
|---|---|---|---|---|---|
| Rent | -10% $1,088 | -5% $1,193 | +0% $1,299 | +5% $1,404 | +10% $1,510 |
| Rate | -1.0pp $1,362 | -0.5pp $1,330 | base $1,299 | +0.5pp $1,266 | +1.0pp $1,233 |
2-unit breakdown (identical units grouped — click to expand)
| Units | Beds | Baths | Est. rent |
|---|---|---|---|
| 2× units | 2 | 1 | $2,670 |
| #1 | 2 | 1 | $1,335 |
| #2 | 2 | 1 | $1,335 |
| Total (2 units) | $2,670 | ||
UW: 25.0% down · 7.5% · 30yr · 1.5% tax · 5.0% vac · 8.0% maint · 8.0% mgmt
Financing live
Cash to close
- Down payment
- $31,250
- Closing costs
- $3,750
- Reserves months
- —
- Total cash needed
- —
Loan-product check · same deal, 3 products live
Conventional
25% down · 7.5% · 30yr
- Down + closing
- —
- Monthly P&I
- —
- Monthly cashflow
- —
- DSCR
- —
- Eligible?
- —
Personal DTI + credit; lowest rate.
DSCR
20% down · 8.5% · 30yr
- Down + closing
- —
- Monthly P&I
- —
- Monthly cashflow
- —
- DSCR
- —
- Eligible?
- —
No personal income docs; deal must DSCR.
Hard money
10% down · 12.0% · 12mo
- Down + closing
- —
- Monthly P&I
- —
- Monthly cashflow
- —
- DSCR
- —
- Eligible?
- —
Short-term bridge; refi at stabilization.
Rent comps 14 comps
| Address | Beds | Baths | Sqft | Rent | $/sqft | DOM | Units | Dist |
|---|---|---|---|---|---|---|---|---|
| 207 Lux St Rochester, NY | 4.0 | 1.5 | 1728 | $2,150 | $1.24 | 11d | 1 | 0.31mi |
| 59 Clark Ave Rochester, NY | 4.0 | 1.0 | 1728 | $1,800 | $1.04 | 3d | 1 | 0.46mi |
| 117 Northaven Ter Rochester, NY | 4.0 | 2.0 | 1460 | $1,975 | $1.35 | 11d | 1 | 0.46mi |
| 47 Priscilla St Rochester, NY | 4.0 | 1.5 | 1250 | $1,900 | $1.52 | 22d | 1 | 0.67mi |
| 1788 Clifford Ave Rochester, NY | 3.0 | 1.0 | 2404 | $1,850 | $0.77 | 3d | 1 | 0.75mi |
| 1786 Clifford Ave Rochester, NY | 3.0 | 1.0 | 2404 | $1,850 | $0.77 | 4d | 1 | 0.75mi |
| 52 Frances St Rochester, NY | 4.0 | 1.0 | 1256 | $1,595 | $1.27 | 44d | 1 | 0.89mi |
| 149 Brookdale Park Rochester, NY | 4.0 | 1.5 | 1543 | $2,950 | $1.91 | 22d | 1 | 1.06mi |
| 147 5th St Rochester, NY | 4.0 | 1.0 | 1289 | $1,950 | $1.51 | 22d | 1 | 1.07mi |
| 2450 Culver Rd Rochester, NY | 3.0 | 1.5 | 1380 | $2,400 | $1.74 | 4d | 1 | 1.16mi |
| 126 Parsells Ave Rochester, NY | 3.0 | 1.0 | 1574 | $1,800 | $1.14 | 44d | 1 | 1.36mi |
| 126 Parsells Ave Rochester, NY | 3.0 | 1.0 | 1574 | $1,800 | $1.14 | 22d | 1 | 1.36mi |
| 195 Parsells Ave Rochester, NY | 4.0 | 1.0 | 1413 | $1,265 | $0.90 | 4d | 1 | 1.41mi |
| 420 Rosewood Ter Rochester, NY | 3.0 | 1.0 | 1246 | $1,300 | $1.04 | 4d | 1 | 1.48mi |
Listing history 32 events
-
2026-05-06status Pending 545-char remark
-
2026-04-29$125,000 Active 545-char remark
-
2025-09-24historical
-
2025-09-09$125,000 Active
-
2022-10-13soldstatus $110,000
-
2022-10-11soldstatus $110,000 Closed Sale or Rented
Show marketing remark (340 chars)
Duplex with NEW: Roof, Furnaces, Water Heaters, and Separate Elec Panels, and Vinyl Windows. This well-maintained duplex currently rents for $700 and $600 so there is room for upside. The upper unit is a 3 Bedroom with 1 bath and a partially finished attic. The lower unit is a 1 bedroom with a large walk-in closet or nursery with 1 bath.
-
2022-09-07status Pending Sale
Show marketing remark (340 chars)
Duplex with NEW: Roof, Furnaces, Water Heaters, and Separate Elec Panels, and Vinyl Windows. This well-maintained duplex currently rents for $700 and $600 so there is room for upside. The upper unit is a 3 Bedroom with 1 bath and a partially finished attic. The lower unit is a 1 bedroom with a large walk-in closet or nursery with 1 bath.
-
2022-09-01$104,900 Active
Show marketing remark (340 chars)
Duplex with NEW: Roof, Furnaces, Water Heaters, and Separate Elec Panels, and Vinyl Windows. This well-maintained duplex currently rents for $700 and $600 so there is room for upside. The upper unit is a 3 Bedroom with 1 bath and a partially finished attic. The lower unit is a 1 bedroom with a large walk-in closet or nursery with 1 bath.
-
2022-07-19historical
-
2022-06-20price $109,499
-
2022-05-18price $109,500
-
2022-05-03status Active
-
2022-04-28status Pending Sale
-
2022-04-19$109,900 Active
-
2020-08-14soldstatus $80,000
-
2020-08-07soldstatus $80,000 Closed Sale or Rented
-
2020-02-04status Under Contract- Do Not Show
-
2020-02-03status Active
-
2020-01-25historical Continue to Show- Under Contract
-
2020-01-18price $69,900
-
2020-01-16$75,000 Active
-
2018-10-31soldstatus $60,000
-
2018-10-29soldstatus $60,000 Closed Sale or Rented
-
2018-08-24status Pending Sale
-
2018-08-09status Under Contract- Do Not Show
-
2018-08-09historical Continue to Show- Under Contract
-
2018-07-23price $62,500
-
2018-07-09price $66,000
-
2018-05-22$69,000 Active
-
2016-05-24soldstatus $140,000
-
2015-12-08soldstatus $28,000
-
2003-05-30soldstatus $28,000
ⓘ Source: listings_history table (triggers on properties + properties_extension) + one-shot
backfill from property_details.listing_events for pre-trigger history.
Tax reassessment forecast NY · Partial reset (capped growth)
- Current annual tax
- $1,237 · $103/mo
- Projected year-2 tax
- $1,675 · $140/mo
- Expected delta
- +$438/yr (+$36/mo · 35.4%)
ⓘ Screening estimate from a state-policy table — verify with the county assessor before closing.
Climate risk First Street
- Flood 1/10 Low FEMA zone X (unshaded) · 0% chance over 30 yrs
- Wildfire 1/10 Low
- Heat 2/10 Low 7 d/yr ≥95°F today · 15 d/yr by 30 yrs out
- Wind 1/10 Low
- Air quality 2/10 Low 1 unhealthy d/yr today · 2 by 30 yrs out
Nearby sold comps map
Loading sold comps map…
Walkable amenities ~0.75 mi
Loading nearby amenities…
Taxation est. · year 1
- Rental income
- $32,040
- − Mortgage interest
- −$7,002
- − Property taxes
- −$1,237
- − Insurance
- −$625
- − Repairs & maintenance
- −$2,563
- − Management
- −$2,563
- − Depreciation
- −$3,636
- Taxable income
- $14,413
- Est. tax owed @ 24.0%
- −$3,459
- After-tax cash flow
- $12,124/yr
For passive investors: Depreciation is non-cash, so a rental often shows a tax loss while cash-flowing — sheltering income. Rental losses are passive: they offset passive income freely, and up to $25,000/yr can offset ordinary (W-2) income if you actively participate and your MAGI is under $100k (phasing out to $0 by $150k); unused losses carry forward. On sale, claimed depreciation is recaptured at up to 25%, and gains may owe capital-gains tax (a 1031 exchange can defer both). Figures are a year-1 estimate at your 24.0% rate — not tax advice; consult a CPA.
Schools (NCES district)
- District
- Rochester City School District
- NCES district ID
- 3624750
- Math proficiency
- 21% ▬ 0.00%
- Reading proficiency
- 26% ▲ 4.00%
- Median HH income
- $30,923
- Composite
- 18.98/100
- National rank
- #8850
- State rank
- #589 of 590 in NY
Livability — Rochester
- Score
- 76/100
- State rank
- #222
- US rank
- #3482
Category grades
Schools grade is shown separately in the Schools card above.
Census & demographics
- Census place
- Rochester, NY
- County
- Monroe County · 674,131 people
- City population
- 432,803
- Metro
- Rochester, NY
- Population (ZIP)
- 32,381
- Household income
- $35,383
- Rent vs Own
- Severe rent burden
- 2756.0
Population outlook (Monroe County) Hauer SSP2
- Today (2025)
- 759,460 people
- By 2030
- 757,154 · -0.3%
- By 2040
- 740,644 · -2.5%
- By 2050
- 714,443 · -5.9%
- By 2075
- 645,883 · -15.0%
- By 2100
- 547,084 · -28.0%
Race, ethnicity, and origin ACS 2023
- Neighborhood character
- Diverse neighborhood (Simpson 0.66)
- Race & ethnicity
- Hispanic / Latino 40% Black 40% White 14% Two or more races 12% Asian 1%
- Hispanic origin (detail)
- Mexican 1% Puerto Rican 32% Dominican 3%
- Common ancestry
- Romanian 1% Lithuanian 1% Serbian 1%
- Foreign-born
- 8% · Canada, Jamaica
- Languages at home
- 65% English-only · Spanish 30% Other Asian/Pacific 2% French/Haitian/Cajun 1%
Political lean MEDSL · Monroe
- 2024 margin
- D (+19.1) · D 59.5% · R 40.5%
- 2008→2024 swing
- +1.4pp toward D · 2008: 17.7pp · 2024: 19.1pp
- All cycles
- 2024: D+19.1 2020: D+21.0 2016: D+14.1 2012: D+17.4 2008: D+17.7
Not yet ingested
- Civics
- —
Market trends
- HPI YoY
- ▼ -10.66%
- Current HPI
- 254.1805
- Rent YoY
- ▲ 8.88%
- Metro
- Rochester, NY
- State GDP YoY
- ▲ 2.60%
- F500 in state
- 92
Industry mix (Fortune 500 HQ in NY)
| Industry | F500 HQs | Revenue |
|---|---|---|
| Financial Services | 10 | $950B |
|
||
| Consumer Goods | 9 | $162B |
|
||
| Insurance | 4 | $225B |
|
||
| Telecommunications | 2 | $144B |
|
||
| Pharmaceuticals | 2 | $112B |
|
||
| Media / Entertainment | 2 | $69B |
|
||
Price history
+346.4% since first listed32 events — show timeline
- 2026-05-06 Pending — UNYREIS
- 2026-04-29 Listed $125,000 UNYREIS
- 2025-09-24 Listing Removed — UNYREIS
- 2025-09-09 Listed $125,000 UNYREIS
- 2022-10-13 Sold (Public Records) $110,000 Public Records
- 2022-10-11 Sold (MLS) $110,000 UNYREIS
- 2022-09-07 Pending — UNYREIS
- 2022-09-01 Listed $104,900 UNYREIS
- 2022-07-19 Listing Removed — UNYREIS
- 2022-06-20 Price Changed $109,499 UNYREIS
- 2022-05-18 Price Changed $109,500 UNYREIS
- 2022-05-03 Relisted — UNYREIS
- 2022-04-28 Pending — UNYREIS
- 2022-04-19 Listed $109,900 UNYREIS
- 2020-08-14 Sold (Public Records) $80,000 Public Records
- 2020-08-07 Sold (MLS) $80,000 UNYREIS
- 2020-02-04 Pending — UNYREIS
- 2020-02-03 Relisted — UNYREIS
- 2020-01-25 Contingent — UNYREIS
- 2020-01-18 Price Changed $69,900 UNYREIS
- 2020-01-16 Listed $75,000 UNYREIS
- 2018-10-31 Sold (Public Records) $60,000 Public Records
- 2018-10-29 Sold (MLS) $60,000 UNYREIS
- 2018-08-24 Pending — UNYREIS
- 2018-08-09 Pending — UNYREIS
- 2018-08-09 Contingent — UNYREIS
- 2018-07-23 Price Changed $62,500 UNYREIS
- 2018-07-09 Price Changed $66,000 UNYREIS
- 2018-05-22 Listed $69,000 UNYREIS
- 2016-05-24 Sold (Public Records) $140,000 Public Records
- 2015-12-08 Sold (Public Records) $28,000 Public Records
- 2003-05-30 Sold (Public Records) $28,000 Public Records
Property tax history
+0.8%/yrLatest (2025): $1,237 · -2.3% YoY. Source: county tax records.
Cash-flow waterfall
monthlySold comps — $/sqft
last 12 mo · ≤1 miLoading sold comps…