 🏢 Co-op
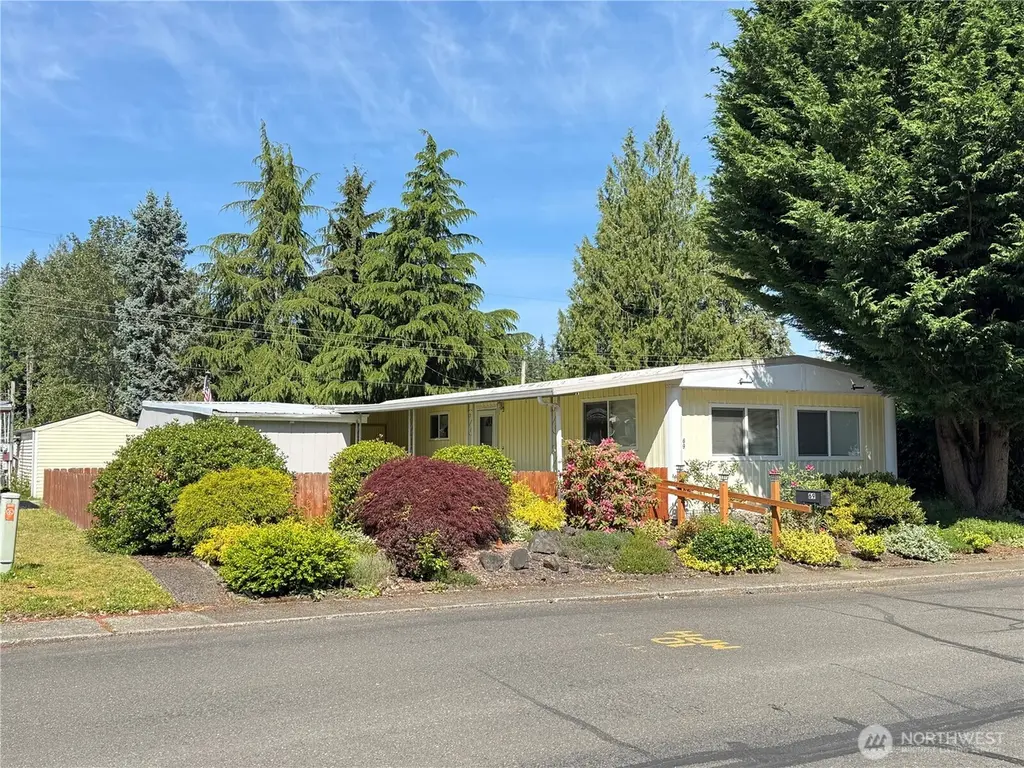
930 Trosper Rd SW #69 · Tumwater, WA
Flood risk 1/10 · Minimal
- FEMA flood zone
- X (unshaded)
- Chance of flooding over 30 yrs
- 0.0%
- Est. flood insurance / yr
- $507 – $1,088
Fire risk 1/10 · Minimal
- Est. fire insurance / yr
- $604 – $1,122
Heat risk 3/10 · Minor
- Hot days now (above 88°F)
- 7 days/yr
- Hot days in 30 yrs
- 14 days/yr
Wind risk 1/10 · Minimal
- Chance of severe wind over 30 yrs
- —
Air-quality risk 6/10 · Moderate
- Unhealthy air days now
- 7 days/yr
- Unhealthy air days in 30 yrs
- 8 days/yr
Risk factors via First Street. Map © Google.
Why this score? — see what drove the B+ grade
The composite is a weighted blend of 9 inputs, each scored 0–100. Each bar is that input's sub-score; the figure is the points it added to the 100-point composite (weight × sub-score).
- Cash flow +30.0/30.0
- ARV discount +11.4/15.0
- 1% rule +10.0/10.0
- DSCR +10.0/10.0
- Schools +5.6/10.0
- Livability +4.2/5.0
- Rent growth +3.1/5.0
- Condition / age +2.5/5.0
- Appreciation +0.0/10.0
$59,950
🖨 Deal sheet 📄 Offer letter ✓ Due diligence
Listing remarks
Welcome To Tumwater! This convenient 55+ Co-Op community truly has it all. Inside features an updated 2 bed 1 bath layout. Recently painted. Two large bedrooms. Fully fenced backyard. Carport and driveway provide ample parking space with plenty of room for storage also. Heat pump provides heat year round and cooling during hot summers. All appliances are included. Affordable space rent and the community has a clubhouse. Nearby restaurants, Fred Meyer, and I-5. Come see it today!
Key facts
- Ample parking space
- Heat pump
- Community clubhouse
Tags
Property features AI
Finance
- Other: Calculated living area: 800; Public records used for square footage
- Financial info: Listing terms: Cash or Conventional
- HOA & community: Land lease: $720/month; Park name: Tumwater Mobile Estates; Approximately 136 homes in the park; Senior community designation; Pets: see remarks
Exterior
- Parking: Carport and uncovered parking
- Utilities: Electric energy source; Electric water heater; Community water (City of Tumwater); Sewer service (City of Tumwater); Power via Puget Sound Energy; Cable and internet via Comcast
- Home design: Manufactured double-wide home; One level; Manufactured house (double wide)
- Construction: Tie down foundation
- Exterior features: Patio/porch/deck; Located in a manufactured home park with clubhouse, common areas and sidewalks; Bus line nearby (Route 38)
Interior
- Kitchen: Dishwasher; Stove/Range; Refrigerator
- Bedrooms: 2 bedrooms
- Flooring: Vinyl; Carpet
- Bathrooms: 1 full bathroom with bathtub and separate shower
- Heating & cooling: Heat pump for heating and cooling
- Interior features: Water heater; Entry; Living room; Kitchen without eating space; Double pane windows; Patio/porch/deck
- Laundry & utility: Washer; Dryer
Neighborhood map
What this means for you Summary
Snapshot
- This is a 2-bed/1.0-bath manufactured listed at $60k.
Deal economics
- At list price, monthly cash flow is $1k ($14k/yr) — positive.
- The deal already cash-flows at list — no discount required.
- Meets the 1% rule at list price ($2k rent vs $60k).
- Recommended offer: $59k (1.5% below list) — sets the bar for market timing.
- Cap rate 29.5% vs local median 2.7% in Tumwater — top-decile yield for the area; either an underpriced asset or a hidden risk that comps aren't pricing in. Stress-test before assuming the spread holds.
Location & tenants
- Location reads 84/100 on livability (#39 in WA, #700 nationally) — a professional / high-income tenant draw. Strengths: commute A+, housing A+, health & safety A+; Watch: amenities D, cost of living D-.
- Tumwater School District (urban): math 57% / reading 69% proficiency, ranked #37 of 291 in WA (top 13%) — acceptable for families but not a draw, mixed tenant base, ~2y average lease.
- Market conditions: Rents rising (+2.3%/yr); 233 active listings in the ZIP; 23 comparable units currently listed for rent nearby; rentals at typical pace (median 21d on market — plan ~3-4 weeks tenant-placement turnaround); solid renter incomes; 1,222 units permitted in Thurston County in 2024 (508 in 5+ unit buildings).
Forward outlook
- Local home prices are declining (-3.0%/yr); year-one equity from $414 of loan paydown is wiped out by about $2k of value loss. Plan a longer hold.
- Thurston County population projected at +27% by 2050 — long-run rental-demand tailwind backs the buy-and-hold thesis.
- At projected returns (-3.0% appreciation + 2.3% rent growth), your $17k cash investment doubles in ~2 years — after that, you're playing with house money.
Negotiation context
- It's been on market 16 days — a 2% lower offer ($59k) is reasonable based on typical stale-listing flexibility.
- 2 sale attempts since 2y ago with the ask held roughly flat each time — persistent listings suggest the price (not the market) is what's stuck; bring a comps-based counter.
Questions for the listing agent
- Built in 1969 — when were the roof, HVAC, electrical panel, plumbing, and water heater last replaced?
- Is there a deadline driving the sale (1031 exchange, divorce, estate, relocation)? That informs how much negotiation room exists.
- Schools are A-rated — typically a magnet for longer-tenancy family renters. What's the average tenant stay here, and is there a school-zone premium baked into asking?
- What's the average days-on-market for RENTAL listings here right now (not sales)? A rising rental-DOM trend means longer vacancies and softer asking-rent achievability than the comps imply.
- What's the recent tenant-quality profile in this submarket — average credit score on applications, eviction rate, late-payment / NSF rate, and stable-employment percentage? A property-management company in the area should have these aggregated.
- How much new for-sale + rental construction is in the pipeline within 1–3 miles? Heavy new supply typically softens prices + rents 12–24 months out; constrained supply supports both.
Investment metrics
- 1% rule
- 3.28% ✓
- Cap rate
- 29.55%
- Cash-on-cash
- 83.05%
- DSCR
- 4.70
- GRM
- 2.5
CMA / ARV
- ARV (on-the-fly)
- $65,600
- Comps found
- 4
Show comp detail 4 sales within ~0.75 mi
| Address | Dist | Beds/Ba | Sqft | Sold | Price | $/sf | Match |
|---|---|---|---|---|---|---|---|
| 1841 Trosper Rd SW #24 | 0.36mi | 2/1.0 | 768 (-4%) | 8mo | $84,500 | $110 | 70 |
| 5705 Littlerock Rd SW #15 | 0.30mi | 2/1.0 | 728 (-9%) | 10mo | $55,000 | $76 | 62 |
| 5705 Litterock Rd SW #45 | 0.30mi | 2/1.0 | 700 (-12%) | 11mo | $57,500 | $82 | 56 |
| 5705 Littlerock Rd SW #20 | 0.30mi | 2/1.0 | 882 (+10%) | 22mo | $40,000 | $45 | 50 |
Match score weights: distance 35% · size 25% · config 20% · recency 20%. Top-matched comps best support the ARV.
Projected returns pro-forma
-3.0% appreciation · 2.26% rent growth · sell at horizon
- IRR
- 82.6%
- Equity multiple
- 4.74×
- Total profit
- $62,843
- Equity at exit
- $8,939
- IRR
- 85.7%
- Equity multiple
- 9.59×
- Total profit
- $144,191
- Equity at exit
- $5,183
Cash invested: $16,786 (down + closing). Projections, not guarantees.
Landlord ↔ Tenant lean methodology
- Overall (STATE)
- 28 Tenant-Leaning
- State Washington
- 28 Tenant-Leaning · D+8
- County
- — inherits STATE
- City
- — inherits STATE
ZIP-level market 98512
- Rents YoY
- 2.3%
- Active inventory
- 233
- Price-to-rent
- 2.5×
Monthly cashflow live
- Estimated rent
- $1,967 high interval (Pro) →
- Mortgage (P&I)
- −$314
- Tax from tax record
- −$53 /mo · $635/yr
- Insurance
- −$25
- HOA
- −$0
- Vacancy / Maint / Mgmt
- −$413
- Net cashflow
- $1,162
Break-even live
UW: 25.0% down · 7.5% · 30yr · 1.5% tax · 5.0% vac · 8.0% maint · 8.0% mgmt
Financing live
Cash to close
- Down payment
- $14,988
- Closing costs
- $1,798
- Reserves months
- —
- Total cash needed
- —
Loan-product check · same deal, 3 products live
Conventional
25% down · 7.5% · 30yr
- Down + closing
- —
- Monthly P&I
- —
- Monthly cashflow
- —
- DSCR
- —
- Eligible?
- —
Personal DTI + credit; lowest rate.
DSCR
20% down · 8.5% · 30yr
- Down + closing
- —
- Monthly P&I
- —
- Monthly cashflow
- —
- DSCR
- —
- Eligible?
- —
No personal income docs; deal must DSCR.
Hard money
10% down · 12.0% · 12mo
- Down + closing
- —
- Monthly P&I
- —
- Monthly cashflow
- —
- DSCR
- —
- Eligible?
- —
Short-term bridge; refi at stabilization.
Rent comps 23 comps
| Address | Beds | Baths | Sqft | Rent | $/sqft | DOM | Units | Dist |
|---|---|---|---|---|---|---|---|---|
| 1978 Trosper Rd SW Tumwater, WA | 1.0–3.0 | 1.0–2.0 | 1050 | $2,428 | $2.31 | 43d | 3 | 0.20mi |
| 1978 Trosper Rd SW Tumwater, WA | 1.0–3.0 | 1.0–2.0 | 1106 | $2,246 | $2.03 | 13d | 4 | 0.20mi |
| 4822 Rural Rd SW Tumwater, WA | 2.0 | 2.0 | 1025 | $1,995 | $1.95 | 21d | 1 | 0.28mi |
| 301 Lee St SW Tumwater, WA | 1.0 | 1.0 | 650 | $1,385 | $2.13 | 43d | 1 | 0.61mi |
| 301 T St SW Tumwater, WA | 2.0 | 1.0 | 589 | $1,635 | $2.78 | 13d | 5 | 0.69mi |
| 215 Pinehurst Dr SW Tumwater, WA | 2.0 | 1.0–2.5 | 759 | $1,950 | $2.57 | 13d | 4 | 0.74mi |
| 1517 Bishop Rd SW Tumwater, WA | 2.0 | 1.0–2.0 | 669 | $1,930 | $2.88 | 13d | 1 | 0.87mi |
| 6705 Linderson Way SW Tumwater, WA | 1.0–3.0 | 1.0–2.0 | 900 | $2,038 | $2.26 | 13d | 6 | 0.95mi |
| 214 65th Way SW Tumwater, WA | 2.0 | 1.0 | 1000 | $1,850 | $1.85 | 21d | 1 | 0.97mi |
| 151 Cherry Ln SE Tumwater, WA | 3.0 | 1.0 | 874 | $2,195 | $2.51 | 21d | 1 | 1.04mi |
| 1704 Barnes Blvd SW Tumwater, WA | 1.0–3.0 | 1.0–2.5 | 920 | $2,004 | $2.18 | 13d | 35 | 1.04mi |
| 6504 Capitol Blvd SE Tumwater, WA | 1.0 | 1.0 | 974 | $2,125 | $2.18 | 13d | 1 | 1.07mi |
| 6805 Littlerock Rd SW Tumwater, WA | 2.0 | 1.0 | 1000 | $1,495 | $1.50 | 43d | 1 | 1.11mi |
| 1992 Ridgeview Loop SW Unit 204 Tumwater, WA | 2.0 | 1.0 | 804 | $1,700 | $2.11 | 21d | 1 | 1.11mi |
| 220 Israel Rd SW Unit G8 Tumwater, WA | 2.0 | 1.5 | 968 | $1,975 | $2.04 | 43d | 1 | 1.17mi |
| 829 Israel Rd SW Apt B6 Tumwater, WA | 2.0 | 1.0 | 850 | $1,395 | $1.64 | 43d | 1 | 1.19mi |
| 829 Israel Rd SW Apt A4 Tumwater, WA | 2.0 | 1.0 | 850 | $1,395 | $1.64 | 13d | 1 | 1.19mi |
| 1255 Bay Loop SW Tumwater, WA | 2.0 | 1.0 | 975 | $2,400 | $2.46 | 43d | 1 | 1.23mi |
| 801 Israel Rd SW Tumwater, WA | 2.0 | 1.5 | 965 | $1,860 | $1.93 | 13d | 2 | 1.24mi |
| 2820 Tuscany Ln SW Unit 714 Tumwater, WA | 2.0 | 2.0 | 1030 | $1,725 | $1.67 | 21d | 1 | 1.30mi |
| 2820 Tuscany Ln SW Unit 411 Tumwater, WA | 2.0 | 1.0 | 915 | $1,635 | $1.79 | 43d | 1 | 1.30mi |
| 2820 Tuscany Ln SW Tumwater, WA | 1.0–2.0 | 1.0–2.0 | 915 | $1,775 | $1.94 | 13d | 8 | 1.30mi |
| 520 Primrose Ln SE Tumwater, WA | 3.0 | 1.5 | 1050 | $2,200 | $2.10 | 43d | 1 | 1.44mi |
Listing history 10 events
-
2026-06-07statusdays on market $59,950 Pending 16 DOM
-
2026-06-05days on market $59,950 Active 14 DOM
-
2026-06-02days on market $59,950 Active 12 DOM
-
2026-06-01days on market $59,950 Active 11 DOM
-
2026-05-31days on market $59,950 Active 10 DOM
-
2026-05-30days on market $59,950 Active 9 DOM
-
2026-05-21$59,950 Active
-
2024-02-26soldstatus $60,000 Closed
-
2024-02-15status Pending
-
2024-02-08$59,900 Active
ⓘ Source: listings_history table (triggers on properties + properties_extension) + one-shot
backfill from property_details.listing_events for pre-trigger history.
Tax reassessment forecast WA · Resets to sale price
- Current annual tax
- $635 · $53/mo
- Projected year-2 tax
- $635 · $53/mo
- Expected delta
- $0/yr ($0/mo · 0.0%)
ⓘ Screening estimate from a state-policy table — verify with the county assessor before closing.
Climate risk First Street
- Flood 1/10 Low FEMA zone X (unshaded) · 0% chance over 30 yrs
- Wildfire 1/10 Low
- Heat 3/10 Moderate 7 d/yr ≥88°F today · 14 d/yr by 30 yrs out
- Wind 1/10 Low
- Air quality 6/10 Major 7 unhealthy d/yr today · 8 by 30 yrs out
Nearby sold comps map
Loading sold comps map…
Walkable amenities ~0.75 mi
Loading nearby amenities…
Taxation est. · year 1
- Rental income
- $23,606
- − Mortgage interest
- −$3,358
- − Property taxes
- −$635
- − Insurance
- −$300
- − Repairs & maintenance
- −$1,888
- − Management
- −$1,888
- − Depreciation
- −$1,744
- Taxable income
- $13,792
- Est. tax owed @ 24.0%
- −$3,310
- After-tax cash flow
- $10,631/yr
For passive investors: Depreciation is non-cash, so a rental often shows a tax loss while cash-flowing — sheltering income. Rental losses are passive: they offset passive income freely, and up to $25,000/yr can offset ordinary (W-2) income if you actively participate and your MAGI is under $100k (phasing out to $0 by $150k); unused losses carry forward. On sale, claimed depreciation is recaptured at up to 25%, and gains may owe capital-gains tax (a 1031 exchange can defer both). Figures are a year-1 estimate at your 24.0% rate — not tax advice; consult a CPA.
Schools (NCES district)
- District
- Tumwater School District
- NCES district ID
- 5309100
- Math proficiency
- 57% ▬ 0.00%
- Reading proficiency
- 69% ▼ -1.00%
- Median HH income
- $64,209
- Composite
- 56.38/100
- National rank
- #2477
- State rank
- #37 of 291 in WA
Livability — Tumwater
- Score
- 84/100
- State rank
- #39
- US rank
- #700
Category grades
Schools grade is shown separately in the Schools card above.
Census & demographics
- Census place
- Tumwater, WA
- County
- Thurston County · 269,345 people
- City population
- 46,937
- Metro
- Olympia-Lacey-Tumwater, WA
- Population (ZIP)
- 31,864
- Household income
- $101,530
- Rent vs Own
- Severe rent burden
- 784.0
Population outlook (Thurston County) Hauer SSP2
- Today (2025)
- 308,239 people
- By 2030
- 326,483 · +5.9%
- By 2040
- 359,890 · +16.8%
- By 2050
- 391,800 · +27.1%
- By 2075
- 468,024 · +51.8%
- By 2100
- 519,890 · +68.7%
Race, ethnicity, and origin ACS 2023
- Neighborhood character
- Predominantly White (72%)
- Race & ethnicity
- White 72% Two or more races 13% Hispanic / Latino 9% Asian 4% Black 3% Native American 1%
- Hispanic origin (detail)
- Mexican 5%
- Common ancestry
- Portuguese 4% Italian 4% Slovak 4%
- Foreign-born
- 6% · Canada, Vietnam, China
- Languages at home
- 92% English-only · Spanish 3% Vietnamese 1% German/W. Germanic 1%
Political lean MEDSL · Thurston
- 2024 margin
- Strong D (+20.4) · D 58.5% · R 38.1% · Other 3.5%
- 2008→2024 swing
- -1.3pp toward R · 2008: 21.7pp · 2024: 20.4pp
- All cycles
- 2024: D+20.4 2020: D+18.6 2016: D+15.4 2012: D+19.0 2008: D+21.7
Not yet ingested
- Civics
- —
Market trends
- HPI YoY
- ▼ -348.18%
- Current HPI
- 347.121
- Rent YoY
- ▲ 2.26%
- Metro
- Olympia-Lacey-Tumwater, WA
- State GDP YoY
- ▲ 4.65%
- F500 in state
- 22
Industry mix (Fortune 500 HQ in WA)
| Industry | F500 HQs | Revenue |
|---|---|---|
| Retail | 2 | $269B |
|
||
| Technology / Retail | 1 | $638B |
|
||
| Technology | 1 | $245B |
|
||
| Telecommunications | 1 | $38B |
|
||
| Food / Beverage | 1 | $36B |
|
||
| Automotive / Trucks | 1 | $34B |
|
||
Price history
+0.1% since first listed4 events — show timeline
- 2026-05-21 Listed $59,950 NWMLS as Distributed by MLS Grid
- 2024-02-26 Sold (MLS) $60,000 NWMLS as Distributed by MLS Grid
- 2024-02-15 Pending — NWMLS as Distributed by MLS Grid
- 2024-02-08 Listed $59,900 NWMLS as Distributed by MLS Grid
Property tax history
+12.3%/yrLatest (2026): $635 · +25.0% YoY. Source: county tax records.
Cash-flow waterfall
monthlySold comps — $/sqft
last 12 mo · ≤1 miLoading sold comps…