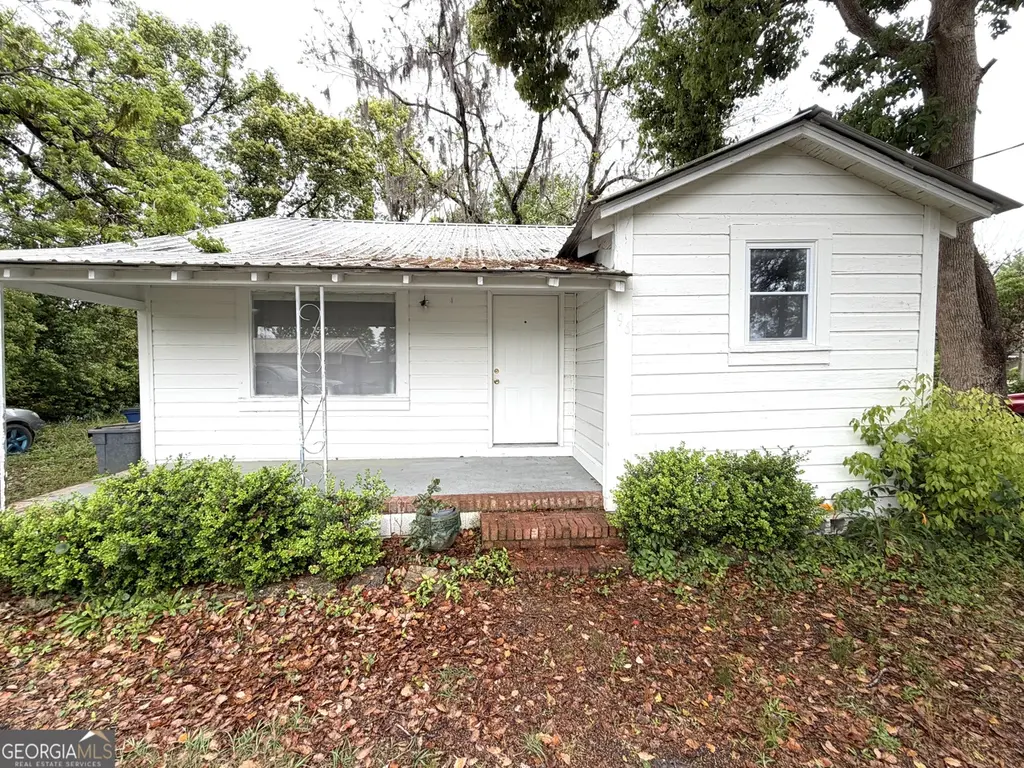
96 Rose St · Homerville, GA
Flood risk 1/10 · Minimal
- FEMA flood zone
- X (unshaded)
- Chance of flooding over 30 yrs
- 0.0%
- Est. flood insurance / yr
- $507 – $1,088
Fire risk 5/10 · Moderate
- Est. fire insurance / yr
- $963 – $1,789
Heat risk 8/10 · Major
- Hot days now (above 107°F)
- 7 days/yr
- Hot days in 30 yrs
- 20 days/yr
Wind risk 8/10 · Major
- Chance of severe wind over 30 yrs
- 99.0%
Air-quality risk 8/10 · Major
- Unhealthy air days now
- 17 days/yr
- Unhealthy air days in 30 yrs
- 21 days/yr
Risk factors via First Street. Map © Google.
Why this score? — see what drove the B+ grade
The composite is a weighted blend of 9 inputs, each scored 0–100. Each bar is that input's sub-score; the figure is the points it added to the 100-point composite (weight × sub-score).
- Cash flow +29.4/30.0
- ARV discount +11.1/15.0
- DSCR +10.0/10.0
- Appreciation +7.4/10.0
- 1% rule +7.3/10.0
- Livability +3.1/5.0
- Schools +2.6/10.0
- Rent growth +2.5/5.0
- Condition / age +2.5/5.0
$70,000
🖨 Deal sheet (PDF) 📄 Offer letter ✓ Due diligence
Listing remarks MLS
Charming and move-in ready, this beautifully updated 3-bedroom, 1-bath home offers the perfect blend of comfort and convenience. Inside, you'll find fresh updates throughout, creating a clean and inviting space that's ready for its next owner. The layout is functional and welcoming, with plenty of natural light and a cozy feel that makes you right at home from the moment you walk in. Located in the city, this home is just minutes from shopping, dining, and everyday essentials-making it a great option for those who want easy access to everything while still enjoying a quiet place to unwind. Please note: The HVAC system is currently not operational and will need repair or replacement. **Some photos have been digitally staged.
Key facts
- Easy access
- Natural light
- Updated home
Tags
Neighborhood map
What this means for you Summary
Snapshot
- This is a 2-bed/1.0-bath single-family listed at $70k.
Deal economics
- At list price, monthly cash flow is $248 ($3k/yr) — positive.
- The deal already cash-flows at list — no discount required.
- Meets the 1% rule at list price ($864 rent vs $70k).
- Recommended offer: $68k (3.0% below list) — sets the bar for market timing.
Location & tenants
- Location reads 62/100 on livability (#303 in GA) — a middle-class / working-renter tenant base. Strengths: crime A+, cost of living A+, housing A+; Watch: health & safety C-, amenities F, commute F.
- Clinch County (rural): math 34% / reading 30% proficiency, ranked #90 of 174 in GA (top 52%) — families likely to look elsewhere, expect single-tenant / working-renter base with shorter leases; 66% free/reduced lunch — lower-income household profile, screen leases tightly.
- Zoned schools: Clinch County Elementary School (math 47% / reading 27%, grade F, #485 of 1,228 statewide, top 41%, 535 students, 74% FRL); Clinch County Middle School (math 32% / reading 35%, grade F, #206 of 470 statewide, top 45%, 290 students, 74% FRL); Clinch County High School (math 22% / reading 22%, grade F, #213 of 424 statewide, top 51%, 426 students, 74% FRL).
- Market conditions: 32 active listings in the ZIP.
Forward outlook
- In year one you build about $4k of equity ($484 loan paydown + $3k appreciation (4.8% local appreciation)).
- At projected returns (4.8% appreciation + 3.0% rent growth), your $20k cash investment doubles in ~3 years — after that, you're playing with house money.
- By year 9, paydown + projected appreciation supports a ~$33k cash-out refi (75% LTV) — recoverable capital for the next deal without selling this one.
Negotiation context
- It's been on market 56 days — a 3% lower offer ($68k) is reasonable based on typical stale-listing flexibility.
- 2 sale attempts since 5y ago with the ask held roughly flat each time — persistent listings suggest the price (not the market) is what's stuck; bring a comps-based counter.
- Current owner paid $56k; 25% above their basis — modest negotiation headroom, anchor on the comps not their cost.
Risks & watch-outs
- Watch-outs: built in 1950 — expect roof / HVAC / electrical / plumbing capex.
- Climate carrying-cost: severe wind risk, 99% chance of damaging wind over 30y; moderate wildfire risk; extreme-heat days projected 7→20/yr by 2055 (HVAC capex compounding) — expect insurance premiums to compound above CPI over the hold.
Questions for the listing agent
- It's been on market 56 days. Have you received any prior offers? Is the seller open to a 3% concession, seller financing, or rate buy-down credit?
- Built in 1950 — when were the roof, HVAC, electrical panel, plumbing, and water heater last replaced?
- Is there a deadline driving the sale (1031 exchange, divorce, estate, relocation)? That informs how much negotiation room exists.
- Schools are F-rated, which usually means shorter tenancies and higher turnover. Who's the typical renter profile here, and what's been the actual vacancy rate?
- What's the average days-on-market for RENTAL listings here right now (not sales)? A rising rental-DOM trend means longer vacancies and softer asking-rent achievability than the comps imply.
- What's the recent tenant-quality profile in this submarket — average credit score on applications, eviction rate, late-payment / NSF rate, and stable-employment percentage? A property-management company in the area should have these aggregated.
- How much new for-sale + rental construction is in the pipeline within 1–3 miles? Heavy new supply typically softens prices + rents 12–24 months out; constrained supply supports both.
Investment metrics
- 1% rule
- 1.23% ✓
- Cap rate
- 10.54%
- Cash-on-cash
- 15.16%
- DSCR
- 1.67
- GRM
- 6.8
CMA / ARV
- ARV (median comp)
- $76,000
- List price
- $70,000
- Delta
- -7.89%
- Verdict
- FAIR
- Comps
- 7 within 1.0 mi
Show comp detail 1 sale within ~0.75 mi
| Address | Dist | Beds/Ba | Sqft | Sold | Price | $/sf | Match |
|---|---|---|---|---|---|---|---|
| 45 Happyville Ln | 0.46mi | 2/1.5 | 960 (+14%) | 4mo | $41,000 | $43 | 50 |
Match score weights: distance 35% · size 25% · config 20% · recency 20%. Top-matched comps best support the ARV.
Projected returns pro-forma
4.79% appreciation · 3.0% rent growth · sell at horizon
- IRR
- 25.5%
- Equity multiple
- 2.58×
- Total profit
- $31,055
- Equity at exit
- $38,782
- IRR
- 24.8%
- Equity multiple
- 5.11×
- Total profit
- $80,628
- Equity at exit
- $66,212
Cash invested: $19,600 (down + closing). Projections, not guarantees.
Landlord ↔ Tenant lean methodology
- Overall (STATE)
- 90 Strongly Landlord-Friendly
- State Georgia
- 90 Strongly Landlord-Friendly · R+3
- County
- — inherits STATE
- City
- — inherits STATE
ZIP-level market 31634
- Home prices YoY
- 2.9%
- Active inventory
- 32
- Price-to-rent
- 6.8×
Monthly cashflow live
- Estimated rent
- $864 medium interval (Pro) →
- Mortgage (P&I)
- −$367
- Tax from tax record
- −$39 /mo · $464/yr
- Insurance
- −$29
- HOA
- −$0
- Vacancy / Maint / Mgmt
- −$181
- Net cashflow
- $248
Break-even live
Sensitivity live
| Price | -10% $287 | -5% $267 | +0% $248 | +5% $228 | +10% $208 |
|---|---|---|---|---|---|
| Rent | -10% $179 | -5% $213 | +0% $248 | +5% $282 | +10% $316 |
| Rate | -1.0pp $283 | -0.5pp $265 | base $248 | +0.5pp $229 | +1.0pp $211 |
UW: 25.0% down · 7.5% · 30yr · 1.5% tax · 5.0% vac · 8.0% maint · 8.0% mgmt
Financing live
Cash to close
- Down payment
- $17,500
- Closing costs
- $2,100
- Reserves months
- —
- Total cash needed
- —
Loan-product check · same deal, 3 products live
Conventional
25% down · 7.5% · 30yr
- Down + closing
- —
- Monthly P&I
- —
- Monthly cashflow
- —
- DSCR
- —
- Eligible?
- —
Personal DTI + credit; lowest rate.
DSCR
20% down · 8.5% · 30yr
- Down + closing
- —
- Monthly P&I
- —
- Monthly cashflow
- —
- DSCR
- —
- Eligible?
- —
No personal income docs; deal must DSCR.
Hard money
10% down · 12.0% · 12mo
- Down + closing
- —
- Monthly P&I
- —
- Monthly cashflow
- —
- DSCR
- —
- Eligible?
- —
Short-term bridge; refi at stabilization.
Listing history 7 events
-
2026-06-01days on market $70,000 Active 56 DOM
-
2026-05-31days on market $70,000 Active 55 DOM
-
2026-05-31days on market $70,000 Active 54 DOM
-
2026-04-03$70,000 New 735-char remark
Show marketing remark (735 chars)
Charming and move-in ready, this beautifully updated 3-bedroom, 1-bath home offers the perfect blend of comfort and convenience. Inside, you'll find fresh updates throughout, creating a clean and inviting space that's ready for its next owner. The layout is functional and welcoming, with plenty of natural light and a cozy feel that makes you right at home from the moment you walk in. Located in the city, this home is just minutes from shopping, dining, and everyday essentials-making it a great option for those who want easy access to everything while still enjoying a quiet place to unwind. Please note: The HVAC system is currently not operational and will need repair or replacement. **Some photos have been digitally staged.
-
2022-03-15soldstatus $56,000
-
2022-03-11soldstatus $56,000
-
2021-04-26$55,000
ⓘ Source: listings_history table (triggers on properties + properties_extension) + one-shot
backfill from property_details.listing_events for pre-trigger history.
Tax reassessment forecast GA · Resets to sale price
- Current annual tax
- $464 · $39/mo
- Projected year-2 tax
- $644 · $54/mo
- Expected delta
- +$180/yr (+$15/mo · 38.7%)
ⓘ Screening estimate from a state-policy table — verify with the county assessor before closing.
Climate risk First Street
- Flood 1/10 Low FEMA zone X (unshaded) · 0% chance over 30 yrs
- Wildfire 5/10 Major
- Heat 8/10 Severe 7 d/yr ≥107°F today · 20 d/yr by 30 yrs out
- Wind 8/10 Severe 99% chance of damaging wind over 30 yrs
- Air quality 8/10 Severe 17 unhealthy d/yr today · 21 by 30 yrs out
Nearby sold comps map
Loading sold comps map…
Walkable amenities ~0.75 mi
Loading nearby amenities…
Taxation est. · year 1
- Rental income
- $10,368
- − Mortgage interest
- −$3,921
- − Property taxes
- −$464
- − Insurance
- −$350
- − Repairs & maintenance
- −$829
- − Management
- −$829
- − Depreciation
- −$2,036
- Taxable income
- $1,937
- Est. tax owed @ 24.0%
- −$465
- After-tax cash flow
- $2,506/yr
For passive investors: Depreciation is non-cash, so a rental often shows a tax loss while cash-flowing — sheltering income. Rental losses are passive: they offset passive income freely, and up to $25,000/yr can offset ordinary (W-2) income if you actively participate and your MAGI is under $100k (phasing out to $0 by $150k); unused losses carry forward. On sale, claimed depreciation is recaptured at up to 25%, and gains may owe capital-gains tax (a 1031 exchange can defer both). Figures are a year-1 estimate at your 24.0% rate — not tax advice; consult a CPA.
Schools (NCES district)
- District
- Clinch County
- NCES district ID
- 1301260
- Math proficiency
- 34% ▲ 8.00%
- Reading proficiency
- 30% ▼ -2.00%
- Median HH income
- $31,048
- Composite
- 26.08/100
- National rank
- #7295
- State rank
- #90 of 174 in GA
Livability — Homerville
- Score
- 62/100
- State rank
- #303
- US rank
- #16493
Category grades
Schools grade is shown separately in the Schools card above.
Census & demographics
- Census place
- Homerville, GA
- Population (ZIP)
- 5,178
Population outlook (Clinch County) Hauer SSP2
- Today (2025)
- 7,052 people
- By 2030
- 7,091 · +0.6%
- By 2040
- 7,116 · +0.9%
- By 2050
- 7,170 · +1.7%
- By 2075
- 7,495 · +6.3%
- By 2100
- 7,828 · +11.0%
Race, ethnicity, and origin ACS 2023
- Neighborhood character
- Predominantly White (68%)
- Race & ethnicity
- White 68% Black 27% Two or more races 4%
- Common ancestry
- Serbian 1% Italian 1%
- Foreign-born
- 1% · Canada
- Languages at home
- 98% English-only · Spanish 2% Arabic 1%
Political lean MEDSL · Clinch
- 2024 margin
- Solid R (+51.5) · D 24.1% · R 75.7%
- 2008→2024 swing
- -26.0pp toward R · 2008: -25.6pp · 2024: -51.5pp
- All cycles
- 2024: R+51.5 2020: R+47.6 2016: R+42.5 2012: R+30.2 2008: R+25.6
Not yet ingested
- Civics
- —
Market trends
- HPI YoY
- ▲ 4.79%
- Current HPI
- 168.9842
- Rent YoY
- —
- Metro
- —
- State GDP YoY
- ▲ 2.66%
- F500 in state
- 28
Industry mix (Fortune 500 HQ in GA)
| Industry | F500 HQs | Revenue |
|---|---|---|
| Paper / Packaging | 2 | $29B |
|
||
| Retail | 1 | $160B |
|
||
| Transportation / Logistics | 1 | $91B |
|
||
| Airlines | 1 | $62B |
|
||
| Consumer Goods | 1 | $47B |
|
||
| Utilities | 1 | $25B |
|
||
Price history
+27.3% since first listed4 events — show timeline
- 2026-04-03 Listed $70,000 GAMLS
- 2022-03-15 Sold (Public Records) $56,000 Public Records
- 2022-03-11 Sold (MLS) $56,000 SGMLS
- 2021-04-26 Listed $55,000 SGMLS
Property tax history
+6.5%/yrLatest (2025): $464 · +78.2% YoY. Source: county tax records.
Cash-flow waterfall
monthlySold comps — $/sqft
last 12 mo · ≤1 miLoading sold comps…