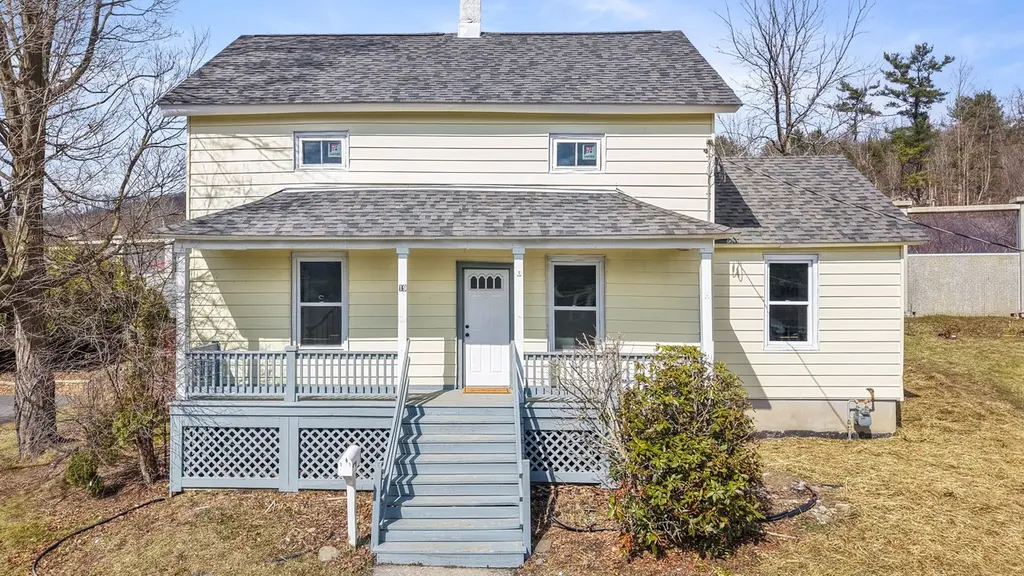
19 Monroe St · Binghamton, NY
Flood risk 1/10 · Minimal
- FEMA flood zone
- X
- Chance of flooding over 30 yrs
- 0.0%
- Est. flood insurance / yr
- $473 – $860
Fire risk 2/10 · Minimal
- Est. fire insurance / yr
- $691 – $1,283
Heat risk 3/10 · Minor
- Hot days now (above 93°F)
- 7 days/yr
- Hot days in 30 yrs
- 16 days/yr
Wind risk 2/10 · Minimal
- Chance of severe wind over 30 yrs
- 2.0%
Air-quality risk 2/10 · Minimal
- Unhealthy air days now
- 0 days/yr
- Unhealthy air days in 30 yrs
- 1 days/yr
Risk factors via First Street. Map © Google.
Why this score? — see what drove the C- grade
The composite is a weighted blend of 9 inputs, each scored 0–100. Each bar is that input's sub-score; the figure is the points it added to the 100-point composite (weight × sub-score).
- Cash flow +17.3/30.0
- Appreciation +10.0/10.0
- DSCR +5.4/10.0
- 1% rule +5.0/10.0
- ARV discount +4.6/15.0
- Livability +3.9/5.0
- Schools +3.0/10.0
- Rent growth +2.5/5.0
- Condition / age +2.5/5.0
$184,900
🖨 Deal sheet (PDF) 📄 Offer letter ✓ Due diligence
Listing remarks MLS
Ready for your renovation, motivated seller
Key facts
- Extensively updated
- New plumbing
- New siding
Tags
Neighborhood map
What this means for you Summary
Snapshot
- This is a 3-bed/1.5-bath single-family listed at $185k.
Deal economics
- At list price, monthly cash flow is $136 ($2k/yr) — positive.
- The deal already cash-flows at list — no discount required.
- Meets the 1% rule at list price ($2k rent vs $185k).
- Recommended offer: $179k (3.0% below list) — sets the bar for market timing.
Location & tenants
- Location reads 78/100 on livability (#174 in NY, #2,710 nationally) — a middle-class / working-renter tenant base. Strengths: amenities A+, commute A+, cost of living A+; Watch: crime F, employment F.
- Binghamton City School District (urban): math 30% / reading 44% proficiency, ranked #557 of 590 in NY (top 94%) — families likely to look elsewhere, expect single-tenant / working-renter base with shorter leases; 61% free/reduced lunch — lower-income household profile, screen leases tightly.
- Zoned schools: Calvin Coolidge School (math 27% / reading 37%, grade F, #1,646 of 2,108 statewide, top 80%, 312 students, 72% FRL); Binghamton High School (math 71% / reading 79%, grade A-, #631 of 1,100 statewide, top 58%, 1,341 students, 69% FRL).
- Zoned-school proficiency averages 54% at this address vs 37% district-wide (+16 pts) — the actual schools serving this property are materially stronger than the Binghamton City School District average implies; a family-tenant draw the district grade alone would hide.
- Market conditions: 41 active listings in the ZIP; 6 comparable units currently listed for rent nearby; rentals lingering (median 46d on market — plan ~5-8 weeks vacancy on turnover, expect pricing pressure); 50% of comp listings sitting > 30 days — soft ceiling on asking rent; 340 units permitted in Broome County in 2024 (269 in 5+ unit buildings).
Forward outlook
- In year one you build about $20k of equity ($1k loan paydown + $18k appreciation (10.0% local appreciation)).
- Broome County population projected at -13% by 2050 — secular population decline; favor cash flow + early exit over multi-decade hold.
- At projected returns (10.0% appreciation + 3.0% rent growth), your $52k cash investment doubles in ~3 years — after that, you're playing with house money.
- By year 2, paydown + projected appreciation supports a ~$32k cash-out refi (75% LTV) — recoverable capital for the next deal without selling this one.
Negotiation context
- It's been on market 42 days — a 3% lower offer ($179k) is reasonable based on typical stale-listing flexibility.
- 3 sale attempts since 9y ago with the ask held roughly flat each time — persistent listings suggest the price (not the market) is what's stuck; bring a comps-based counter.
- Current owner paid $72k; list at $185k implies a 159% gain — meaningful room to come down on a strong offer.
Risks & watch-outs
- Watch-outs: built in 1920 — expect roof / HVAC / electrical / plumbing capex.
Questions for the listing agent
- It's been on market 42 days. Have you received any prior offers? Is the seller open to a 3% concession, seller financing, or rate buy-down credit?
- Built in 1920 — when were the roof, HVAC, electrical panel, plumbing, and water heater last replaced?
- Is there a deadline driving the sale (1031 exchange, divorce, estate, relocation)? That informs how much negotiation room exists.
- Schools are D-rated, which usually means shorter tenancies and higher turnover. Who's the typical renter profile here, and what's been the actual vacancy rate?
- Crime grade is F in this area — have there been break-ins, vandalism, or insurance claims at this property in the last 3 years? What carrier currently insures it and at what premium?
- What's the average days-on-market for RENTAL listings here right now (not sales)? A rising rental-DOM trend means longer vacancies and softer asking-rent achievability than the comps imply.
- What's the recent tenant-quality profile in this submarket — average credit score on applications, eviction rate, late-payment / NSF rate, and stable-employment percentage? A property-management company in the area should have these aggregated.
- How much new for-sale + rental construction is in the pipeline within 1–3 miles? Heavy new supply typically softens prices + rents 12–24 months out; constrained supply supports both.
Investment metrics
- 1% rule
- 1.00% ✓
- Cap rate
- 7.17%
- Cash-on-cash
- 3.14%
- DSCR
- 1.14
- GRM
- 8.3
CMA / ARV
- ARV (on-the-fly)
- $173,880
- Comps found
- 12
Show comp detail 12 sales within ~0.75 mi
| Address | Dist | Beds/Ba | Sqft | Sold | Price | $/sf | Match |
|---|---|---|---|---|---|---|---|
| 19 Monroe St | 0.00mi | 3/1.0 | 1,656 (0%) | 1mo | $185,000 | $112 | 98 |
| 20 East St | 0.20mi | 3/2.0 | 1,596 (-4%) | 5mo | $167,000 | $105 | 79 |
| 4 Gray St | 0.24mi | 4/1.5 (+1) | 1,758 (+6%) | 4mo | $160,000 | $91 | 70 |
| 20 Bigelow St | 0.50mi | 3/2.0 | 1,624 (-2%) | 4mo | $170,000 | $105 | 68 |
| 20 Willard St | 0.20mi | 3/2.0 | 1,449 (-12%) | 2mo | $179,000 | $124 | 66 |
| 18 Riverside St | 0.48mi | 3/1.5 | 1,572 (-5%) | 4mo | $170,000 | $108 | 66 |
| 105 Gaylord St | 0.35mi | 3/1.0 | 1,479 (-11%) | 0mo | $215,000 | $145 | 64 |
| 66 Moeller St | 0.54mi | 4/2.0 (+1) | 1,596 (-4%) | 3mo | $152,500 | $96 | 59 |
| 9 Garden Ave | 0.47mi | 2/1.0 (-1) | 1,504 (-9%) | 1mo | $155,000 | $103 | 55 |
| 17 Bigelow St | 0.51mi | 3/2.0 | 1,850 (+12%) | 2mo | $169,900 | $92 | 53 |
| 55 Mason Ave | 0.45mi | 3/2.0 | 1,408 (-15%) | 2mo | $152,000 | $108 | 50 |
| 10 Burton Ave | 0.61mi | 3/1.5 | 1,424 (-14%) | 5mo | $130,000 | $91 | 44 |
Match score weights: distance 35% · size 25% · config 20% · recency 20%. Top-matched comps best support the ARV.
Projected returns pro-forma
10.0% appreciation · 3.0% rent growth · sell at horizon
- IRR
- 26.6%
- Equity multiple
- 3.11×
- Total profit
- $109,400
- Equity at exit
- $166,573
- IRR
- 23.3%
- Equity multiple
- 7.09×
- Total profit
- $315,487
- Equity at exit
- $359,220
Cash invested: $51,772 (down + closing). Projections, not guarantees.
Landlord ↔ Tenant lean methodology
- Overall (STATE)
- 15 Strongly Tenant-Friendly
- State New York
- 15 Strongly Tenant-Friendly · D+10
- County
- — inherits STATE
- City
- — inherits STATE
ZIP-level market 13904
- Home prices YoY
- 17.1%
- Active inventory
- 41
- Price-to-rent
- 8.3×
Monthly cashflow live
- Estimated rent
- $1,853 high interval (Pro) →
- Mortgage (P&I)
- −$970
- Tax from tax record
- −$282 /mo · $3,380/yr
- Insurance
- −$77
- HOA
- −$0
- Vacancy / Maint / Mgmt
- −$389
- Net cashflow
- $136
Break-even live
Sensitivity live
| Price | -10% $240 | -5% $188 | +0% $136 | +5% $83 | +10% $31 |
|---|---|---|---|---|---|
| Rent | -10% $-11 | -5% $62 | +0% $136 | +5% $209 | +10% $282 |
| Rate | -1.0pp $229 | -0.5pp $183 | base $136 | +0.5pp $88 | +1.0pp $39 |
UW: 25.0% down · 7.5% · 30yr · 1.5% tax · 5.0% vac · 8.0% maint · 8.0% mgmt
Financing live
Cash to close
- Down payment
- $46,225
- Closing costs
- $5,547
- Reserves months
- —
- Total cash needed
- —
Loan-product check · same deal, 3 products live
Conventional
25% down · 7.5% · 30yr
- Down + closing
- —
- Monthly P&I
- —
- Monthly cashflow
- —
- DSCR
- —
- Eligible?
- —
Personal DTI + credit; lowest rate.
DSCR
20% down · 8.5% · 30yr
- Down + closing
- —
- Monthly P&I
- —
- Monthly cashflow
- —
- DSCR
- —
- Eligible?
- —
No personal income docs; deal must DSCR.
Hard money
10% down · 12.0% · 12mo
- Down + closing
- —
- Monthly P&I
- —
- Monthly cashflow
- —
- DSCR
- —
- Eligible?
- —
Short-term bridge; refi at stabilization.
Rent comps 6 comps
| Address | Beds | Baths | Sqft | Rent | $/sqft | DOM | Units | Dist |
|---|---|---|---|---|---|---|---|---|
| 100 Felters Rd Binghamton, NY | 4.0 | 2.5 | 2000 | $2,500 | $1.25 | 45d | 1 | 1.28mi |
| 14 Dennison Ave Unit 2 Binghamton, NY | 2.0 | 1.0 | 1100 | $1,150 | $1.05 | 45d | 1 | 1.30mi |
| 8 Roosevelt Ave Binghamton, NY | 3.0 | 1.0 | 1400 | $1,450 | $1.04 | 22d | 1 | 1.33mi |
| 8 Roosevelt Ave Unit 2 Binghamton, NY | 3.0 | 1.0 | 1400 | $1,500 | $1.07 | 45d | 1 | 1.33mi |
| 40 Fuller St Unit 40A Binghamton, NY | 3.0 | 2.0 | 1600 | $2,700 | $1.69 | 22d | 1 | 1.33mi |
| 528 Chenango St Unit 1 Binghamton, NY | 3.0 | 1.0 | 1250 | $1,500 | $1.20 | 15d | 1 | 1.37mi |
Listing history 7 events
-
2026-04-28status Pending
-
2026-03-17$184,900 Active
-
2025-07-23price $85,000
-
2025-07-17soldstatus $71,500
-
2025-06-18$95,000 Active
-
2017-11-16soldstatus $7,000 43-char remark
Show marketing remark (43 chars)
Ready for your renovation, motivated seller
-
2017-09-25$9,900 43-char remark
Show marketing remark (43 chars)
Ready for your renovation, motivated seller
ⓘ Source: listings_history table (triggers on properties + properties_extension) + one-shot
backfill from property_details.listing_events for pre-trigger history.
Tax reassessment forecast NY · Partial reset (capped growth)
- Current annual tax
- $3,380 · $282/mo
- Projected year-2 tax
- $3,380 · $282/mo
- Expected delta
- $0/yr ($0/mo · 0.0%)
ⓘ Screening estimate from a state-policy table — verify with the county assessor before closing.
Climate risk First Street
- Flood 1/10 Low FEMA zone X · 0% chance over 30 yrs
- Wildfire 2/10 Low
- Heat 3/10 Moderate 7 d/yr ≥93°F today · 16 d/yr by 30 yrs out
- Wind 2/10 Low 2% chance of damaging wind over 30 yrs
- Air quality 2/10 Low 0 unhealthy d/yr today · 1 by 30 yrs out
Nearby sold comps map
Loading sold comps map…
Walkable amenities ~0.75 mi
Loading nearby amenities…
Taxation est. · year 1
- Rental income
- $22,238
- − Mortgage interest
- −$10,357
- − Property taxes
- −$3,380
- − Insurance
- −$924
- − Repairs & maintenance
- −$1,779
- − Management
- −$1,779
- − Depreciation
- −$5,379
- Taxable loss
- −$1,361
- Est. tax savings @ 24.0%
- +$327
- After-tax cash flow
- $1,954/yr
For passive investors: Depreciation is non-cash, so a rental often shows a tax loss while cash-flowing — sheltering income. Rental losses are passive: they offset passive income freely, and up to $25,000/yr can offset ordinary (W-2) income if you actively participate and your MAGI is under $100k (phasing out to $0 by $150k); unused losses carry forward. On sale, claimed depreciation is recaptured at up to 25%, and gains may owe capital-gains tax (a 1031 exchange can defer both). Figures are a year-1 estimate at your 24.0% rate — not tax advice; consult a CPA.
Schools (NCES district)
- District
- Binghamton City School District
- NCES district ID
- 3604870
- Math proficiency
- 30% ▬ 0.00%
- Reading proficiency
- 44% ▲ 15.00%
- Median HH income
- $30,475
- Composite
- 30.09/100
- National rank
- #6342
- State rank
- #557 of 590 in NY
Livability — Binghamton
- Score
- 78/100
- State rank
- #174
- US rank
- #2710
Category grades
Schools grade is shown separately in the Schools card above.
Census & demographics
- Census place
- Binghamton, NY
- City population
- 65,170
- Population (ZIP)
- 9,138
Population outlook (Broome County) Hauer SSP2
- Today (2025)
- 187,989 people
- By 2030
- 183,066 · -2.6%
- By 2040
- 172,228 · -8.4%
- By 2050
- 163,161 · -13.2%
- By 2075
- 153,641 · -18.3%
- By 2100
- 140,851 · -25.1%
Race, ethnicity, and origin ACS 2023
- Neighborhood character
- Predominantly White (73%)
- Race & ethnicity
- White 73% Black 12% Hispanic / Latino 8% Two or more races 5% Asian 3%
- Hispanic origin (detail)
- Puerto Rican 5%
- Common ancestry
- Hispanic 8% Romanian 3% Slovak 2%
- Foreign-born
- 9% · Canada, China
- Languages at home
- 87% English-only · French/Haitian/Cajun 5% Spanish 4% Chinese 2%
Political lean MEDSL · Broome
- 2024 margin
- Toss-up / Even · D 50.2% · R 49.8%
- 2008→2024 swing
- -7.6pp toward R · 2008: 8.0pp · 2024: 0.4pp
- All cycles
- 2024: D+0.4 2020: D+3.5 2016: R+3.7 2012: D+4.6 2008: D+8.0
Not yet ingested
- Civics
- —
Market trends
- HPI YoY
- ▲ 40.85%
- Current HPI
- 280.3184
- Rent YoY
- —
- Metro
- —
- State GDP YoY
- ▲ 2.60%
- F500 in state
- 92
Industry mix (Fortune 500 HQ in NY)
| Industry | F500 HQs | Revenue |
|---|---|---|
| Financial Services | 10 | $950B |
|
||
| Consumer Goods | 9 | $162B |
|
||
| Insurance | 4 | $225B |
|
||
| Telecommunications | 2 | $144B |
|
||
| Pharmaceuticals | 2 | $112B |
|
||
| Media / Entertainment | 2 | $69B |
|
||
Price history
+1767.7% since first listed7 events — show timeline
- 2026-04-28 Pending — GBAOR
- 2026-03-17 Listed $184,900 GBAOR
- 2025-07-23 Price Changed $85,000 GBAOR
- 2025-07-17 Sold (Public Records) $71,500 Public Records
- 2025-06-18 Listed $95,000 GBAOR
- 2017-11-16 Sold (MLS) $7,000 GBAOR
- 2017-09-25 Listed $9,900 GBAOR
Property tax history
+3.4%/yrLatest (2025): $3,380 · +0.9% YoY. Source: county tax records.
Cash-flow waterfall
monthlySold comps — $/sqft
last 12 mo · ≤1 miLoading sold comps…