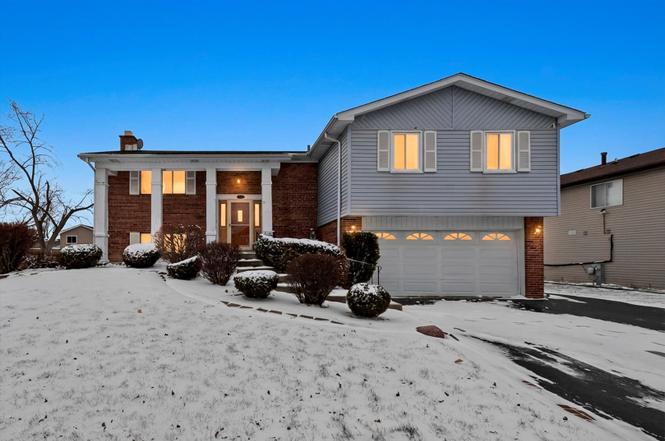
152 Oakhurst Rd · Matteson, IL
Flood risk 1/10 · Minimal
- FEMA flood zone
- X (unshaded)
- Chance of flooding over 30 yrs
- 0.0%
- Est. flood insurance / yr
- $473 – $860
Fire risk 1/10 · Minimal
- Est. fire insurance / yr
- $804 – $1,492
Heat risk 3/10 · Minor
- Hot days now (above 101°F)
- 7 days/yr
- Hot days in 30 yrs
- 16 days/yr
Wind risk 2/10 · Minimal
- Chance of severe wind over 30 yrs
- —
Air-quality risk 2/10 · Minimal
- Unhealthy air days now
- 1 days/yr
- Unhealthy air days in 30 yrs
- 2 days/yr
Risk factors via First Street. Map © Google.
Why this score? — see what drove the C grade
The composite is a weighted blend of 9 inputs, each scored 0–100. Each bar is that input's sub-score; the figure is the points it added to the 100-point composite (weight × sub-score).
- Cash flow +21.3/30.0
- ARV discount +15.0/15.0
- 1% rule +7.4/10.0
- DSCR +6.8/10.0
- Livability +3.4/5.0
- Rent growth +2.5/5.0
- Condition / age +2.5/5.0
- Schools +0.9/10.0
- Appreciation +0.0/10.0
$236,000
🖨 Deal sheet 📄 Offer letter ✓ Due diligence
Listing remarks
Well-maintained and full of opportunity, this spacious home is nestled on a quiet, established street in desirable Matteson-offering the perfect blend of comfort today and potential for tomorrow. A ceramic-tiled foyer welcomes you into inviting living spaces highlighted by beautiful hardwood floors and a functional layout designed for everyday living. The kitchen is both practical and promising, featuring granite countertops, custom cabinetry, canned lighting, and a built-in wine refrigerator-ready to enjoy now, with room to elevate to your personal style over time. Bathrooms are finished with ceramic tile, and the freshly painted primary suite provides a private retreat, while all bedrooms
Key facts
- Custom cabinetry
- Large patio
- Ceramic tiled foyer
Tags
Property features AI
Finance
- Other: Property not currently leased
- HOA & community: No master association fee required
Exterior
- Parking: Attached garage (2 spaces); Asphalt driveway; 2 total parking spaces
- Utilities: Public water; Public sewer
- Home design: Detached single-family split-level home; Fee simple ownership; Interstate access nearby
- Construction: Vinyl siding and brick exterior; Built approximately 41–50 years ago; Not remodeled/rebuilt
- Exterior features: Less than 0.25-acre lot
Interior
- Kitchen: Granite counters; Updated kitchen; Range; Microwave; Dishwasher; Refrigerator; Wine refrigerator
- Bedrooms: 4 bedrooms (master bedroom on second level; additional bedrooms on second and lower levels)
- Flooring: Hardwood in living and dining areas; Carpet in bedrooms and lower-level family areas
- Bathrooms: 3 full bathrooms
- Heating & cooling: Natural gas heating; Central air conditioning
- Interior features: 8 total rooms; Enclosed balcony
- Laundry & utility: Laundry room (lower level); Washer; Dryer
Neighborhood map
What this means for you Summary
Snapshot
- This is a 4-bed/2.5-bath single-family listed at $236k.
Deal economics
- At list price, monthly cash flow is $344 ($4k/yr) — positive.
- The deal already cash-flows at list — no discount required.
- Meets the 1% rule at list price ($3k rent vs $236k).
- Recommended offer: $229k (3.0% below list) — sets the bar for market timing.
- Cap rate 8.0% vs local median 6.2% in Matteson — top-decile yield for the area; either an underpriced asset or a hidden risk that comps aren't pricing in. Stress-test before assuming the spread holds.
Location & tenants
- Location reads 67/100 on livability (#525 in IL) — a middle-class / working-renter tenant base. Strengths: employment A+, housing A+, cost of living A; Watch: schools D+, amenities F, commute F.
- Rich Twp Hsd 227 (suburban): math 5% / reading 12% proficiency, ranked #577 of 620 in IL (top 93%) — low school quality limits family demand, transient renter base, plan for 1-2y turnover.
- Market conditions: 69 active listings in the ZIP; 3 comparable units currently listed for rent nearby; rentals leasing fast (median 7d on market — plan ~1-2 weeks tenant-placement turnaround); 6,272 units permitted in Cook County in 2024 (4,658 in 5+ unit buildings).
Forward outlook
- Local home prices are declining (-3.0%/yr); year-one equity from $2k of loan paydown is wiped out by about $7k of value loss. Plan a longer hold.
Negotiation context
- It's been on market 60 days — a 3% lower offer ($229k) is reasonable based on typical stale-listing flexibility.
- 2 sale attempts with the ask held roughly flat each time — persistent listings suggest the price (not the market) is what's stuck; bring a comps-based counter.
Risks & watch-outs
- Watch-outs: property tax is 3.2% of price.
Questions for the listing agent
- It's been on market 60 days. Have you received any prior offers? Is the seller open to a 3% concession, seller financing, or rate buy-down credit?
- Built in 1978 — when were the roof, HVAC, electrical panel, plumbing, and water heater last replaced?
- Property tax is high relative to price — has the assessment been appealed recently, and will the sale trigger a re-assessment?
- Is there a deadline driving the sale (1031 exchange, divorce, estate, relocation)? That informs how much negotiation room exists.
- Schools are D-rated, which usually means shorter tenancies and higher turnover. Who's the typical renter profile here, and what's been the actual vacancy rate?
- What's the average days-on-market for RENTAL listings here right now (not sales)? A rising rental-DOM trend means longer vacancies and softer asking-rent achievability than the comps imply.
- What's the recent tenant-quality profile in this submarket — average credit score on applications, eviction rate, late-payment / NSF rate, and stable-employment percentage? A property-management company in the area should have these aggregated.
- How much new for-sale + rental construction is in the pipeline within 1–3 miles? Heavy new supply typically softens prices + rents 12–24 months out; constrained supply supports both.
Investment metrics
- 1% rule
- 1.24% ✓
- Cap rate
- 8.04%
- Cash-on-cash
- 6.26%
- DSCR
- 1.28
- GRM
- 6.7
CMA / ARV
- ARV (on-the-fly)
- $335,101
- Comps found
- 12
Show comp detail 12 sales within ~0.75 mi
| Address | Dist | Beds/Ba | Sqft | Sold | Price | $/sf | Match |
|---|---|---|---|---|---|---|---|
| 152 Oakhurst Rd | 0.00mi | 4/3.0 | 2,249 (0%) | 1mo | $236,000 | $105 | 97 |
| 50 Willow Rd | 0.26mi | 4/2.5 | 2,233 (-1%) | 1mo | $366,000 | $164 | 86 |
| 6237 Michael Ln | 0.41mi | 4/3.0 | 2,200 (-2%) | 1mo | $300,000 | $136 | 74 |
| 5811 Kathryn Ln | 0.25mi | 4/2.5 | 2,138 (-5%) | 11mo | $339,900 | $159 | 71 |
| 40 Huntingwood Rd | 0.22mi | 4/2.5 | 2,500 (+11%) | 1mo | $260,000 | $104 | 71 |
| 433 Wheatfield Rd | 0.47mi | 4/3.0 | 2,140 (-5%) | 3mo | $365,000 | $171 | 66 |
| 13 Oakview Rd | 0.28mi | 4/2.5 | 1,930 (-14%) | 1mo | $236,000 | $122 | 62 |
| 749 Old Farm Rd | 0.63mi | 4/3.0 | 2,305 (+2%) | 3mo | $235,000 | $102 | 62 |
| 5736 Timberlane Rd | 0.31mi | 4/2.5 | 1,942 (-14%) | 11mo | $329,000 | $169 | 53 |
| 6047 Elm Ln | 0.51mi | 4/2.0 | 2,500 (+11%) | 11mo | $334,900 | $134 | 47 |
| 5522 Mallard Dr | 0.52mi | 3/2.5 (-1) | 1,972 (-12%) | 8mo | $308,000 | $156 | 44 |
| 255 Central Ave | 0.60mi | 4/3.5 | 1,952 (-13%) | 4mo | $289,900 | $149 | 43 |
Match score weights: distance 35% · size 25% · config 20% · recency 20%. Top-matched comps best support the ARV.
Projected returns pro-forma
-3.0% appreciation · 3.0% rent growth · sell at horizon
- IRR
- -6.6%
- Equity multiple
- 0.76×
- Total profit
- $-16,059
- Equity at exit
- $35,188
- IRR
- 3.2%
- Equity multiple
- 1.23×
- Total profit
- $15,262
- Equity at exit
- $20,405
Cash invested: $66,080 (down + closing). Projections, not guarantees.
Landlord ↔ Tenant lean methodology
- Overall (STATE)
- 43 Moderately Tenant-Leaning
- State Illinois
- 43 Moderately Tenant-Leaning · D+7
- County
- — inherits STATE
- City
- — inherits STATE
ZIP-level market 60443
- Home prices YoY
- -32.6%
- Active inventory
- 69
- Price-to-rent
- 6.7×
Monthly cashflow live
- Estimated rent
- $2,916 medium interval (Pro) →
- Mortgage (P&I)
- −$1,238
- Tax from tax record
- −$623 /mo · $7,475/yr
- Insurance
- −$98
- HOA
- −$0
- Vacancy / Maint / Mgmt
- −$612
- Net cashflow
- $344
Break-even live
UW: 25.0% down · 7.5% · 30yr · 1.5% tax · 5.0% vac · 8.0% maint · 8.0% mgmt
Financing live
Cash to close
- Down payment
- $59,000
- Closing costs
- $7,080
- Reserves months
- —
- Total cash needed
- —
Loan-product check · same deal, 3 products live
Conventional
25% down · 7.5% · 30yr
- Down + closing
- —
- Monthly P&I
- —
- Monthly cashflow
- —
- DSCR
- —
- Eligible?
- —
Personal DTI + credit; lowest rate.
DSCR
20% down · 8.5% · 30yr
- Down + closing
- —
- Monthly P&I
- —
- Monthly cashflow
- —
- DSCR
- —
- Eligible?
- —
No personal income docs; deal must DSCR.
Hard money
10% down · 12.0% · 12mo
- Down + closing
- —
- Monthly P&I
- —
- Monthly cashflow
- —
- DSCR
- —
- Eligible?
- —
Short-term bridge; refi at stabilization.
Rent comps 3 comps
| Address | Beds | Baths | Sqft | Rent | $/sqft | DOM | Units | Dist |
|---|---|---|---|---|---|---|---|---|
| 48 Cloverleaf Rd Matteson, IL | 4.0 | 3.0 | 2100 | $2,951 | $1.41 | 10d | 1 | 0.28mi |
| 6048 White Birch Ln Matteson, IL | 3.0 | 2.5 | 1638 | $2,741 | $1.67 | 6d | 1 | 0.58mi |
| 4962 Bennett St Matteson, IL | 2.0–3.0 | 2.5 | 1341 | $3,120 | $2.33 | 1d | 7 | 1.24mi |
Listing history 6 events
-
2026-05-08status Pending
-
2026-04-25historical Contingent - Continue to Show
-
2026-04-18price $236,000
-
2026-03-08$247,500 Active
-
2026-03-08historical
-
2026-01-05Active
ⓘ Source: listings_history table (triggers on properties + properties_extension) + one-shot
backfill from property_details.listing_events for pre-trigger history.
Tax reassessment forecast IL · Partial reset (capped growth)
- Current annual tax
- $7,475 · $623/mo
- Projected year-2 tax
- $7,475 · $623/mo
- Expected delta
- $0/yr ($0/mo · -0.0%)
ⓘ Screening estimate from a state-policy table — verify with the county assessor before closing.
Climate risk First Street
- Flood 1/10 Low FEMA zone X (unshaded) · 0% chance over 30 yrs
- Wildfire 1/10 Low
- Heat 3/10 Moderate 7 d/yr ≥101°F today · 16 d/yr by 30 yrs out
- Wind 2/10 Low
- Air quality 2/10 Low 1 unhealthy d/yr today · 2 by 30 yrs out
Nearby sold comps map
Loading sold comps map…
Walkable amenities ~0.75 mi
Loading nearby amenities…
Taxation est. · year 1
- Rental income
- $34,986
- − Mortgage interest
- −$13,220
- − Property taxes
- −$7,475
- − Insurance
- −$1,180
- − Repairs & maintenance
- −$2,799
- − Management
- −$2,799
- − Depreciation
- −$6,865
- Taxable income
- $649
- Est. tax owed @ 24.0%
- −$156
- After-tax cash flow
- $3,978/yr
For passive investors: Depreciation is non-cash, so a rental often shows a tax loss while cash-flowing — sheltering income. Rental losses are passive: they offset passive income freely, and up to $25,000/yr can offset ordinary (W-2) income if you actively participate and your MAGI is under $100k (phasing out to $0 by $150k); unused losses carry forward. On sale, claimed depreciation is recaptured at up to 25%, and gains may owe capital-gains tax (a 1031 exchange can defer both). Figures are a year-1 estimate at your 24.0% rate — not tax advice; consult a CPA.
Schools (NCES district)
- District
- Rich Twp Hsd 227
- NCES district ID
- 1733420
- Math proficiency
- 5% ▼ -3.00%
- Reading proficiency
- 12% ▬ 0.00%
- Median HH income
- $56,056
- Composite
- 8.93/100
- National rank
- #9885
- State rank
- #577 of 620 in IL
Livability — Matteson
- Score
- 67/100
- State rank
- #525
- US rank
- #10883
Category grades
Schools grade is shown separately in the Schools card above.
Census & demographics
- Census place
- Matteson, IL
- City population
- 20,606
- Population (ZIP)
- 20,606
Population outlook (Cook County) Hauer SSP2
- Today (2025)
- 5,347,519 people
- By 2030
- 5,357,703 · +0.2%
- By 2040
- 5,324,924 · -0.4%
- By 2050
- 5,230,762 · -2.2%
- By 2075
- 4,785,735 · -10.5%
- By 2100
- 4,188,836 · -21.7%
Race, ethnicity, and origin ACS 2023
- Neighborhood character
- Predominantly Black (72%)
- Race & ethnicity
- Black 72% White 18% Two or more races 6% Hispanic / Latino 5% Asian 1%
- Hispanic origin (detail)
- Mexican 4%
- Common ancestry
- Romanian 2%
- Foreign-born
- 4% · Canada
- Languages at home
- 94% English-only · Spanish 4%
Political lean MEDSL · Cook
- 2024 margin
- Solid D (+42.0) · D 70.4% · R 28.4% · Other 1.2%
- 2008→2024 swing
- -11.4pp toward R · 2008: 53.4pp · 2024: 42.0pp
- All cycles
- 2024: D+42.0 2020: D+50.3 2016: D+53.0 2012: D+49.4 2008: D+53.4
Not yet ingested
- Civics
- —
Market trends
- HPI YoY
- ▼ -89.68%
- Current HPI
- 185.4404
- Rent YoY
- —
- Metro
- —
- State GDP YoY
- ▲ 1.59%
- F500 in state
- 60
Industry mix (Fortune 500 HQ in IL)
| Industry | F500 HQs | Revenue |
|---|---|---|
| Insurance | 4 | $201B |
|
||
| Consumer Goods | 4 | $87B |
|
||
| Industrial Machinery | 3 | $64B |
|
||
| Healthcare | 2 | $55B |
|
||
| Retail / Pharmacy | 1 | $148B |
|
||
| Agriculture / Food | 1 | $86B |
|
||
Price history
-4.6% since first listed6 events — show timeline
- 2026-05-08 Pending — MRED as Distributed by MLS Grid
- 2026-04-25 Contingent — MRED as Distributed by MLS Grid
- 2026-04-18 Price Changed $236,000 MRED as Distributed by MLS Grid
- 2026-03-08 Listing Removed — MRED as Distributed by MLS Grid
- 2026-03-08 Listed $247,500 MRED as Distributed by MLS Grid
- 2026-01-05 Listed — MRED as Distributed by MLS Grid
Property tax history
+5.4%/yrLatest (2023): $7,475 · +43.7% YoY. Source: county tax records.
Cash-flow waterfall
monthlySold comps — $/sqft
last 12 mo · ≤1 miLoading sold comps…