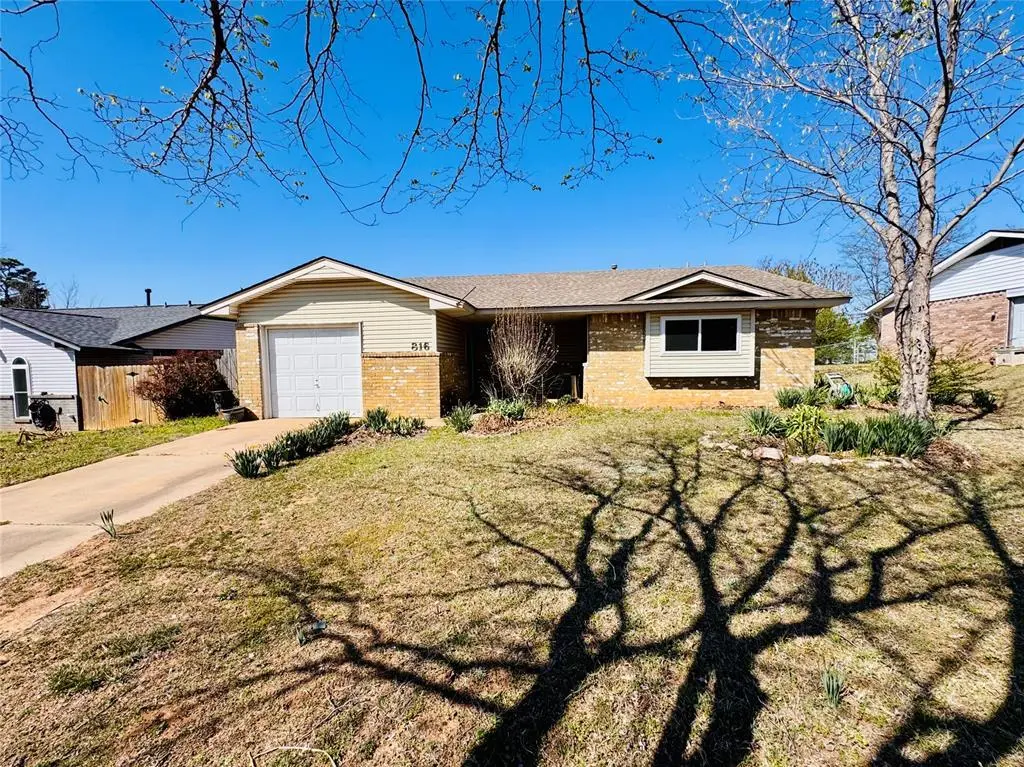
816 E Midland St · Shawnee, OK
Flood risk 1/10 · Minimal
- FEMA flood zone
- X (unshaded)
- Chance of flooding over 30 yrs
- 0.0%
- Est. flood insurance / yr
- $507 – $1,088
Fire risk 6/10 · Moderate
- Est. fire insurance / yr
- $2,463 – $4,575
Heat risk 6/10 · Moderate
- Hot days now (above 109°F)
- 7 days/yr
- Hot days in 30 yrs
- 18 days/yr
Wind risk 3/10 · Minor
- Chance of severe wind over 30 yrs
- 5.0%
Air-quality risk 2/10 · Minimal
- Unhealthy air days now
- 1 days/yr
- Unhealthy air days in 30 yrs
- 1 days/yr
Risk factors via First Street. Map © Google.
Why this score? — see what drove the B- grade
The composite is a weighted blend of 9 inputs, each scored 0–100. Each bar is that input's sub-score; the figure is the points it added to the 100-point composite (weight × sub-score).
- Cash flow +27.2/30.0
- ARV discount +15.0/15.0
- DSCR +9.5/10.0
- 1% rule +6.7/10.0
- Livability +3.2/5.0
- Rent growth +3.1/5.0
- Condition / age +2.5/5.0
- Schools +1.1/10.0
- Appreciation +0.0/10.0
$99,900
🖨 Deal sheet (PDF) 📄 Offer letter ✓ Due diligence
Listing remarks MLS
Nice size home just needs some TLC to become a great rental or would be great for the first time home buyer. Nice location to shopping, dining and medical. Surface Only.
Key facts
- En suite bathroom
- Hvac system replaced
- Covered patio
Tags
Property features AI
Finance
- Other: Located in Brookhaven addition
- Financial info: Not assumable; Loan qualification unknown
- HOA & community: No mandatory association dues
Exterior
- Parking: 1-car garage
- Utilities: Assessor-sourced living area
- Home design: Single-family residence; Residential property; One story; Existing construction
- Construction: Brick and frame construction; Composition roof; Slab foundation; Homestead eligible
- Exterior features: Covered patio; Covered porch; Interior lot
Interior
- Bedrooms: 3 bedrooms
- Bathrooms: 2 full bathrooms; 2 half bathrooms
- Interior features: One-level layout; Living area; Dining area; No fireplace
Neighborhood map
What this means for you Summary
Snapshot
- This is a 3-bed/2.0-bath single-family listed at $100k.
Deal economics
- At list price, monthly cash flow is $287 ($3k/yr) — positive.
- The deal already cash-flows at list — no discount required.
- Meets the 1% rule at list price ($1k rent vs $100k).
- Recommended offer: $97k (3.0% below list) — sets the bar for market timing.
- Cap rate 9.7% vs local median 3.9% in Shawnee — top-decile yield for the area; either an underpriced asset or a hidden risk that comps aren't pricing in. Stress-test before assuming the spread holds.
Location & tenants
- Location reads 63/100 on livability (#217 in OK) — a middle-class / working-renter tenant base. Strengths: cost of living A+, housing A+; Watch: crime F, amenities F, commute F.
- Shawnee (town): math 11% / reading 17% proficiency, ranked #238 of 270 in OK (top 88%) — low school quality limits family demand, transient renter base, plan for 1-2y turnover; 70% free/reduced lunch — lower-income household profile, screen leases tightly.
- Zoned schools: Will Rogers Es (math 12% / reading 13%, grade F, #648 of 845 statewide, top 77%, 400 students, 0% FRL); Shawnee Ms (math 6% / reading 14%, grade F, #277 of 345 statewide, top 83%, 711 students, 0% FRL); Shawnee Hs (math 16% / reading 35%, grade F, #142 of 447 statewide, top 32%, 987 students, 0% FRL) — zoned schools average 0% FRL vs 70% district-wide (70 pts lower); this property's tenant base skews higher-income than the district average.
- Market conditions: Rents rising (+2.5%/yr); 393 active listings in the ZIP; 2 comparable units currently listed for rent nearby; 183 units permitted in Pottawatomie County in 2024 (16 in 5+ unit buildings).
Forward outlook
- Local home prices are declining (-3.0%/yr); year-one equity from $691 of loan paydown is wiped out by about $3k of value loss. Plan a longer hold.
- Pottawatomie County population projected at +12% by 2050 — modest demand growth; plan on rents tracking national, not racing it.
- At projected returns (-3.0% appreciation + 2.5% rent growth), your $28k cash investment doubles in ~10 years — after that, you're playing with house money.
Negotiation context
- It's been on market 31 days — a 3% lower offer ($97k) is reasonable based on typical stale-listing flexibility.
- 3 sale attempts since 22y ago; this cycle's ask has dropped $20k (17%) from the opening price — seller is motivated, your offer sets the floor, not the list.
- Current owner paid $70k; 43% above their basis — modest negotiation headroom, anchor on the comps not their cost.
Risks & watch-outs
- Climate carrying-cost: major wildfire risk; extreme-heat days projected 7→18/yr by 2055 (HVAC capex compounding) — expect insurance premiums to compound above CPI over the hold.
Questions for the listing agent
- It's been on market 31 days. Have you received any prior offers? Is the seller open to a 3% concession, seller financing, or rate buy-down credit?
- Built in 1970 — when were the roof, HVAC, electrical panel, plumbing, and water heater last replaced?
- Is there a deadline driving the sale (1031 exchange, divorce, estate, relocation)? That informs how much negotiation room exists.
- Schools are F-rated, which usually means shorter tenancies and higher turnover. Who's the typical renter profile here, and what's been the actual vacancy rate?
- Crime grade is F in this area — have there been break-ins, vandalism, or insurance claims at this property in the last 3 years? What carrier currently insures it and at what premium?
- What's the average days-on-market for RENTAL listings here right now (not sales)? A rising rental-DOM trend means longer vacancies and softer asking-rent achievability than the comps imply.
- What's the recent tenant-quality profile in this submarket — average credit score on applications, eviction rate, late-payment / NSF rate, and stable-employment percentage? A property-management company in the area should have these aggregated.
- How much new for-sale + rental construction is in the pipeline within 1–3 miles? Heavy new supply typically softens prices + rents 12–24 months out; constrained supply supports both.
Investment metrics
- 1% rule
- 1.17% ✓
- Cap rate
- 9.74%
- Cash-on-cash
- 12.32%
- DSCR
- 1.55
- GRM
- 7.1
CMA / ARV
- ARV (on-the-fly)
- $137,564
- Comps found
- 12
Show comp detail 12 sales within ~0.75 mi
| Address | Dist | Beds/Ba | Sqft | Sold | Price | $/sf | Match |
|---|---|---|---|---|---|---|---|
| 806 E Midland St | 0.06mi | 4/1.0 (+1) | 1,242 (+7%) | 3mo | $142,500 | $115 | 73 |
| 108 E Pulaski St | 0.46mi | 3/1.0 | 1,160 (+0%) | 8mo | $165,000 | $142 | 68 |
| 808 E Midland St | 0.05mi | 3/2.0 | 1,315 (+14%) | 10mo | $174,900 | $133 | 67 |
| 2001 N Mckinley Ave | 0.18mi | 2/1.5 (-1) | 1,059 (-8%) | 6mo | $125,000 | $118 | 66 |
| 1817 N Bell Ave | 0.58mi | 3/1.0 | 1,181 (+2%) | 6mo | $162,500 | $138 | 61 |
| 1205 Carol Dr | 0.61mi | 3/1.0 | 1,172 (+1%) | 10mo | $90,000 | $77 | 57 |
| 1539 N Pennsylvania Ave | 0.60mi | 3/1.0 | 1,086 (-6%) | 3mo | $129,000 | $119 | 56 |
| 29 E Midland St | 0.47mi | 3/1.0 | 1,055 (-9%) | 5mo | $141,000 | $134 | 56 |
| 4 E Pulaski St | 0.55mi | 3/1.0 | 1,002 (-13%) | 1mo | $125,000 | $125 | 48 |
| 1816 N Bell Ave | 0.60mi | 2/1.0 (-1) | 1,052 (-9%) | 4mo | $120,000 | $114 | 45 |
| 9 E Chicago St | 0.53mi | 3/1.0 | 991 (-14%) | 6mo | $115,000 | $116 | 42 |
| 2615 N Market Ave | 0.74mi | 3/2.0 | 1,312 (+14%) | 4mo | $152,500 | $116 | 40 |
Match score weights: distance 35% · size 25% · config 20% · recency 20%. Top-matched comps best support the ARV.
Projected returns pro-forma
-3.0% appreciation · 2.49% rent growth · sell at horizon
- IRR
- 1.4%
- Equity multiple
- 1.05×
- Total profit
- $1,495
- Equity at exit
- $14,895
- IRR
- 10.5%
- Equity multiple
- 1.80×
- Total profit
- $22,374
- Equity at exit
- $8,638
Cash invested: $27,972 (down + closing). Projections, not guarantees.
Landlord ↔ Tenant lean methodology
- Overall (STATE)
- 83 Strongly Landlord-Friendly
- State Oklahoma
- 83 Strongly Landlord-Friendly · R+20
- County
- — inherits STATE
- City
- — inherits STATE
ZIP-level market 74804
- Home prices YoY
- -25.1%
- Rents YoY
- 2.5%
- Active inventory
- 393
- Price-to-rent
- 7.1×
Monthly cashflow live
- Estimated rent
- $1,169 medium interval (Pro) →
- Mortgage (P&I)
- −$524
- Tax from tax record
- −$71 /mo · $847/yr
- Insurance
- −$42
- HOA
- −$0
- Vacancy / Maint / Mgmt
- −$245
- Net cashflow
- $287
Break-even live
Sensitivity live
| Price | -10% $344 | -5% $316 | +0% $287 | +5% $259 | +10% $231 |
|---|---|---|---|---|---|
| Rent | -10% $195 | -5% $241 | +0% $287 | +5% $333 | +10% $380 |
| Rate | -1.0pp $338 | -0.5pp $313 | base $287 | +0.5pp $261 | +1.0pp $235 |
UW: 25.0% down · 7.5% · 30yr · 1.5% tax · 5.0% vac · 8.0% maint · 8.0% mgmt
Financing live
Cash to close
- Down payment
- $24,975
- Closing costs
- $2,997
- Reserves months
- —
- Total cash needed
- —
Loan-product check · same deal, 3 products live
Conventional
25% down · 7.5% · 30yr
- Down + closing
- —
- Monthly P&I
- —
- Monthly cashflow
- —
- DSCR
- —
- Eligible?
- —
Personal DTI + credit; lowest rate.
DSCR
20% down · 8.5% · 30yr
- Down + closing
- —
- Monthly P&I
- —
- Monthly cashflow
- —
- DSCR
- —
- Eligible?
- —
No personal income docs; deal must DSCR.
Hard money
10% down · 12.0% · 12mo
- Down + closing
- —
- Monthly P&I
- —
- Monthly cashflow
- —
- DSCR
- —
- Eligible?
- —
Short-term bridge; refi at stabilization.
Rent comps 2 comps
| Address | Beds | Baths | Sqft | Rent | $/sqft | DOM | Units | Dist |
|---|---|---|---|---|---|---|---|---|
| 1001 E Independence St Shawnee, OK | 1.0–2.0 | 1.0 | 690 | $900 | $1.30 | 6d | 2 | 0.77mi |
| 721 E Wallace St Shawnee, OK | 2.0 | 1.0 | 1176 | $850 | $0.72 | 6d | 1 | 1.27mi |
Listing history 19 events
-
2026-06-21days on market $99,900 Active 31 DOM
-
2026-06-19days on market $99,900 Active 29 DOM
-
2026-06-18days on market $99,900 Active 28 DOM
-
2026-06-17days on market $99,900 Active 27 DOM
-
2026-06-16days on market $99,900 Active 26 DOM
-
2026-06-15days on market $99,900 Active 25 DOM
-
2026-06-14days on market $99,900 Active 23 DOM
-
2026-06-12pricestatusdays on market $99,900 Active 22 DOM
-
2026-04-21status Pending
-
2026-04-13price $114,900
-
2026-03-28$119,900 Active
-
2009-06-01soldstatus $70,000
-
2009-05-28soldstatus $70,000 169-char remark
Show marketing remark (169 chars)
Nice size home just needs some TLC to become a great rental or would be great for the first time home buyer. Nice location to shopping, dining and medical. Surface Only.
-
2009-03-09$69,900 169-char remark
Show marketing remark (169 chars)
Nice size home just needs some TLC to become a great rental or would be great for the first time home buyer. Nice location to shopping, dining and medical. Surface Only.
-
2004-08-30soldstatus $71,000
-
2004-08-27soldstatus $71,000 168-char remark
Show marketing remark (168 chars)
Welcome home! This 3BR/2BA home has updated ceramic tile, kitchen counter tops, & vent hood. CH&A, fenced yard, berber carpet - it's all ready for a new family!
-
2004-06-19$73,900 168-char remark
Show marketing remark (168 chars)
Welcome home! This 3BR/2BA home has updated ceramic tile, kitchen counter tops, & vent hood. CH&A, fenced yard, berber carpet - it's all ready for a new family!
-
2001-04-30soldstatus $61,500
-
1996-10-31soldstatus $50,000
ⓘ Source: listings_history table (triggers on properties + properties_extension) + one-shot
backfill from property_details.listing_events for pre-trigger history.
Tax reassessment forecast OK · Resets to sale price
- Current annual tax
- $847 · $71/mo
- Projected year-2 tax
- $899 · $75/mo
- Expected delta
- +$52/yr (+$4/mo · 6.2%)
ⓘ Screening estimate from a state-policy table — verify with the county assessor before closing.
Climate risk First Street
- Flood 1/10 Low FEMA zone X (unshaded) · 0% chance over 30 yrs
- Wildfire 6/10 Major
- Heat 6/10 Major 7 d/yr ≥109°F today · 18 d/yr by 30 yrs out
- Wind 3/10 Moderate 5% chance of damaging wind over 30 yrs
- Air quality 2/10 Low 1 unhealthy d/yr today · 1 by 30 yrs out
Nearby sold comps map
Loading sold comps map…
Walkable amenities ~0.75 mi
Loading nearby amenities…
Taxation est. · year 1
- Rental income
- $14,026
- − Mortgage interest
- −$5,596
- − Property taxes
- −$847
- − Insurance
- −$500
- − Repairs & maintenance
- −$1,122
- − Management
- −$1,122
- − Depreciation
- −$2,906
- Taxable income
- $1,933
- Est. tax owed @ 24.0%
- −$464
- After-tax cash flow
- $2,983/yr
For passive investors: Depreciation is non-cash, so a rental often shows a tax loss while cash-flowing — sheltering income. Rental losses are passive: they offset passive income freely, and up to $25,000/yr can offset ordinary (W-2) income if you actively participate and your MAGI is under $100k (phasing out to $0 by $150k); unused losses carry forward. On sale, claimed depreciation is recaptured at up to 25%, and gains may owe capital-gains tax (a 1031 exchange can defer both). Figures are a year-1 estimate at your 24.0% rate — not tax advice; consult a CPA.
Schools (NCES district)
- District
- Shawnee
- NCES district ID
- 4027570
- Math proficiency
- 11% ▼ -10.00%
- Reading proficiency
- 17% ▼ -10.00%
- Median HH income
- $32,128
- Composite
- 11.21/100
- National rank
- #9724
- State rank
- #238 of 270 in OK
Livability — Shawnee
- Score
- 63/100
- State rank
- #217
- US rank
- #15593
Category grades
Schools grade is shown separately in the Schools card above.
Census & demographics
- Census place
- Shawnee, OK
- County
- Pottawatomie County · 45,194 people
- City population
- 45,194
- Metro
- Shawnee, OK
- Population (ZIP)
- 23,227
- Household income
- $67,631
- Rent vs Own
- Severe rent burden
- 442.0
Population outlook (Pottawatomie County) Hauer SSP2
- Today (2025)
- 76,622 people
- By 2030
- 78,816 · +2.9%
- By 2040
- 82,766 · +8.0%
- By 2050
- 86,031 · +12.3%
- By 2075
- 93,316 · +21.8%
- By 2100
- 95,820 · +25.1%
Race, ethnicity, and origin ACS 2023
- Neighborhood character
- Predominantly White (70%)
- Race & ethnicity
- White 70% Two or more races 11% Native American 11% Hispanic / Latino 6% Black 4%
- Hispanic origin (detail)
- Mexican 4%
- Common ancestry
- Slovak 2% Lithuanian 2% Italian 1%
- Foreign-born
- 3% · Canada
- Languages at home
- 96% English-only · Spanish 3%
Political lean MEDSL · Pottawatomie
- 2024 margin
- Solid R (+47.4) · D 25.2% · R 72.7% · Other 2.1%
- 2008→2024 swing
- -9.1pp toward R · 2008: -38.4pp · 2024: -47.4pp
- All cycles
- 2024: R+47.4 2020: R+46.0 2016: R+46.5 2012: R+38.7 2008: R+38.4
Not yet ingested
- Civics
- —
Market trends
- HPI YoY
- ▼ -83.01%
- Current HPI
- 247.115
- Rent YoY
- ▲ 2.49%
- Metro
- Shawnee, OK
- State GDP YoY
- ▲ 1.55%
- F500 in state
- 6
Industry mix (Fortune 500 HQ in OK)
| Industry | F500 HQs | Revenue |
|---|---|---|
| Energy | 3 | $48B |
|
||
Price history
+129.8% since first listed11 events — show timeline
- 2026-04-21 Pending — MLSOK
- 2026-04-13 Price Changed $114,900 MLSOK
- 2026-03-28 Listed $119,900 MLSOK
- 2009-06-01 Sold (Public Records) $70,000 Public Records
- 2009-05-28 Sold (MLS) $70,000 MLSOK
- 2009-03-09 Listed $69,900 MLSOK
- 2004-08-30 Sold (Public Records) $71,000 Public Records
- 2004-08-27 Sold (MLS) $71,000 MLSOK
- 2004-06-19 Listed $73,900 MLSOK
- 2001-04-30 Sold (Public Records) $61,500 Public Records
- 1996-10-31 Sold (Public Records) $50,000 Public Records
Property tax history
+1.0%/yrLatest (2025): $847 · +2.5% YoY. Source: county tax records.
Cash-flow waterfall
monthlySold comps — $/sqft
last 12 mo · ≤1 miLoading sold comps…