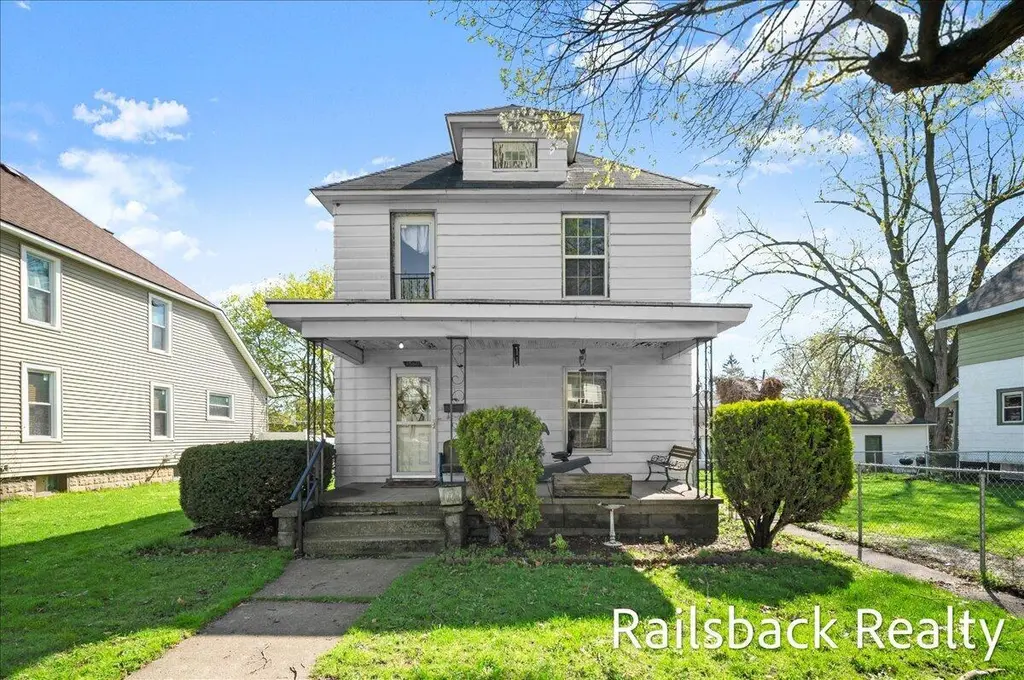
1560 Hamilton Ave NW · Grand Rapids, MI
Flood risk 5/10 · Moderate
- FEMA flood zone
- D
- Chance of flooding over 30 yrs
- 0.24%
- Est. flood insurance / yr
- $400 – $4,352
Fire risk 1/10 · Minimal
- Est. fire insurance / yr
- $784 – $1,456
Heat risk 2/10 · Minimal
- Hot days now (above 96°F)
- 7 days/yr
- Hot days in 30 yrs
- 16 days/yr
Wind risk 2/10 · Minimal
- Chance of severe wind over 30 yrs
- —
Air-quality risk 3/10 · Minor
- Unhealthy air days now
- 2 days/yr
- Unhealthy air days in 30 yrs
- 3 days/yr
Risk factors via First Street. Map © Google.
Why this score? — see what drove the B- grade
The composite is a weighted blend of 9 inputs, each scored 0–100. Each bar is that input's sub-score; the figure is the points it added to the 100-point composite (weight × sub-score).
- Cash flow +30.0/30.0
- DSCR +10.0/10.0
- 1% rule +7.8/10.0
- ARV discount +7.5/15.0
- Livability +4.2/5.0
- Rent growth +3.2/5.0
- Condition / age +2.5/5.0
- Schools +1.9/10.0
- Appreciation +0.0/10.0
$200,000
🖨 Deal sheet 📄 Offer letter ✓ Due diligence
Listing remarks MLS
Sold before broadcast
Key facts
- 8,973 sq ft lot
- 3 garage spots
- Built 1905
Property features AI
Exterior
- Parking: Attached 3-car garage
- Utilities: Public water; Natural gas connected
- Home design: Traditional single-family home; Built in 1905
- Construction: Aluminum siding
- Exterior features: Sidewalk; Wooded yard; Paved road access
Interior
- Kitchen: Range; Refrigerator
- Bedrooms: Primary bedroom; Three additional bedrooms
- Bathrooms: 2 full bathrooms; 2 half bathrooms
- Heating & cooling: Hot water heating
- Interior features: Eat-in kitchen; Den; Living room
- Laundry & utility: Full basement
Neighborhood map
What this means for you Summary
Snapshot
- This is a 5-bed/1.0-bath single-family listed at $200k.
Deal economics
- At list price, monthly cash flow is $775 ($9k/yr) — positive.
- The deal already cash-flows at list — no discount required.
- Meets the 1% rule at list price ($3k rent vs $200k).
- Cap rate 10.9% vs local median 4.5% in Grand Rapids — top-decile yield for the area; either an underpriced asset or a hidden risk that comps aren't pricing in. Stress-test before assuming the spread holds.
Location & tenants
- Location reads 83/100 on livability (#44 in MI, #939 nationally) — a professional / high-income tenant draw. Strengths: amenities A+, commute A+, cost of living A+; Watch: employment C-, crime F.
- Grand Rapids Public Schools (urban): math 15% / reading 29% proficiency, ranked #451 of 540 in MI (top 84%) — low school quality limits family demand, transient renter base, plan for 1-2y turnover; 80% free/reduced lunch — lower-income household profile, screen leases tightly.
- Market conditions: Rents rising (+2.6%/yr); 153 active listings in the ZIP; 5 comparable units currently listed for rent nearby; rentals lingering (median 44d on market — plan ~5-8 weeks vacancy on turnover, expect pricing pressure); 80% of comp listings sitting > 30 days — soft ceiling on asking rent; 2,253 units permitted in Kent County in 2024 (969 in 5+ unit buildings).
- This rent runs 44% of the median local income ($70k/yr) — at the standard rent-burdened threshold; future hikes will face affordability resistance.
Forward outlook
- Local home prices are declining (-3.0%/yr); year-one equity from $1k of loan paydown is wiped out by about $6k of value loss. Plan a longer hold.
- Kent County population projected at +22% by 2050 — long-run rental-demand tailwind backs the buy-and-hold thesis.
- At projected returns (-3.0% appreciation + 2.6% rent growth), your $56k cash investment doubles in ~8 years — after that, you're playing with house money.
Negotiation context
- Only 1 days on market — expect competitive offers; lowballing is unlikely to land.
- 7 sale attempts since 31y ago with the ask held roughly flat each time — persistent listings suggest the price (not the market) is what's stuck; bring a comps-based counter.
- Current owner paid $63k; list at $200k implies a 217% gain — meaningful room to come down on a strong offer.
Risks & watch-outs
- Watch-outs: built in 1905 — expect roof / HVAC / electrical / plumbing capex.
- Climate carrying-cost: moderate flood risk — expect insurance premiums to compound above CPI over the hold.
Questions for the listing agent
- Built in 1905 — when were the roof, HVAC, electrical panel, plumbing, and water heater last replaced?
- Is there a deadline driving the sale (1031 exchange, divorce, estate, relocation)? That informs how much negotiation room exists.
- Crime grade is F in this area — have there been break-ins, vandalism, or insurance claims at this property in the last 3 years? What carrier currently insures it and at what premium?
- What's the average days-on-market for RENTAL listings here right now (not sales)? A rising rental-DOM trend means longer vacancies and softer asking-rent achievability than the comps imply.
- What's the recent tenant-quality profile in this submarket — average credit score on applications, eviction rate, late-payment / NSF rate, and stable-employment percentage? A property-management company in the area should have these aggregated.
- How much new for-sale + rental construction is in the pipeline within 1–3 miles? Heavy new supply typically softens prices + rents 12–24 months out; constrained supply supports both.
Investment metrics
- 1% rule
- 1.28% ✓
- Cap rate
- 10.94%
- Cash-on-cash
- 16.61%
- DSCR
- 1.74
- GRM
- 6.5
CMA / ARV
No comps found within radius.
Projected returns pro-forma
-3.0% appreciation · 2.64% rent growth · sell at horizon
- IRR
- 7.3%
- Equity multiple
- 1.29×
- Total profit
- $15,996
- Equity at exit
- $29,821
- IRR
- 16.3%
- Equity multiple
- 2.31×
- Total profit
- $73,558
- Equity at exit
- $17,292
Cash invested: $56,000 (down + closing). Projections, not guarantees.
Landlord ↔ Tenant lean methodology
- Overall (STATE)
- 62 Landlord-Friendly
- State Michigan
- 62 Landlord-Friendly · EVEN
- County
- — inherits STATE
- City
- — inherits STATE
ZIP-level market 49504
- Rents YoY
- 2.6%
- Active inventory
- 153
- Price-to-rent
- 6.5×
Monthly cashflow live
- Estimated rent
- $2,552 high interval (Pro) →
- Mortgage (P&I)
- −$1,049
- Tax from tax record
- −$109 /mo · $1,304/yr
- Insurance
- −$83
- HOA
- −$0
- Vacancy / Maint / Mgmt
- −$536
- Net cashflow
- $775
Break-even live
UW: 25.0% down · 7.5% · 30yr · 1.5% tax · 5.0% vac · 8.0% maint · 8.0% mgmt
Financing live
Cash to close
- Down payment
- $50,000
- Closing costs
- $6,000
- Reserves months
- —
- Total cash needed
- —
Loan-product check · same deal, 3 products live
Conventional
25% down · 7.5% · 30yr
- Down + closing
- —
- Monthly P&I
- —
- Monthly cashflow
- —
- DSCR
- —
- Eligible?
- —
Personal DTI + credit; lowest rate.
DSCR
20% down · 8.5% · 30yr
- Down + closing
- —
- Monthly P&I
- —
- Monthly cashflow
- —
- DSCR
- —
- Eligible?
- —
No personal income docs; deal must DSCR.
Hard money
10% down · 12.0% · 12mo
- Down + closing
- —
- Monthly P&I
- —
- Monthly cashflow
- —
- DSCR
- —
- Eligible?
- —
Short-term bridge; refi at stabilization.
Rent comps 5 comps
| Address | Beds | Baths | Sqft | Rent | $/sqft | DOM | Units | Dist |
|---|---|---|---|---|---|---|---|---|
| 523 Crosby St NW Grand Rapids, MI | 5.0 | 2.0 | 1701 | $2,200 | $1.29 | 43d | 1 | 0.35mi |
| 927 Arianna St NW Grand Rapids, MI | 4.0 | 3.0 | 1500 | $3,000 | $2.00 | 43d | 1 | 0.65mi |
| 138 Travis St NE Grand Rapids, MI | 4.0 | 2.0 | 1800 | $2,395 | $1.33 | 11d | 1 | 0.73mi |
| 700 Broadway Ave NW Unit 1 Grand Rapids, MI | 4.0 | 2.0 | 1450 | $2,795 | $1.93 | 43d | 1 | 1.10mi |
| 519 Shirley St NE Grand Rapids, MI | 5.0 | 2.0 | 1192 | $2,045 | $1.72 | 43d | 1 | 1.49mi |
Listing history 14 events
-
2026-04-28status Pending
-
2026-04-27historical 21-char remark
Show marketing remark (21 chars)
Sold before broadcast
-
2026-04-27historical 21-char remark
Show marketing remark (21 chars)
Sold before broadcast
-
2026-04-26$200,000 Active
Show marketing remark (21 chars)
Sold before broadcast
-
2026-04-26$200,000 21-char remark
Show marketing remark (21 chars)
Sold before broadcast
-
2026-04-26$200,000 21-char remark
Show marketing remark (21 chars)
Sold before broadcast
-
2015-02-09historical
-
2009-12-29historical
-
2009-06-29$69,900
-
2009-06-29$69,900
-
1995-09-29soldstatus $63,000
-
1995-09-29soldstatus $63,000
-
1995-07-06$61,900
-
1995-07-06$61,900
ⓘ Source: listings_history table (triggers on properties + properties_extension) + one-shot
backfill from property_details.listing_events for pre-trigger history.
Tax reassessment forecast MI · Partial reset (capped growth)
- Current annual tax
- $1,304 · $109/mo
- Projected year-2 tax
- $2,192 · $183/mo
- Expected delta
- +$888/yr (+$74/mo · 68.1%)
ⓘ Screening estimate from a state-policy table — verify with the county assessor before closing.
Climate risk First Street
- Flood 5/10 Major FEMA zone D · 24% chance over 30 yrs
- Wildfire 1/10 Low
- Heat 2/10 Low 7 d/yr ≥96°F today · 16 d/yr by 30 yrs out
- Wind 2/10 Low
- Air quality 3/10 Moderate 2 unhealthy d/yr today · 3 by 30 yrs out
Nearby sold comps map
Loading sold comps map…
Walkable amenities ~0.75 mi
Loading nearby amenities…
Taxation est. · year 1
- Rental income
- $30,623
- − Mortgage interest
- −$11,203
- − Property taxes
- −$1,304
- − Insurance
- −$1,000
- − Repairs & maintenance
- −$2,450
- − Management
- −$2,450
- − Depreciation
- −$5,818
- Taxable income
- $6,398
- Est. tax owed @ 24.0%
- −$1,536
- After-tax cash flow
- $7,767/yr
For passive investors: Depreciation is non-cash, so a rental often shows a tax loss while cash-flowing — sheltering income. Rental losses are passive: they offset passive income freely, and up to $25,000/yr can offset ordinary (W-2) income if you actively participate and your MAGI is under $100k (phasing out to $0 by $150k); unused losses carry forward. On sale, claimed depreciation is recaptured at up to 25%, and gains may owe capital-gains tax (a 1031 exchange can defer both). Figures are a year-1 estimate at your 24.0% rate — not tax advice; consult a CPA.
Schools (NCES district)
- District
- Grand Rapids Public Schools
- NCES district ID
- 2616440
- Math proficiency
- 15% ▼ -5.00%
- Reading proficiency
- 29% ▼ -1.00%
- Median HH income
- $40,612
- Composite
- 18.62/100
- National rank
- #8899
- State rank
- #451 of 540 in MI
Livability — Grand Rapids
- Score
- 83/100
- State rank
- #44
- US rank
- #939
Category grades
Schools grade is shown separately in the Schools card above.
Census & demographics
- Census place
- Grand Rapids, MI
- County
- Kent County · 533,805 people
- City population
- 181,325
- Metro
- Grand Rapids-Kentwood, MI
- Population (ZIP)
- 40,036
- Household income
- $70,119
- Rent vs Own
- Severe rent burden
- 2132.0
Population outlook (Kent County) Hauer SSP2
- Today (2025)
- 712,484 people
- By 2030
- 748,618 · +5.1%
- By 2040
- 814,777 · +14.4%
- By 2050
- 868,556 · +21.9%
- By 2075
- 966,487 · +35.7%
- By 2100
- 967,975 · +35.9%
Race, ethnicity, and origin ACS 2023
- Neighborhood character
- Predominantly White (70%)
- Race & ethnicity
- White 70% Hispanic / Latino 16% Two or more races 10% Black 8% Asian 2%
- Hispanic origin (detail)
- Mexican 12% Puerto Rican 1%
- Common ancestry
- Romanian 11% Iranian 10% Lithuanian 3%
- Foreign-born
- 8% · Canada, South Korea, China
- Languages at home
- 88% English-only · Spanish 9% Other Indo-European 1%
Political lean MEDSL · Kent
- 2024 margin
- Lean D (+5.4) · D 51.8% · R 46.5% · Other 1.7%
- 2008→2024 swing
- +4.8pp toward D · 2008: 0.5pp · 2024: 5.4pp
- All cycles
- 2024: D+5.4 2020: D+6.1 2016: R+3.1 2012: R+7.9 2008: D+0.5
Not yet ingested
- Civics
- —
Market trends
- HPI YoY
- ▼ -274.76%
- Current HPI
- 313.231
- Rent YoY
- ▲ 2.64%
- Metro
- Grand Rapids-Kentwood, MI
- State GDP YoY
- ▲ 1.37%
- F500 in state
- 28
Industry mix (Fortune 500 HQ in MI)
| Industry | F500 HQs | Revenue |
|---|---|---|
| Automotive Parts | 3 | $48B |
|
||
| Automotive | 2 | $372B |
|
||
| Chemicals | 1 | $45B |
|
||
| Automotive Retail | 1 | $29B |
|
||
| Healthcare / Medical Devices | 1 | $23B |
|
||
| Automotive Technology | 1 | $20B |
|
||
Price history
+223.1% since first listed14 events — show timeline
- 2026-04-28 Pending — SW Michigan MLS
- 2026-04-27 Listing Removed — REALCOMP
- 2026-04-27 Listing Removed — MiRealSource-MiMLS
- 2026-04-26 Listed $200,000 REALCOMP
- 2026-04-26 Listed $200,000 MiRealSource-MiMLS
- 2026-04-26 Listed $200,000 SW Michigan MLS
- 2015-02-09 Listing Removed — SW Michigan MLS
- 2009-12-29 Listing Removed — REALCOMP
- 2009-06-29 Listed $69,900 REALCOMP
- 2009-06-29 Listed $69,900 SW Michigan MLS
- 1995-09-29 Sold (MLS) $63,000 REALCOMP
- 1995-09-29 Sold (MLS) $63,000 SW Michigan MLS
- 1995-07-06 Listed $61,900 REALCOMP
- 1995-07-06 Listed $61,900 SW Michigan MLS
Property tax history
+2.6%/yrLatest (2025): $1,304 · -3.6% YoY. Source: county tax records.
Cash-flow waterfall
monthlySold comps — $/sqft
last 12 mo · ≤1 miLoading sold comps…